|
- Interim Update 25th April 2007
Copyright
Reminder
The commentaries that appear at TSI
may not be distributed, in full or in part, without our written permission.
In particular, please note that the posting of extracts from TSI commentaries
at other web sites or providing links to TSI commentaries at other web
sites (for example, at discussion boards) without our written permission
is prohibited.
We reserve the right to immediately
terminate the subscription of any TSI subscriber who distributes the TSI
commentaries without our written permission.
Gold and the Fed
...the Fed only cares about gold to the extent that movements in the gold price affect the bond market.
In the latest Weekly Update we wrote: "...an
upside breakout by the gold price in the face of widespread strength in
cyclical assets would likely provoke a serious tightening of monetary
policy, which would, in turn, have the potential to halt the gold rally
in its tracks. Or, to put it another way: in the absence of sufficient
weakness in growth-oriented investments to mask an inflation threat
and, thus, to prevent the Fed from fighting the breakout, a move to new
highs by the gold price would probably contain the seeds of its own
quick reversal." This prompted e-mails from a few subscribers
arguing that the Fed will be too concerned about causing additional
damage to an already-weak housing market to initiate another
rate-hiking campaign in the foreseeable future. These e-mails have, in
turn, prompted us to further explain our view in today's commentary.
Firstly, we agree that if at all possible the Fed will want to avoid a
recession. At the moment this does not appear to be an issue, though,
because the financial markets are saying that a recession is NOT on the
cards for this year. Perhaps the markets will be proven wrong and will
have to make big adjustments to bring themselves into line with
reality, but as things currently stand the unequivocal message
emanating from growth-oriented markets is that the US economy will be
stable and that the global economy will remain strong over the
remainder of 2007. And as long as the markets keep sending this message
the Fed will not be afraid to tighten monetary policy, which is why we
think an upside breakout by the gold price will be unsustainable IF it
occurs alongside widespread strength in cyclical assets.
The above point is related to the widely held, but very mistaken,
belief that stronger economic growth causes the prices of goods and
services to rise. As a result of this general misunderstanding a
serious downturn in economic growth -- signaled by weakness in
growth-oriented markets such as equities, industrial commodities and
high-yield debt -- would probably reduce the PERCEIVED inflation
threat, thus paving the way for gold to rise without prompting
aggressive counter-measures from the central bank. Under such
circumstances the smart money could bid-up the price of gold in
anticipation of the central bank's attempts to inflate its way out of
another economic mess caused by the unraveling of an inflation-fueled
boom, while the masses remain blissfully unaware of the growing threat
to the value of their money.
Secondly and perhaps more importantly, the Fed only cares about gold to
the extent that movements in the gold price affect the bond market.
This is because the long-term interest rate set by the bond market
affects valuations in the stock and property markets.
The Fed's problem -- the reason it fears an out-of-control rise in
inflation expectations beyond anything else -- is that its only real
policy option in the face of rising inflation expectations is to hike
the Fed Funds rate. In particular, when bond yields accelerate upward
in response to rising inflation fears the Fed must hike the official
short-term interest rate in order to quell these fears and bring bond
yields back down. There is no alternative because to leave the Fed
Funds rate unchanged or to reduce it under such conditions would result
in HIGHER long-term interest rates. In other words, if we get to the
point where long-term interest rates are being driven sharply higher by
fears of inflation then the only way for the Fed to HELP the housing
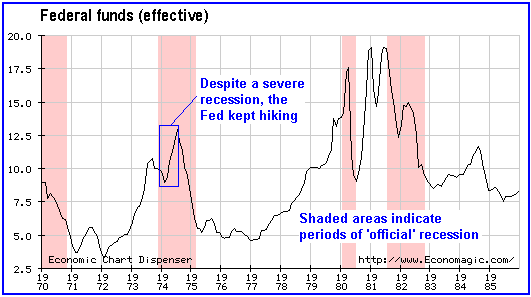
market will be to HIKE the official short-term rate. It was for similar
reasons that the Fed Funds rate was pushed upward during the first half
of the 1974-1975 recession (see chart below).
The current situation
is very different to 1974 and an out-of-control surge in inflation
expectations does not appear to be an imminent threat. However,
Bernanke and Co. are no doubt well aware of what went wrong during the
70s and will not want a similar predicament to occur on their watch. We
therefore expect that they will be quick to address a rise in inflation
fears, especially when the financial markets are shouting "no recession
on the horizon".
The Stock Market
Everything's Under Control
The difference between the yield on a 10-year T-Note and the yield on a
so-called inflation-protected 10-year T-Note is what we call the
"Expected CPI". As an indicator of inflation expectations it is far
from ideal because, notwithstanding popular opinion to the contrary,
the CPI does not represent the effects of inflation; rather, it
represents the inflationary effects that the government admits to. The
Expected CPI therefore tells us the amount of currency depreciation the
market expects the US Government to admit to over the next few years.
The following fullermoney.com
chart shows that the Expected CPI has spent the past 3.5 years
oscillating within a very narrow range bounded at the bottom by 2.23%
and at the top by 2.73%. We have previously referred to this 0.5% range
as the "Everything's Under Control Range". As long as the Expected CPI
remains within this range we suspect that a) T-Bond futures will stay
above their August-2003 low and below their June-2003 high, and b)
stock market valuations will remain elevated. Furthermore, we think the
markets will become unstable should the Expected CPI break below the
bottom or above the top of its multi-year range. In particular, we
think a breakout in either direction would create a big problem for the
equity market because a downside breakout would signal a deflation
scare and an upside breakout would signal an inflation scare. In both
cases, equity valuation compression would be a likely consequence.
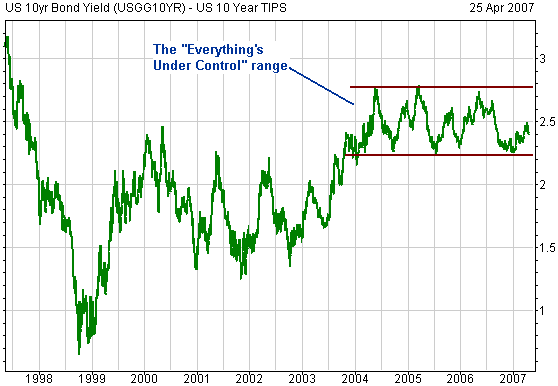
The Expected CPI has
been edging upward over the past few months, but it is still within the
bottom half of the "Everything's Under Control Range". This means there
is still some scope for inflation expectations to rise from here
without causing an equity market problem.
If the Expected CPI moves up to near the top of its multi-year range at
some point over the next few weeks then the Fed will, we think, either
hike the official target rate immediately or make it crystal clear to
the markets that the next move WILL be a rate hike.
Current Market Situation
The price action is not yet giving any indication that a top is at
hand. For example, the Dow Transportation Average closed at a new
all-time high on Wednesday, which is a positive omen for the stock
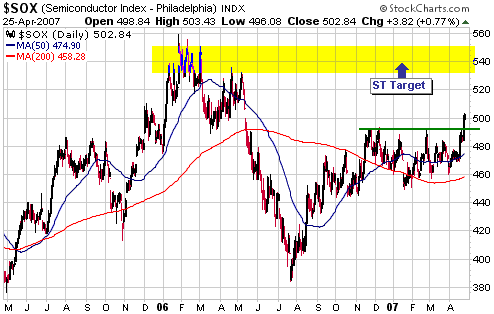
market and for global growth. Also, the following chart shows that the
Semiconductor Index (SOX) has just broken-out to the upside from a
5-month consolidation pattern -- an event that suggests additional
gains are likely over the coming weeks.
From a short-term
perspective the only problem is that the market, as a whole, is
extended like a rubber band stretched almost to the breaking point. To
be specific: momentum indicators are well into 'overbought' territory;
the market has risen in almost a straight line since mid March; and
after having rocketed upward during the Feb-Mar correction the number
of shares sold short by the public has now dropped back to near the
lows of the past year (the 'short-covering fuel' has been used up).
But despite the rampant optimism that permeates the stock market most
people still appear to be operating under the impression that the Fed
will commence a rate-cutting campaign during the second half of this
year. This makes no sense at all. Either things are going to get bad
enough across the board to cause short-term interest rates to fall, or
the strong growth that's currently being priced into equities is going
to materialise. You can't have it both ways!
Nothing looks particularly safe right now, but we think the safest way
to play a continuation of the stock market rally is via the producers
of industrial metals. The semiconductor sector also looks reasonable
for a short-term trade, although we aren't planning to make any
specific recommendations in that area.
Gold and
the Dollar
Gold Stocks
Current Market Situation
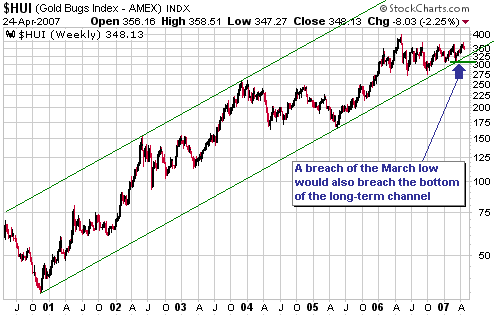
The following weekly chart shows the HUI's long-term channel. If an
intermediate-term peak is put in place within the coming few weeks then
the subsequent decline will breach the channel bottom. If this happens
it won't mean that the long-term bull market is over, it will just be a
sign that a multi-month correction is underway. However, if the top we
expect to occur within the coming few weeks is of the short-term
variety then the ensuing decline should not result in a breach of the
channel bottom. In other words, the ability -- or otherwise -- of the
HUI to remain within its long-term channel during the next decline will
help us differentiate an intermediate-term correction from the
short-term variety.
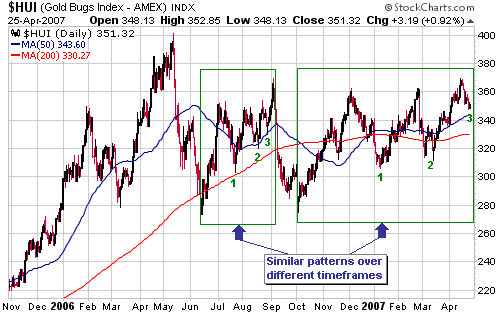
With reference to the
following daily chart of the HUI, it occurs to us that the price
pattern since early October is an elongated version of the price
pattern that unfolded between June and September of last year. If the
similarities continue then the HUI will reach an interim low soon (if
it hasn't bottomed already) and then surge to new year-to-date highs;
and a few days after breaking to new highs for the year it will reverse
lower. A continuation of the similarities would be consistent with our
short-term forecast for a peak in the 370-400 range within the next few
weeks.
On a side note, one of the good -- if you can call it that -- things
about the gold sector is that it normally doesn't leave you guessing
for long near important peaks. You generally don't get rounded tops or
gradual losses of upside momentum; instead, you get vicious downward
reversals. In other words, the initial decline following a peak is
usually sharp enough to make you sit up and take notice. The fact that
the HUI's drop from its mid-April high has been slow and steady is
therefore evidence that the rally has not yet run its course.
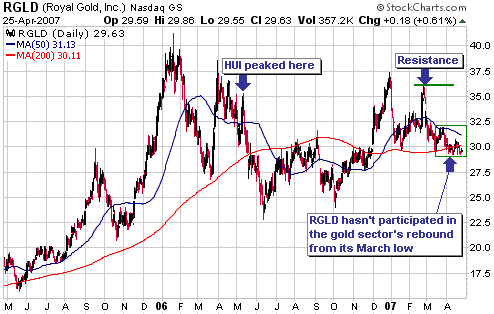
As noted in previous
commentaries, Royal Gold (NYSE: RGLD) has a tendency to lead the gold
sector at important turning points (especially peaks). For example and
with reference to the following chart, RGLD's 2006 peak occurred in
January -- almost 5 months prior to the HUI's peak. Also, as the HUI
trended relentlessly higher from the beginning of April through to
early May of 2006, RGLD made a sequence of lower highs and lower lows.
This was a notable bearish divergence.
Given RGLD's tendency to lead, a bearish divergence is potentially
building at this time in that RGLD peaked last December and has not
participated in the gold sector's rebound from its March low. To
eliminate this divergence RGLD would have to break its sequence of
declining tops by closing above its late-February high.
When equity issues make sense
We often cringe when we read about a new issue of equity by a junior
resource company in which we have an interest. It is not uncommon for
this type of financing to be done at such an inopportune time (with the
stock very under-valued) and at such a large discount to the current
market price (especially when a fair value is assigned to the warrants
that usually come with the new shares) that we sometimes get the
feeling that the company's management is working against us. However,
some managers have shown themselves to be adept at timing/negotiating
new equity deals, and today we'll mention two current examples of
equity issues that make sense from the perspective of existing
shareholders.
The first example is the recently completed issue of 10M new shares by
Gammon Lake Resources (AMEX: GRS, TSX: GAM), a member of the TSI Stocks
List.
This was a well-negotiated and well-timed deal because a) the issue
price of C$20 is within 5% of the stock's all-time high, b) at
C$20/share the stock has a significant valuation premium, and c) no
warrants were issued. The funds received will be used to eliminate debt
-- thus reducing risk -- and to increase production.
Gammon's Ocampo gold/silver mine is going to throw-off a huge amount of
cash over the coming 12 months so there was no pressing need to issue
more equity, but the optimum time to raise money is not when you really
need the money but when you can raise it on very attractive terms.
The second example is the recently completed issue of 12.5M new shares
by NovaGold Resources (TSX and AMEX: NG), a former -- and potentially
future -- member of the TSI Stocks List.
Over the years NG's management has consistently been good at timing
equity financings, with most new shares being issued when the stock
price has been close to a 52-week high. The most recent financing is no
exception in that a) the US$16.25 price for the new shares is within
10% of the all-time high, b) at the issue price the stock's valuation
is relatively high, and c) no warrants were issued. Unlike Gammon, NG
is a long way from being a cash generator and was going to need
additional financing at some point over the coming several months to
fund the development of the Galore Creek project; but rather than
waiting until it actually needed an injection of money it issued the
new shares into a buyers' market and was thus able to achieve
attractive terms.
As an aside, we might return to NG at some future point, but only at a
substantially lower valuation and/or at a time when the Galore Creek
development risk has been greatly reduced.
Gold
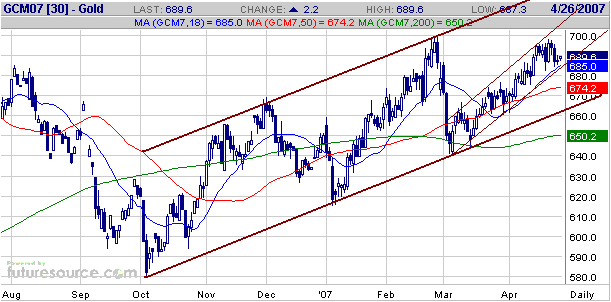
Below is a daily chart of June gold futures.
Gold is consolidating just below the big round number (700). It stands
a good chance of breaking above 700 within the next three weeks and
testing its May-2006 peak (around 730).
In order to maintain the potential to test last year's peak the June contract should not close below $660.
Update
on Stock Selections
(Note: To review the complete list of current TSI stock selections, logon at http://www.speculative-investor.com/new/market_logon.asp
and then click on "Stock Selections" in the menu. When at the Stock
Selections page, click on a stock's symbol to bring-up an archive of our comments on the stock in question)
 Teck Cominco (TCK) Call Options Teck Cominco (TCK) Call Options
We added the TCK August-2007 $75 call options (TCKHO) to the Stocks
List in the 16th April Weekly Update. A sharp rally in the stock on the
next trading day prevented anyone from buying the calls near our
suggested price, but fortunately it then pulled back for several days
and, as a result, the calls became available at around our suggested
price at the beginning of this week.
TCK announced a 2-for-1 stock split on Wednesday. When this stock split
takes effect in early May, the options exchanges will make adjustments
to all existing contracts such that option holders are neither
advantaged nor disadvantaged by the split. To be specific, exercise
prices will be cut in half and the number of options per contract will
double. For example, if you purchase a single TCKHO contract prior to
the split then you will own options covering 100 shares with a strike
price of US$75. Post-split you will own options covering 200 shares
with a strike price of $37.50.
 Thunder Energy (TSX: THY.UN). Recent price: C$4.07 Thunder Energy (TSX: THY.UN). Recent price: C$4.07
THY.UN is one of the seven 'gassy' trusts included in our energy trust index (TETI).
THY's management has announced that an agreement has been reached to
sell the trust for C$4.00 per unit. This looks like a bad deal for
unit-holders in that it involves no premium to the current market price
and a 20% discount to net asset value. It looks, to us, like THY's
management is selling-out at the bottom.
If the deal is approved by THY's unit-holders at a meeting scheduled to
be held on 22nd June then we will have no alternative other than to
remove THY from our index. If this happens we will add a replacement as
we do not want the index to contain less than seven trusts, but at this
stage we don't know what the replacement will be.
In the mean time there's probably no point selling THY. The $4/unit
cash bid puts a solid floor under the market price and there's a chance
that a competing offer will emerge or that unit-holders will not
approve the transaction. Also, the trust will continue to make its
C$0.09/month distribution over the next two months.
 Mitsubishi UFJ Financial Group (NYSE: MTU) Mitsubishi UFJ Financial Group (NYSE: MTU)
MTU backed into our 'stop' on Monday and will be removed from the TSI
Stocks List. Based on Monday's closing price of US$10.89, our loss on
the trade was 13.6%.
MTU has the potential to be a big winner as Japan's economy strengthens
so we will look for an opportunity to return it to the List. In the
mean time we'll retain lower-risk exposure to the Japanese stock market
via EWJ and JEQ.
Chart Sources
Charts appearing in today's commentary
are courtesy of:
http://stockcharts.com/index.html
http://www.futuresource.com/
http://www.economagic.com/
http://www.fullermoney.com/

|

