|
- Interim Update 25th June 2003
The Fed's
Mission
We received an e-mail from someone
the other day who asked if we thought the Fed should be abolished because
it hasn't achieved its mission. Our response was that the Fed should be
abolished, but not because it hasn't achieved its mission. In fact, we
think the Fed has been remarkably successful if success is determined by
its ability to achieve its mission. This is because the Fed's mission (its
'reason for being') is to inflate whilst keeping inflation expectations
low. Apart from a couple of relatively brief periods over the past 90 years,
this is exactly what it has been able to do.
The Fed inflates by helping to ensure
that the environment remains conducive to credit expansion. This is the
easy part. The hard part is to do this without most people realising that
continuous inflation is the overriding goal of monetary policy. In recent
years the threat of deflation had to be conjured up in order to keep the
public's eye 'off the ball'.
A good example of how the Fed manages
(minimises) inflation expectations was provided by yesterday's monetary
policy announcement. Here is an extract from the announcement with the
critical phrases underlined:
"The Committee continues to believe
that an accommodative stance of monetary policy, coupled with still robust
underlying growth in productivity, is providing important ongoing support
to economic activity. Recent signs point to a firming in spending, markedly
improved financial conditions, and labor and product markets that are stabilizing.
The economy, nonetheless, has yet to exhibit sustainable growth. With
inflationary expectations subdued, the Committee judged that a slightly
more expansive monetary policy would add further support for an economy
which it expects to improve over time.
The Committee perceives that the
upside and downside risks to the attainment of sustainable growth for the
next few quarters are roughly equal. In contrast, the probability, though
minor, of an unwelcome substantial fall in inflation exceeds that of a
pickup in inflation from its already low level. On balance, the Committee
believes that the latter concern is likely to predominate for the foreseeable
future."
This week's events have proven that
the Fed is still able to cut short-term interest rates without getting
chastised for being 'too easy', even though:
a) M2 money supply has grown by more
than 8% over the past year
b) Real interest rates have been negative
for a considerable time
c) The Dollar Index is down by 23%
from its peak
d) The trade deficit hits a new all-time
high almost every month
e) The oil price is over $30/barrel
f) The gold price and the CRB Index
are up by 40% and 30%, respectively, from their lows
This is testament to the Fed's great
success in the field of 'expectations management'.
The US
Stock Market
Current Market Situation
As discussed in the past, some of the
things we are watching to determine whether the current pullback in the
stock market is the first part of another major decline, or just a correction
within a continuing uptrend, are:
a) The performance of the NASDAQ100/Dow
ratio (persistent weakness in the NASDAQ100 Index relative to the Dow Industrials
Index would suggest that another major decline had begun)
b) The performance of the Walmart (WMT)
stock price. WMT has been a leading indicator for the overall market during
the past 12 months, for good reason given the out-sized importance of consumer
spending to the US economy. It was bearish that the new high achieved by
the S&P500 Index earlier this month was not confirmed by a new recovery
high in the WMT stock price (WMT peaked in April). If WMT now closes below
support at $51.50 it will have established a downtrend (by making a lower
high followed by a lower low). This, in turn, would suggest that an important
peak were already in place for the overall market.
c) The performance of the Semiconductor
Index (SOX). When market participants are becoming less risk averse the
SOX tends to do well and when they start becoming more concerned about
downside risk the absurdly over-priced semiconductor stocks tend to fall
out of favour. As such, strength or weakness in the SOX can forewarn of
a trend change in the overall market.
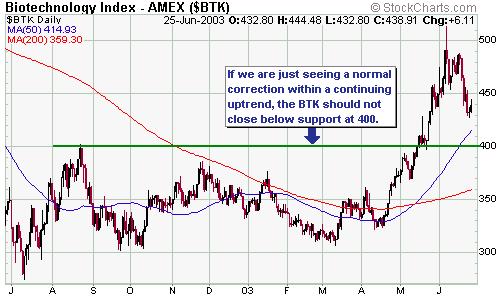
Something we haven't mentioned in the
past, but which is also likely to provide a timely clue regarding what
to expect for the overall stock market, is the performance of the biotech
stocks. The biotech sector, as represented by the Biotechnology Index (BTK),
has been one of the leading lights of the market since last July.
Below is a 1-year chart of the BTK.
The BTK spiked up to a peak in early June and then reversed sharply lower.
If this is just a correction, rather than the start of a major decline,
then the BTK should not close below 400.
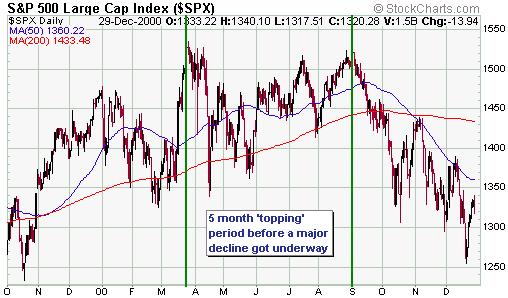
Sentiment has recently become as bullish
as it was during the first quarter of 2000 (refer to the chart of the TSI
Index of Bullish Sentiment shown below). As such, even if an important
top is already in place (at this stage we don't know whether it is or isn't)
it is not realistic to expect a total capitulation of the bulls in the
near future. This is because market participants are now so complacent
that significant pullbacks probably will, for a while, be seen as buying
opportunities. A more likely outcome would be a topping process that lasts
at least a few months. For example, the S&P500 peaked in March of 2000
but was still near its highs 5 months later (see chart below). It wasn't
until it began to drop after making a lower high in September of 2000 that
the selling pressure really started to build.

We expect the market to continue its
decline over the next month or so, although some 'artificial' strength
is likely over the next 6 trading days due to end-of-quarter buying by
fund managers and the 4th July holiday in the US.
Gold and
the Dollar
Junior Gold Stock Comparison
In the 16th June Weekly Update we included
a valuation comparison of 16 mid and large size gold producers. Now it's
time to look at how some of the junior explorers and producers stack up
against each other.
In the below tables EV stands for "enterprise
value" and TEV stands for "theoretical enterprise value". The enterprise
value (EV) for each company is calculated by adding the company's net debt
to its stock market capitalisation, where net debt is total debt minus
cash minus the marked-to-market value of any gold hedges. In other words,
EV represents the current total market value of each company. TEV, on the
other hand, is what each company's gold reserves are theoretically worth
at a particular gold price. It is calculated by multiplying a company's
net profit margin per ounce of gold (the assumed gold price minus the total
cost to produce an ounce of gold) by that company's total proven and probable
reserves. In the tables we've noted each company's TEV at $350, $425 and
$500, and also the percentage change that would be needed to bring the
current market price into line with the calculated TEV. In other words,
the percentages shown in the final three columns reflect the gain that
the market would bestow on each stock at various gold prices if the valuation
criteria we have used in compiling this table were the market's only consideration.
The definitions of EV and TEV in the
above paragraph were taken from our previous valuation comparison of large
and mid size gold producers. (Note, though, that none of the junior companies
we reviewed have significant gold hedges in place, so the marked-to-market
value of gold hedges did not need to be considered.) These definitions
can readily be applied to junior gold producers, but we had to make some
modifications when attempting to measure the relative values of companies
that were still in the exploration stage. This was necessary for two reasons.
First, it is a straightforward matter to calculate the total cost of production
for a company that is already producing gold, but we needed to find a way
to estimate the total cost of production for companies that might be years
away from production. Second, we needed to find a way to account for the
advantage of already having an operational mine in place. In other words,
in comparing the value of a company in the exploration stage with a company
that is already producing gold, we needed to find a way to account for
the additional investment in mine development and infra-structure that
has already been made by the producer.
In order to create something resembling
a level playing field we added the expected mine development cost to the
current enterprise value of the exploration-stage companies. Fortunately,
most of the companies on our list have provided estimates of future mine
development costs. For example, Red Back Mining has estimated a cost of
US$40-$50M to build a 100,000 oz/year mine at its Chirano gold project
in Ghana, so we added US$50M to Red Back's enterprise value. In other words,
the estimated capital expenditures to get to the point where reserves can
be extracted from the ground have been accounted for as if they were a
debt.
In order to determine the cost of producing
an ounce of gold for companies that aren't yet in the production stage,
we were also generally able to rely on estimates provided by the companies.
For example, Cumberland Resources has estimated that its Meadowbank project
will produce 250,000 ounces/year at a cash cost of US$168. To get the estimated
future total cost for each exploration-stage company we added US$60 to
the expected cash cost simply because US$60 was the average difference
between cash cost and total cost for similar companies that are already
in the production stage.
In the first of the following tables
the companies are shown in order of value, from best value at the top to
worst value at the bottom, assuming a gold price of $350. In the second
table the companies are once again shown in order of value, but this time
assuming a gold price of $500. Note that "Adj. Resv." in the tables stands
for "adjusted reserves" and is calculated, for each company, by adding
50% of the company's "measured and indicated resource" to its "proven and
probable reserve".
| Company
Name |
Symbol |
Recent
Price (US$) |
Ent.
Value (US$M) |
2003
Prodn. (Koz) |
Total
Cost per ounce |
Adj.
Resv. (Moz) |
EV
$ per oz Res. |
TEV
at $350 |
TEV
at $425 |
TEV
at $500 |
Gain
at $350 |
Gain
at $425 |
Gain
at $500 |
| Bendigo
Gold |
BDG |
0.13 |
265 |
0 |
200 |
6.0 |
44 |
900 |
1350 |
1800 |
239% |
409% |
579% |
| Desert
Sun Mining |
DSM |
0.66 |
44 |
0 |
240 |
1.2 |
38 |
128 |
215 |
302 |
192% |
390% |
589% |
| Redback
Mining |
RBK |
0.27 |
82 |
0 |
240 |
1.6 |
53 |
172 |
289 |
406 |
109% |
251% |
394% |
| Western
Silver |
WTZ |
2.25 |
138 |
0 |
260 |
2.7 |
51 |
243 |
446 |
648 |
76% |
223% |
370% |
| American
Bonanza |
BZA |
0.22 |
59 |
0 |
210 |
0.6 |
98 |
84 |
129 |
174 |
42% |
118% |
195% |
| Cumberland
Resources |
CBD |
2.10 |
173 |
0 |
228 |
2.0 |
87 |
244 |
394 |
544 |
41% |
127% |
214% |
| Eldorado
Gold |
EGO |
1.65 |
382 |
105 |
276 |
7.1 |
54 |
520 |
1049 |
1578 |
36% |
175% |
313% |
| Novagold |
NRI |
2.20 |
199 |
0 |
250 |
2.5 |
80 |
250 |
438 |
625 |
26% |
120% |
214% |
| Golden
Phoenix |
GPXM |
0.32 |
51 |
0 |
300 |
1.3 |
40 |
64 |
160 |
256 |
25% |
212% |
400% |
| Golden
Star Resources |
GSS |
2.60 |
231 |
140 |
243 |
2.7 |
87 |
284 |
483 |
681 |
23% |
109% |
195% |
| Metallic
Ventures |
MVG |
2.90 |
118 |
0 |
260 |
1.6 |
74 |
144 |
264 |
384 |
22% |
124% |
225% |
| Apollo
Gold |
APG |
2.00 |
127 |
100 |
300 |
2.6 |
49 |
129 |
322 |
515 |
1% |
153% |
306% |
| Orvana
Minerals |
ORV |
0.86 |
115 |
60 |
160 |
0.6 |
205 |
106 |
148 |
190 |
-7% |
29% |
66% |
| Richmont
Mines |
RIC |
2.94 |
19 |
80 |
335 |
0.5 |
36 |
8 |
48 |
88 |
-58% |
153% |
364% |
| Bema
Gold |
BGO |
1.24 |
428 |
200 |
333 |
9.6 |
45 |
168 |
888 |
1608 |
-61% |
107% |
276% |
| Company
Name |
Symbol |
Recent
Price (US$) |
Ent.
Value (US$M) |
2003
Prodn. (Koz) |
Total
Cost per ounce |
Adj.
Resv. (Moz) |
EV
$ per oz Res. |
TEV
at $350 |
TEV
at $425 |
TEV
at $500 |
Gain
at $350 |
Gain
at $425 |
Gain
at $500 |
| Desert
Sun Mining |
DSM |
0.66 |
44 |
0 |
240 |
1.2 |
38 |
128 |
215 |
302 |
192% |
390% |
589% |
| Bendigo
Gold |
BDG |
0.13 |
265 |
0 |
200 |
6.0 |
44 |
900 |
1350 |
1800 |
239% |
409% |
579% |
| Golden
Phoenix |
GPXM |
0.32 |
51 |
0 |
300 |
1.3 |
40 |
64 |
160 |
256 |
25% |
212% |
400% |
| Redback
Mining |
RBK |
0.27 |
82 |
0 |
240 |
1.6 |
53 |
172 |
289 |
406 |
109% |
251% |
394% |
| Western
Silver |
WTZ |
2.25 |
138 |
0 |
260 |
2.7 |
51 |
243 |
446 |
648 |
76% |
223% |
370% |
| Richmont
Mines |
RIC |
2.94 |
19 |
80 |
335 |
0.5 |
36 |
8 |
48 |
88 |
-58% |
153% |
364% |
| Eldorado
Gold |
EGO |
1.65 |
382 |
105 |
276 |
7.1 |
54 |
520 |
1049 |
1578 |
36% |
175% |
313% |
| Apollo
Gold |
APG |
2.00 |
127 |
100 |
300 |
2.6 |
49 |
129 |
322 |
515 |
1% |
153% |
306% |
| Bema
Gold |
BGO |
1.24 |
428 |
200 |
333 |
9.6 |
45 |
168 |
888 |
1608 |
-61% |
107% |
276% |
| Metallic
Ventures |
MVG |
2.90 |
118 |
0 |
260 |
1.6 |
74 |
144 |
264 |
384 |
22% |
124% |
225% |
| Cumberland
Resources |
CBD |
2.10 |
173 |
0 |
228 |
2.0 |
87 |
244 |
394 |
544 |
41% |
127% |
214% |
| Novagold |
NRI |
2.20 |
199 |
0 |
250 |
2.5 |
80 |
250 |
438 |
625 |
26% |
120% |
214% |
| Golden
Star Resources |
GSS |
2.60 |
231 |
140 |
243 |
2.7 |
87 |
284 |
483 |
681 |
23% |
109% |
195% |
| American
Bonanza |
BZA |
0.22 |
59 |
0 |
210 |
0.6 |
98 |
84 |
129 |
174 |
42% |
118% |
195% |
| Orvana
Minerals |
ORV |
0.86 |
115 |
60 |
160 |
0.6 |
205 |
106 |
148 |
190 |
-7% |
29% |
66% |
Notes and conclusions:
1. If you compare the above tables
with the valuation tables for the large and mid size gold stocks included
in the 16th June Weekly Update you'll notice that the junior gold stocks,
in general, offer better value than the larger stocks at the current gold
price and offer much more leverage to the gold price. As such, the above
tables quantify our reasons for putting a lot more emphasis on the junior
gold stocks than on the senior gold stocks over the past 10 months.
2. Bendigo Gold (ASX: BDG) scored very
well in terms of both current value and leverage. However, this stock is
unloved by the market, probably because 'the Bendigo story' is difficult
to understand and requires long-term vision. Due to the nuggety nature
of the huge Bendigo resource, sufficient drilling to 'prove up' a large
reserve is counter-productive and will therefore never be carried out.
As such, BDG's plan is that it will only ever 'prove up' enough reserves
to cover the next 2 years of production. This will mean initially proving
up a reserve of 200,000 ounces and never proving up a reserve of
more than 1M ounces, making BDG difficult to value using traditional methods.
Over the past decade BDG has, though, done enough work to be confident
that its project contains a resource of at least 12M ounces. Furthermore,
BDG's own assessment of the project's potential is lent weight by Harmony
Gold's involvement and sizeable investment in the company.
By the way, Charters Towers Gold (ASX:
CTO) would have shown even greater value and upside potential than BDG
if it had been included in our comparison because CTO's mineable gold resource
is just as big as BDG's but its market cap is much lower. CTO's gold deposit
is similar, in many respects, to the Bendigo deposit. Like BDG, CTO owns
a massive gold resource but will never have a large proven reserve due
to the nuggety structure of the deposit.
3. Desert Sun Mining (TSXV: DSM) and
Red Back Mining (ASX: RBK) also scored well in terms of both current value
and gold price leverage.
DSM is an exploration-stage company
that has the advantage of having mining plant and infrastructure already
in place (we've assumed that DSM will need to spend about US$20M to bring
the existing plant back into operation). The next milestone for DSM is
completion of a feasibility study, scheduled for mid August.
RBK has completed a feasibility study
and is expected to have a mining license, enabling it to commence construction
of a 130K oz/year mine, by the end of this year. We think RBK will be bought
by a larger and financially stronger company (most likely Golden Star Resources)
prior to commencing mine development.
4. Western Silver (AMEX: WTZ) has been
included in the table even though it is, as its name suggests, primarily
a silver company. However, for the purpose of this comparison we've converted
WTZ's resources to 'gold equivalent' ounces. WTZ measures up well against
most of the gold stocks.
5. Cumberland Resources and Metallic
Ventures were in the middle of the pack in terms of current value and leverage.
However, the table doesn't factor in risk. If it did then these two stocks
would have moved up a notch or two.
6. Eldorado Gold is an interesting
company, although most of its value is associated with the Kisladag project
in Turkey. Political risk therefore needs to be taken into account.
7. Bema Gold (AMEX: BGO) was a junior
producer last year, but due to an acquisition earlier this year it will
soon move up a weight division (based on BGO's forecast that it will produce
around 300,000 ounces over the next 12 months it is now a mid-size producer).
BGO is a stock that tends to be a speculative favourite whenever the gold
price rallies, but it is not one that we would buy. For starters, about
two-thirds of its production over the coming 12 months will come from South
Africa. Also, we have doubts about the ability of the BGO management to
effectively manage such a geographically diverse bunch of assets (its 3
main projects are in South Africa, Russia and Chile).
8. There is a lot to like about Golden
Star Resources (AMEX: GSS), but the recent run-up in the price of this
stock has pushed it lower on our list of potential buys. It appears to
be a well-run company and will almost certainly make its way into the mid-size
class over the next 12-18 months.
9. Both American Bonanza (TSXV: BZA)
and Orvana Minerals (TSX: ORV) have low reserves and low (estimated) production
costs. This means they would be able to earn a profit at a low gold price,
but also means they don't offer as much leverage as the other stocks in
the table. However, we expect that additional success on the exploration
front over the remainder of this year will improve the relative attractiveness
of BZA.
10. The one stock in the above table
that currently isn't in the TSI Stocks List and which we would add to the
List if we weren't already over-loaded with gold stocks, is Novagold (TSX:
NRI). NRI doesn't stand out in the above table, but that is mainly because
the current 'measured and indicated' resource for the Donlin Creek project
dramatically understates the eventual size of the deposit (NRI's major
asset is its 30% stake in the Donlin Creek project). Furthermore, it is
very likely that the team that turned Donlin Creek from something of apparently
little value into one of the world's best gold deposits is going to have
great success with at least one of their other projects.
Gold and the Dollar
In the latest Weekly Update we explained
why the Fed would probably cut interest rates by 0.25% this week rather
than 0.50%. Taking into account the effect that a 0.50% cut would have
on the bond, currency and gold markets (a 0.50% cut would risk causing
bond prices to tank and the prices of gold stocks to move sharply higher),
a 0.25% cut made the most sense. Bond prices were already in a short-term
downtrend and will probably work their way lower over the coming 1-2 months,
but a 0.50% cut would have potentially turned what might be a normal correction
into a rout.
In the latest Weekly Update we included
a short-term chart of the Dollar Index to show that it was very close to
an upside breakout. The Dollar Index did manage to breakout on Monday and
will now probably work its way up to at least 97, helped along by the fact
that the Fed has just shown some restraint. An indication of how far the
US$ is going to rebound before resuming its bear trend will be provided
by the Commitments of Traders (COT) data. If the commercial traders are
as quick to cover their long positions in the US$ this time around as they
were in March, then the rally probably won't take the US$ more than a few
percent above its current level.
Below is a weekly chart of the Swiss
Franc. Support in the 70-72 range is a reasonable downside target for the
SF over the next 2 months.
Below is a daily chart of August gold
futures. The gold price has been in a short-term downtrend for the past
month, thus signaling the potential for a US$ rebound. Over the past 2
weeks we've mentioned that support in the $340-$345 range would be a likely
place for gold to reach a short-term bottom, and that remains the case.
We will continue to use the position of the gold price relative to its
18-day moving average to determine whether or not the short-term downtrend
is still in effect (we will consider two consecutive daily closes above
the 18-day MA to be evidence that gold's short-term trend had turned up).

Although we think it helps to understand
what is happening with the shorter-term trends in the markets, we are not
short-term traders and TSI is not designed to be a short-term trading service.
We will sometimes recommend short-term trades, but our main goal is to
position ourselves to take advantage of the longer-term trends (trends
lasting 12 months or longer). Once we've identified the longer-term trends
in the markets we then scale-in during periods of weakness and scale-out
during periods of strength.
Two of the most important long-term
trends at this time are the downward trend in the US$ and the (consequential)
upward trend in the gold price. Gold was in a downtrend for much of the
past 20 years, but about 4 years ago (around the time that the British
Government made the brilliant decision to sell most of the country's gold
reserves) the trend began to turn higher. A reversal of a long-term downtrend
is a process, rather than an event, and is generally not signaled by things
such as lines on charts. For example, a long-term downtrend-line on the
gold price chart was broken near the end of last year (see chart below),
but the obvious breakout was soon followed by an important peak. This doesn't
mean that gold's break above the downtrend-line was not significant, but
it does mean that those who waited for obvious technical confirmation before
buying were not rewarded. In fact, as a general rule the market rewards
those who correctly anticipate, not those who react in knee-jerk fashion
to price movements.
In the coming Weekly Update we'll review
some of the things that help us determine the long-term trend for gold.
Silver
From the 16th June Weekly Update: "...we
think the next move [in the silver price] to 4.80-4.90 will result in an
upside breakout and that silver will surprise most traders (most traders
will assume that 4.80-4.90 is going to hold) by not only moving above 4.90
but also moving well above 5.20." First, however, silver has to make
it to $4.90.
If support at $4.35 holds during any
pullbacks over the next couple of months the silver chart will retain its
bullish implications. However, a weekly close below $4.35 would suggest
that the silver price was headed below $4.00. Given the current monetary
environment we expect silver to hold above $4.35.
At the moment the silver price is in
no-man's land, half way between support and resistance.
Gold Stocks
Until this week the two scenarios we've
described for gold stocks appeared to be almost equally likely. The situation
across all the financial markets has favoured Scenario B (a substantial
pullback followed by a 1-2 year uptrend) for some time, but the price action
in some of the major gold stocks (especially Newmont Mining) has pointed
towards Scenario A (a sharp near-term rally to a major peak followed by
a 1-2 year bear market). However, this week's price action and the decision
by the Fed to cut rates by only 0.25% mean that Scenario B is now far more
likely than Scenario A. In other words the more bullish scenario for gold
stocks, as far as the coming 12-month period is concerned, appears to be
playing out. If this is, in fact, the correct interpretation then most
of our junior gold stocks will be trading hundreds of percent above their
current levels at some point next year, although they will probably trade
below their current levels at some point over the next few months.
Below is a chart of the Amex Gold BUGS
Index (HUI) covering the past 15 months. The HUI looked like it was about
to breakout to the upside last week, but then reversed lower and created
what now looks like a 'triple top'. All that has actually happened is that
the HUI has moved back into the consolidation pattern that has contained
it for the past 13 months. An upside breakout from this pattern has a very
high probability of occurring sometime this year, but as discussed above
a sizeable pullback is likely to happen first. Sentiment does not appear
to be very bullish (meaning there probably aren't a lot of weak hands waiting
to be 'shaken out' of the market), so the maximum downside risk is probably
limited to a drop to the uptrend-line shown on the below chart.

Update
on Stock Selections
 The
sharp drop in the Cardero Resource (CDU) stock price in response to the
poor drilling results announced last week underlines a point we've made
in the past with regard to junior gold/silver stocks. That point is that
risk needs to be spread over several stocks. We think the risk of owning
a portfolio of, say, 7-10 junior gold/silver stocks (mostly gold because
silver is not yet in a bull market) is low relative to the enormous potential
profits, but the risk in any one situation is generally quite high. As
such, we think it only makes sense to own the juniors if you own at least
7 (10 would be better). In this way a mistake with any individual stock
pick won't have an unduly large effect on your portfolio (mistakes cannot
be avoided altogether, but their effects can be mitigated by good risk
management). The
sharp drop in the Cardero Resource (CDU) stock price in response to the
poor drilling results announced last week underlines a point we've made
in the past with regard to junior gold/silver stocks. That point is that
risk needs to be spread over several stocks. We think the risk of owning
a portfolio of, say, 7-10 junior gold/silver stocks (mostly gold because
silver is not yet in a bull market) is low relative to the enormous potential
profits, but the risk in any one situation is generally quite high. As
such, we think it only makes sense to own the juniors if you own at least
7 (10 would be better). In this way a mistake with any individual stock
pick won't have an unduly large effect on your portfolio (mistakes cannot
be avoided altogether, but their effects can be mitigated by good risk
management).
The above doesn't mean that someone
who doesn't own any junior gold stocks should rush out now and buy at least
seven. Good risk management practice also involves building a portfolio
over time, not committing all your cash at one time.
With regard to CDU, the discussion
contained in the latest Weekly Update still applies. The market has taken
the CDU price down to the point where zero value is being attributed to
the La Providencia silver deposit, so any surprises from here should be
on the upside. However, as advised in last week's Interim Update and again
in the latest Weekly Update, we don't think it is appropriate to buy CDU
at its current depressed level. Any new buying should be focused on companies
that have already had sufficient exploration success to more than back-up
their current stock prices. In the realm of silver exploration companies,
we continue to like Western Silver (TSX: WTC, AMEX: WTZ).
Lucent
(NYSE: LU) closed below our sell stop ($1.95) on Monday and will therefore
be removed from the Stocks List. The loss on the trade was 8%.
Chart Sources
Charts appearing in today's commentary
are courtesy of:
http://stockcharts.com/index.html
http://www.futuresource.com/

|
