|
- Interim Update 25th July 2007
Copyright
Reminder
The commentaries that appear at TSI
may not be distributed, in full or in part, without our written permission.
In particular, please note that the posting of extracts from TSI commentaries
at other web sites or providing links to TSI commentaries at other web
sites (for example, at discussion boards) without our written permission
is prohibited.
We reserve the right to immediately
terminate the subscription of any TSI subscriber who distributes the TSI
commentaries without our written permission.
The Long-Term Bond Bear
The Main Fundamental Argument
...the
weaker the economy becomes in the short-term the more inflation there
will be in the long-term. ...there is very little future currency
depreciation factored into current bond yields.
Our short- and intermediate-term bond market views have recently become
more optimistic because a number of factors should lend support to bond
prices over the remainder of this year. In particular, the
mortgage-related debt crisis in the US will probably get worse before
it gets better, leading to additional demand for zero-risk Treasury
debt at the expense of lower-quality/higher-risk debt. Also,
significant stock- and commodity-market corrections are likely to occur
over the next few months, thus putting additional upward pressure on
Treasury bond prices (downward pressure on yields) due to a flight to
safety. However, we remain as confident as ever that bonds are in the
early stages of a secular bear market.
Bond bulls routinely cite weakening US economic growth to support their
case, but such arguments are only valid on a short-term basis and only
then to the extent that weakening growth gives bond-related sentiment a
boost. As discussed in last week's Interim Update and in other TSI
commentaries over the years, the idea that weaker economic growth will
lead to less inflationary pressure (less upward pressure on prices)
within the economy is illogical because less output, or slower output
growth, will result in more money chasing fewer 'things' than would be
the case if real growth were stronger. Putting it another way, the
fatal flaw in the "slower growth leads to reduced inflationary
pressure" argument is that inflationary pressure and real growth are
INVERSELY correlated.
But what if weaker economic growth caused the supply of money to fall
relative to the demand for money due to an economy-wide scramble to
de-leverage? Couldn't this more than offset the increased inflationary
pressure resulting from a fall in real output?
That's a possibility, but it's very unlikely. It's unlikely because
counter-cyclical monetary and fiscal policies would by implemented to
combat the tighter monetary backdrop. Private entities can only handle
so much debt before the repayment burden becomes too great, but there
is no limit to how much of its own currency a government can borrow
into existence because the central bank stands ready and able to
monetise every dollar of new government debt (to quote Alan Greenspan: "...a government cannot become insolvent with respect to obligations in its own currency"). Furthermore, if it chose to do so the central bank could monetise private debt and assets in addition to government debt.
Due to the way governments and their central banks invariably react to
economic downturns, combined with the virtually unlimited powers they
have to create new money under the current monetary system, the weaker
the economy becomes in the short-term the more inflation there will be
in the long-term. For example, if the US economy were to slide into an
OFFICIAL recession during the second half of this year then our
long-term bearish outlook on bonds would be bolstered because the
weaker the US economy becomes this year the more inflation there will
be during 2008-2009. Note that we've capitalised "official" in the
preceding sentence because the US economy is probably already in
recession; it's just that the bogus numbers used to calculate real GDP
enable the reporting of a small amount of real growth each quarter.
Although there are no rigid limits on the amount of new money that
could be created by the government in concert with the central bank, it
could be argued that the bond market effectively imposes limits on the
amount of inflation; that is, it could be argued that when bond yields
begin to rocket upward in response to the effects of inflation the
abilities of the government and its agencies to inflate further will be
curtailed. We agree, but the point is that this will only become a
factor AFTER the bond market has plunged to much lower levels; it will
not be a factor while long-term interest rates remain in single digits.
Now, it should be noted that inflation (money supply growth) is not
always a problem for the bond market. For example, there was inflation
during the 80s and 90s -- albeit nowhere near as much as there has been
during the current decade -- but this did not prevent bonds from
experiencing a long-term bull market.
There are, however, important differences between the current decade
and the preceding two decades, including the fact that bonds began the
1980s and the 1990s at under-valued levels (bond yields were
discounting a lot of currency depreciation at those times), whereas
there is very little future currency depreciation factored into current
bond yields. In other words, bonds were cheap then and are expensive
now. We've covered the reasons for today's over-valuation many times in
the past, but the main ones are the fast rate of productivity growth in
the developing world, the large demand for bonds stemming from
price-insensitive buyers (central banks), Japan (as discussed below),
and the preparedness of many investors to ignore the evidence of their
own eyes and believe the absurd government price indices. These are
all, we think, transitory factors that will only postpone the
inevitable.
Another important difference between the current cycle and the
bull-market bond cycle of the 80s and 90s is that the commodity sector
has been, and should continue to be, one of the greatest beneficiaries
of this cycle's inflation. This relates to valuation and scarcity in
that real commodity prices began the current cycle near Great
Depression lows and two decades of dismal real returns (1980-2000) led
to the situation where there was a general inability to increase supply
to cater for even a modest increase in demand.
In a nutshell, we are long-term bearish on bonds at this time because
current bond yields do not come close to reflecting the amount of
currency depreciation that's likely to occur over the next several
years and because the sectors of the economy that usually trend
inversely to bond prices should continue to be the main beneficiaries
of this cycle's currency depreciation. At some future time, however,
the opposite may well be the case due to bond prices having already
tanked.
The Japan Effect
...Japanese monetary policy has been causing a lot of inflation outside Japan and almost no inflation inside Japan...
If the definition of insanity is doing the same thing over and over
again and expecting a different result then Japanese monetary
authorities are insane. They've continued to hold the official interest
rate near zero in an effort to inflate Japan's economy out of its funk
despite years of evidence that this policy is not achieving its
intended effect. Attempting to inflate-away the knock-on effects of an
inflation-fueled investment boom-gone-bust is a bad idea at the best of
times, but in Japan's case the ill-conceived plan to get out of trouble
via inflation is creating inflation almost everywhere except Japan.
The thing is, there has been such a huge difference between interest
rates in Japan and interest rates elsewhere that it has been immensely
profitable for large speculators to use borrowed Yen to finance
purchases of stocks and bonds denominated in higher-yielding currencies
(the Yen carry trade). The miniscule interest rates available in Japan
have also created a huge incentive for Japan's aging and yield-hungry
population to send their savings overseas in search of interest income.
As a result, almost all of the inflationary effects of the Bank of
Japan's ultra-easy monetary policy have occurred OUTSIDE Japan.
That Japanese monetary policy has been causing a lot of inflation
outside Japan and almost no inflation inside Japan has been blatantly
obvious for years, and yet Japanese monetary authorities continue to
tenaciously hold their interest rates near zero in an effort to bring
about more inflation within Japan's economy. Like we said: insane.
We aren't holding our breath while we wait for Japan's monetary policy
to be normalised, but the Yen carry trade will eventually come to an
end due to either the narrowing of the gap between Japanese and
US/European interest rates or the Yen embarking on a bull market (the
Yen only has to rise by about 5% per year to make the Yen carry trade
unprofitable). Our guess is that it will be the latter. Just like the
gold carry trade before it, we expect the Yen carry trade to quickly
lose its appeal once the Yen enters a bull market.
The reason we are talking about Japanese monetary policy and the Yen
carry trade as part of our bond market discussion is that these things
have had a significant positive influence on bond prices. Specifically,
the flood of money out of Japan stemming from the Japanese public's
search for yield and the bond-buying undertaken by hedge funds using
the proceeds of Yen carry trades have underpinned bond prices
throughout the world over the past few years. This support will,
however, disappear once the interest rate gap narrows or the Yen
establishes an upward trend. Actually, the initial effect of a
strengthening Yen will probably be upward pressure on low-risk
government debt such as US T-Bonds due to the downward pressure on
commodity and equity prices caused by the unwinding of the Yen carry
trade; but over the longer-term a strengthening Yen should bring about
a reduction in the demand for bonds.
Evidence in the Charts
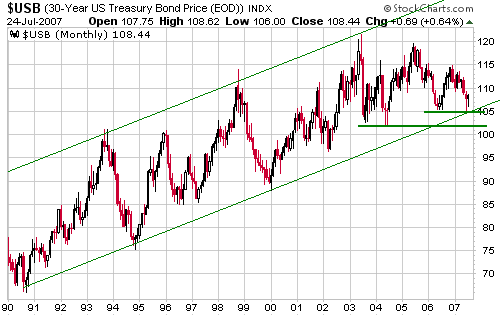
The following monthly chart of US T-Bond futures doesn't give us much
to go on because the action since the June-2003 peak could reasonably
be interpreted as a correction within a continuing secular bull market
or the initial phase of a new secular bear market. Confirmation of our
bearish long-term outlook requires a break below the May-2004 low, but
even if our analysis is on the mark a breakdown of this nature might
not occur until 2008.
Evidence in support
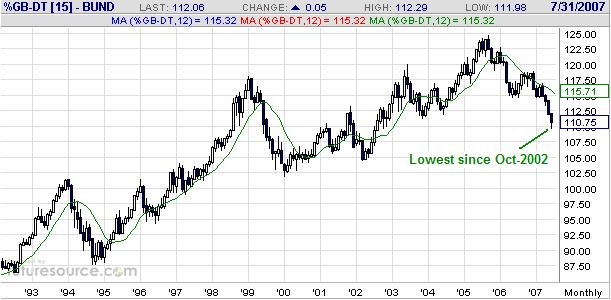
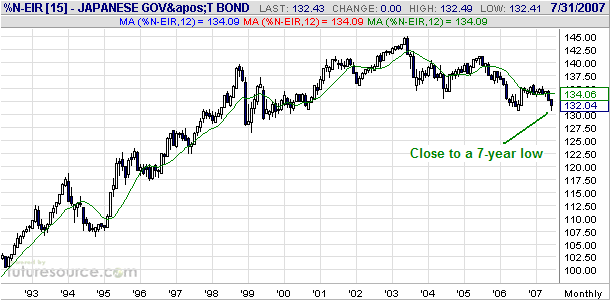
of the secular bear market hypothesis can, however, be found in the
long-term monthly charts of German Bund futures and Japanese Government
Bond (JGB) futures included below. Note, in particular, that Bund
futures recently traded at their lowest levels in more than 4.5 years
and JGB futures came close to making new 7-year lows earlier this
month. We are not aware of a secular bull market ever making 4, 5, 6,
or 7 year lows, so the price action suggests that Bund and JGB futures
are in long-term bearish trends. And if this is the case then the US
T-Bond market is almost certainly immersed in a long-term bearish trend
because the bond bear appears to be global in nature.
The Stock Market
Current Market Situation
We
said, above, that the US economy is probably already in recession. But
if this is true then why is the US stock market still near its highs?
We think the rapid growth outside the US and the weakness in the US$
are at least partially responsible for the stock market's strength in
the face of a very sluggish domestic economy. Many large-cap US stocks
do a lot of business outside the US or sell commodities that are priced
internationally, so as long as global growth is strong and commodity
prices are high they are able to achieve good profit growth despite the
poor performance of the local economy. These companies also benefit
from US$ weakness because profits earned outside the US get converted
to US dollars for financial reporting purposes.
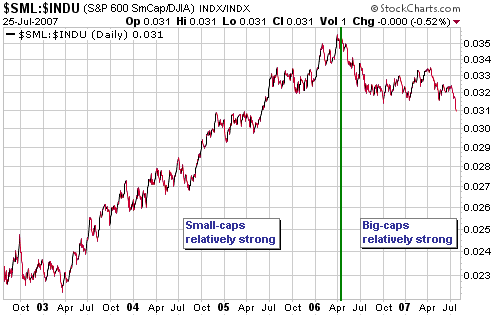
Since the average large-cap US company does more international business
(as a proportion of total business) than the average small-cap US
company, the downturn in the SML/Dow Ratio (the S&P600 Small-Cap
Index divided by the Dow Industrials Index) that began during the
second quarter of last year might be partly due to the relatively poor
performance of the US economy. The Dow is a proxy for large
multi-national corporations, and as evidenced by the following chart it
has handily out-performed the small-cap universe over the past year.
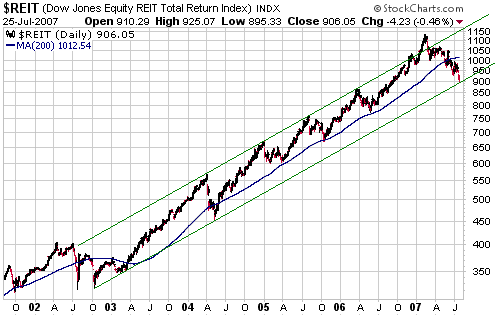
One of the most
consistent trends over the past several years has been the upward trend
in the Dow Jones Real Estate Investment Trust Index (REIT), but the
following chart shows that this trend is now getting a serious test. We
doubt that the long-term REIT bull market is over, but the correction
that began earlier this year has resulted in the only sustained break
below the 200-day moving average since 2002. This suggests to us that
the current correction is of larger degree than any of the other
corrections of the past four years and that the channel bottom will
probably be breached before the next bull market leg gets underway.
If the correction ends up retracing about 50% of the 2002-2007 rally
then the REIT Index will eventually drop to 700-750. This, we think, is
a reasonable expectation.
Gold and
the Dollar
Gold Stocks
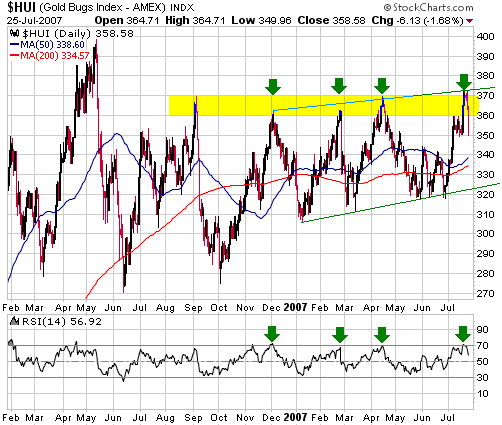
In December, February and April the HUI hit resistance at 360-370 at
the same time as its Relative Strength Index (RSI) was hitting 70
(refer to the following chart for details). In each case both the HUI
and the RSI reversed sharply lower; and in each case a bottom wasn't
reached until after the HUI had dropped to the trend-line drawn on our
chart and the RSI had dropped to the 30-40 range.
The HUI and its RSI have just reversed sharply lower for the fourth
time in the space of 9 months after hitting 360-370 and 70,
respectively. Therefore, if the above-described pattern is followed
again then the HUI will trade in the mid-320s within the coming few
weeks. But is it reasonable to expect that the same pattern will be
followed this time around?
We think not, primarily because the major gold stocks performed better
relative to gold bullion during their latest rally than they did during
the previous rallies that ended at 360-370. We therefore expect the
current pullback to end at a higher level.
As noted in the latest Weekly Market Update, a pullback of 5-8% was
likely in order to relieve the HUI's short-term overbought condition.
At Wednesday's low the HUI was down by about 5% from its recent high,
so in terms of price we suspect that at least two-thirds of the
pullback has already occurred. Another 1-3 weeks of time will probably
be required, though, before the gold sector will be positioned to
commence its next advance.
Those who want to avoid the hassle of having to select individual gold
stocks could consider averaging into GDX, an ETF that tracks the AMEX
Gold Miners Index, during pullbacks over the next couple of weeks.
Gold
There has been a lot of talk about gold rocketing upward once the
Dollar Index breaks decisively below long-term support at 80. While we
obviously can't rule out such a possibility, it's not the way these
things normally work in that gold normally LEADS the US$. In other
words, if the Dollar Index were really about to breakout to the
downside then gold should have already moved to new multi-year highs.
By the same token, the fact that gold is currently about 7% below last
year's high suggests that a US$ breakdown is not imminent.
In any case, it isn't necessary for the US$ to breakdown in order for
the gold price to move considerably higher because the US dollar's
exchange value is just one of many determinants of gold's price trend.
Further US$ weakness would be helpful, but the US$ is inherently no
worse than any of the other fiat currencies so weakness in the US$
relative to, say, the euro is not a prerequisite for a gold bull market.
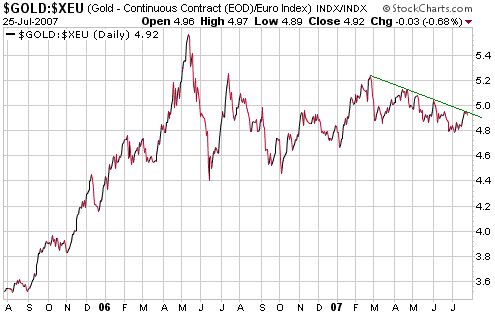
The following chart shows that gold has been sliding lower in euro
terms over the past 5 months. Ideally (from a 'gold bullish'
perspective), gold will hold-up better than the euro during a US$
rebound or rally against the US$ even as the US$ strengthens against
the euro over the next few weeks, leading to significant gains in the
euro-denominated gold price. We will certainly be more confident that
gold's intermediate-term prospects have turned positive if the euro
gold price can break its sequence of declining tops.
Gold is in a
long-term bull market against every fiat currency, but long-term bull
markets never travel in straight lines so there will be times when gold
under-performs. Furthermore, these periods of under-performance will
sometimes be lengthy, but large differences in inflation rates -- about
1.5% per year for gold versus more than 10% per year for most of the
fiat currencies -- all but guarantee that gold's rallies against each
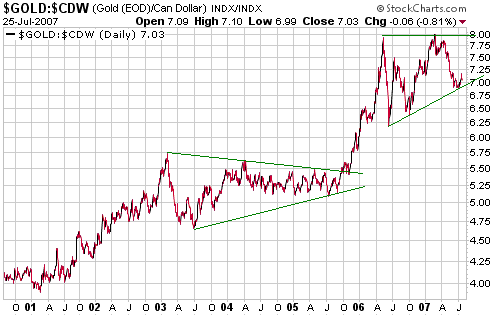
currency will be much greater than its declines. For example, the
following chart shows gold's long-term upward trend relative to the
Canadian Dollar. Notice that gold consolidated for about 2.5 years
beginning in early 2003 before rocketing upward. In May of 2006 it then
commenced another consolidation that continues to this day, but notice
that the current consolidation is occurring at a much higher level than
the preceding one. In all likelihood the C$ gold price will break above
$800 within the next 12 months and then rise well above $1000 before
commencing another consolidation.
Currency Market Update
The crisis in the world of mortgage-related debt and debt derivatives
will be bearish for the US$ to the extent that it pushes the Fed into
promoting easier monetary conditions. Keep in mind, though, that the
crisis is already a front-page story and is thus well known to market
participants. In other words, it is reasonable to assume that every
large trader of currencies has already assessed the likely
ramifications of the debt crisis on monetary policy and positioned
his/herself accordingly. The debt crisis will therefore have to get
worse than most traders currently expect if it is to continue exerting
downward pressure on the US$.
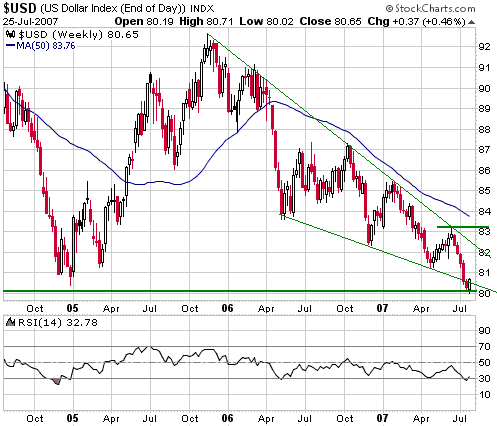
Below is a weekly chart showing that the Dollar Index has just bounced
a little after testing long-term support at 80. The dollar is very
oversold and will probably make some additional gains over the coming
fortnight, but it needs to break the sequence of declining tops -- by
closing above last month's high (just above 83) -- to confirm an upward
trend reversal.
In our opinion a US dollar collapse is very unlikely, but the Dollar
Index could continue to work its way lower for another 1-2 months
within the confines of the 'wedge' pattern drawn on our chart. The
strength of the next rebound -- probably underway as of Wednesday --
should 'clue us in' as to whether a bottom is already in place or
whether new lows will occur first.
Update
on Stock Selections
(Note: To review the complete list of current TSI stock selections, logon at http://www.speculative-investor.com/new/market_logon.asp
and then click on "Stock Selections" in the menu. When at the Stock
Selections page, click on a stock's symbol to bring-up an archive of our comments on the stock in question)
 Uranium One (TSX: SXR). Shares: 133M issued, 147M fully diluted. Recent price: C$12.35 Uranium One (TSX: SXR). Shares: 133M issued, 147M fully diluted. Recent price: C$12.35
There has been a large correction in the uranium sector of the stock
market over the past few months. This correction has resulted in many
of the mid- and large-size uranium miners losing 30% of their market
value and many of the juniors losing more than half of their market
value.
There is no evidence that the correction has ended, but the sector as a
whole has become so 'oversold' that even a counter-trend rebound could
yield substantial returns. We prefer the gold sector to the uranium
sector, but some diversification is warranted and this looks like a
good time to be accumulating the shares of some uranium plays.
Further to the above we note that SXR, our favourite long-term play on
the uranium bull market and currently the only uranium stock in the TSI
List, has just dropped to an area of strong support near C$12 (see
chart below). This is a likely price area for a rebound to begin.
Chart Sources
Charts appearing in today's commentary
are courtesy of:
http://stockcharts.com/index.html
http://www.futuresource.com/
|

