![]()
![]()
![]()
![]()
- Interim Update 25th October 2017
Copyright
Reminder
The commentaries that appear at TSI
may not be distributed, in full or in part, without our written permission.
In particular, please note that the posting of extracts from TSI commentaries
at other web sites or providing links to TSI commentaries at other web
sites (for example, at discussion boards) without our written permission
is prohibited.
We reserve the right to immediately
terminate the subscription of any TSI subscriber who distributes the TSI
commentaries without our written permission.
Investing in bubbles
Many assets show signs of being
immersed in bubbles right now. The most obvious example is the
cryptocurrency speculation, which includes Bitcoin, the numerous and
rapidly-multiplying Bitcoin alternatives and, more recently, the stocks
that are involved in cryptocurrency 'mining'. Other examples are the broad
US stock market, the stocks of companies involved in social media and/or
e-commerce, the market for junk bonds, and a group of junior mining stocks
where just the hint of a possible discovery has led to spectacular price
gains and market capitalisations that bear no resemblance to current
reality.
The most enthusiastic participants in each bubble believe
that although bubbles exist elsewhere, there is a special set of
circumstances that justifies the seemingly high valuations in the asset
that they happen to like. For example, many of the cryptocurrency
enthusiasts believe that the US stock market's valuation doesn't make
sense but that Bitcoin's valuation does, and many stock-market bulls
believe that the S&P500's current level is justified whereas Bitcoin's
valuation is ridiculous. However, the bubbles are all related in that they
all stem from the returns on traditional investments having been driven to
near zero by the actions of central banks.
Now, just because an
asset is immersed in an investment bubble doesn't mean that it should be
avoided. Buying something after it enters bubble territory can be very
profitable, because huge gains will often occur AFTER valuation reaches a
point where it no longer makes sense to a level-headed investor. The
problem is, if you 'know' that a particular asset is immersed in a bubble
then you will be constantly on the lookout for evidence that the bubble
has ended and that the inevitable implosion has begun. In effect, you will
constantly have one foot out the door and will be acutely vulnerable to
being shaken out of your position in response to a normal correction.
A related problem is that once something has entered bubble territory
the normal corrections tend to be vicious. Each correction will look like
the start of the ultimate collapse, so unless you are a true believer
(someone who believes so strongly in the story that they are oblivious to
the absurdity of the valuation) you will be unable to hold through. For
example, during the first half of September the Bitcoin price had a
peak-to-trough decline of about 40%. This looked at the time as if it
could be the first leg of a total collapse, but it turned out to be just a
short-term correction. Only a true believer in the cryptocurrency story
could have held through this correction.
Eventually, of course, a
vicious price decline turns out to be the start of a bubble implosion. The
true believers will naturally hold, thinking that it's just another bump
on the road to a much higher price. They will continue holding while all
the gains made during the bubble are given back.
An implication is
that you need to be a true believer to do phenomenally well from an
investment bubble, but if you are a true believer then you will be wiped
out after the bubble collapses.
Alternatively, you may decide to
participate in an investment bubble while knowing it's a bubble. In doing
so you may be able to generate some good profits, but in general you will
be too quick to sell. Therefore, while the bubble is in progress your
profits will pale in comparison to those achieved by the true believers,
although you will stand a better chance of retaining your profits over the
long haul.
The worst-case scenario is to be a non-believer and
non-participant in a bubble, but to eventually get persuaded by the
relentless rise in price that special circumstances/fundamentals justify
the valuation and that a large commitment is warranted. That is, to become
a true believer late in the game. This worst-case scenario is what happens
to most members of the general public.
What will the Fed
do in 2018?
Donald Trump will soon nominate
the next Fed chairman. The nominated person will be Powell, Taylor,
Yellen, Warsh or Cohn, each of whom is a Keynesian and a card-carrying
member of the political-economic-financial establishment. As a
consequence, regardless of who 'gets the nod' we can be sure that it will
be business as usual at the Fed. In other words, we can be sure that the
monetary policy-making course of the recent past will continue for at
least the next couple of years. We therefore don't have to wait for the
name of the next Fed chairman to be revealed to hazard guesses at what the
Fed will do in the future. So, what do we expect from the Fed?
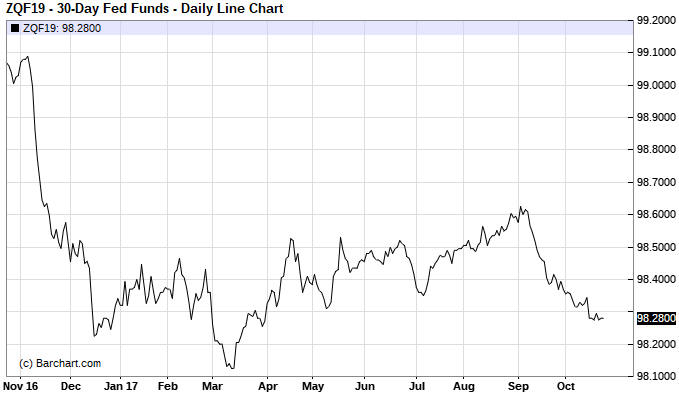
Before getting to what we expect let's take a look at what the 'market'
expects. What the market expects the Fed to do on the interest-rate front
next year is encompassed in the price of the January-2019 Fed Funds
Futures (FFF) contract, since the price of this contract will be almost
100% determined by the expected level of the Fed Funds Rate (FFR) at the
end of 2018.
The following daily chart shows that the January-2019
FFF contract was recently priced at 98.28. Since the interest rate implied
by a FFF contract is 100 minus the price of the contract, this means that
the market expects the FFR to be about 1.75% at the end of next year.
The current level of the FFR is 1.00-1.25%, and unless something
dramatic happens between now and mid-December the FFR will end the year at
1.25-1.50% (a 0.25% Fed rate hike in December-2017 is a near certainty).
This means that the mid-point of the Fed's target range should be 1.375%
at the end of this year.
The implication is that currently the
market is expecting either one or two 0.25% rate hikes from the Fed in
2018. Is this reasonable?
We don't know, because what the Fed does
in the future will be determined to a great extent by what the stock and
bond markets do in the future. To put it another way, unless you know what
the stock and bond markets are going to do next year then you cannot
possibly know what the Fed will do next year. All you can do is guess.
Based on what we currently expect from the stock and bond markets, our
guess is that the Fed will make at least two rate hikes during the first
half of 2018 in response to rising inflation fear and then take at least
one of the hikes back during the second half in response to stock market
weakness.
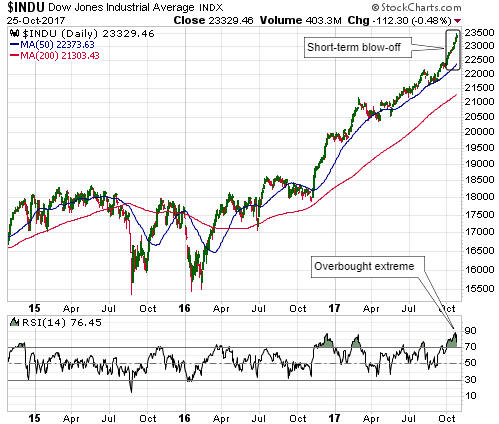
The Stock Market
An 'overbought' extreme can
sometimes be more of a sign of strength than a sign of impending danger.
An example was discussed in the latest Weekly Update in relation to
the fact that on Friday 20th October the daily RSI of the Dow Industrials
Index hit its highest level since 1980. We noted that previous extreme
daily RSI readings for the Dow, where "extreme" is defined as above 80,
had in all but two (out of about fifteen) cases since 1980 been followed
by a routine short-term correction. The two exceptions occurred in
August-October of 1987 and January-March of 1994, when the Dow traced out
a crash pattern following the 'overbought' extreme.
Consequently,
if we don't see a crash pattern start to form over the next few weeks then
we should expect a surge to well above the current level within the coming
few months. The start of a crash pattern would involve a decline of 5%-8%
within the next 2-4 weeks followed by a rebound that retraced about half
of the decline from the peak.
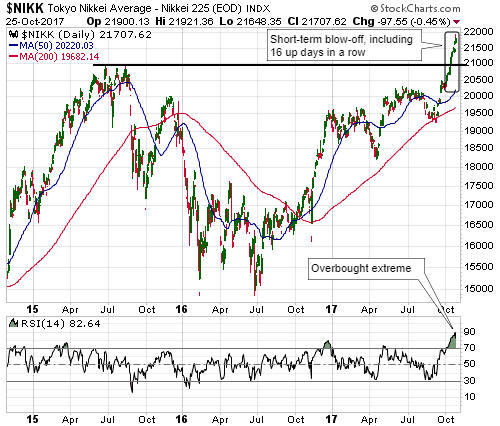
Another topical example is Japan's Nikkei225 Index. When the Nikkei
dropped a little on Wednesday 25th October it ended an extraordinary
16-day winning sequence that took the daily RSI(14) to its highest level
since 1986.
It's likely that the 'overbought' extreme will usher in
some corrective activity, but the performance reflects strong and growing
demand for Japanese equities relative to what is, in effect, a shrinking
supply. Also worth mentioning is that the demand was strong enough
relative to supply to push the Nikkei through major resistance defined by
the 2015 peak as if this resistance didn't exist.
The supply of
Japanese equities is effectively shrinking due to the actions of Japan's
central bank. As part of its asset monetisation program the Bank of Japan
has been buying ETFs and now owns about 75% (by market value) of all ETFs
traded on the Tokyo stock exchange. This 'only' amounts to about 5% of the
total stock market, but a market-wide supply reduction of 5% is definitely
significant.
Gold and the Dollar
Gold
The
fundamental backdrop was gold-bearish at the end of last week and became a
little more so over the first three days of this week. The price action
has been uneventful, though, with a loss of only $1.50 from last week's
close to the close of trading on Wednesday 25th October.
There
continues to be important nearby support at $1260. This support has not
been seriously tested yet, but equivalent support in the gold-mining
sector has been decisively breached.
The recent performances of the
gold-mining indices suggest that bullion support near $1260 will not hold
for much longer. As noted in the latest Weekly Update, if this short-term
support gives way then a quick decline to intermediate-term support at
$1200-$1220 may follow.
There could be sizable reactions in the bond and currency markets to
the outcome of the ECB meeting later today. This implies that there could
also be a sizable reaction in the gold market to the same news.
As
far as we can tell, the most popular guess within the trading community is
that the ECB will announce that its bond-buying program will continue
through the first half of next year at half the current 60B euro/month
pace. However, there appears to be enough disagreement over what will be
announced and what it will mean that there could be significant reactions
in currencies and bonds -- and therefore in gold -- even if this is what
the ECB ends up doing.
Gold Stocks
In the
latest Weekly Update we wrote:
"The one thing that all the
gold-mining indices and ETFs have in common is that the decline from the
early-September high to the early-October low was much stronger than the
rebound from the early-October low. This suggests that in each case the
October rebound was a consolidation within a continuing downward trend and
that a drop to a new 2-month low will happen soon.
A drop to a new
2-month low wouldn't require significant additional weakness from here,
but there is the risk that a sizable 1-2 week decline will begin before
the end of this week. By "sizable" we mean a decline that takes the HUI
down to near support at 180 and GDX down to near support at $21, that is,
a decline of about 10%."
We now know for sure that the October
rebound was a consolidation within a continuing downward trend because all
the gold-mining indices and ETFs made new 2-month lows over the first
three days of this week. Perhaps more significantly, the HUI/gold ratio
also made a new 2-month low. In fact, the following chart shows that the
HUI/gold ratio is close to making a new low for the year.
The good news is that the weakness over the past three days caused the
gold-mining indices to become short-term 'oversold' for the first time
since early-July. The drop in the HUI's daily RSI to the low-30s (see
chart below) is evidence. This could be setting the scene for a tradable
rally to begin soon, but only if there is significant additional weakness
over the next several days.
To be clearer, we would not be keen on
trading a rebound that began from near the current level, at least not
with the fundamental- and sentiment-related information we have today.
However, a HUI decline of another 5%-10% within the coming week or so
could create an attractive risk/reward for a long-side trade in the
gold-mining ETFs even if the fundamental backdrop remains gold-bearish.
The Currency Market
Over the past two months
we've written often about the Canadian dollar (C$) and our expectation
that it would decline to the mid-70s before a sustainable low became a
realistic possibility. We haven't said anything about the Australian
dollar (A$) except that it was in a similar position to the C$ -- likely
to drop at least as far as the mid-70s before bottoming.
The A$ has
now retraced more than half the rally from its May low and is almost
'oversold' on a short-term basis. It has also reached the top of a price
range (76-77) where there is significant support. We should therefore be
alert for signs of a correction low.
Note that there probably won't
be a correction low until the total speculative net-long position in A$
futures has been reduced to almost nothing, but the COT information is
reported only once per week and with a 3-day lag. Evidence in the COT data
that the A$ is close to a bottom could therefore come after the price
action has signaled a bottom.
Updates on Stock Selections
Notes: 1) To review the complete list of current TSI stock selections, logon at
http://www.speculative-investor.com/new/market_logon.asp
and then click on "Stock Selections" in the menu. When at the Stock
Selections page, click on a stock's symbol to bring-up an archive of
our comments on the stock in question. 2) The Small Stock Watch List is
located at http://www.speculative-investor.com/new/smallstockwatch.html
Chart Sources
Charts appearing in today's commentary
are courtesy of:
http://stockcharts.com/index.html
http://www.barchart.com/
![]()