|
- Interim Update
26th March 2014
Copyright
Reminder
The commentaries that appear at TSI
may not be distributed, in full or in part, without our written permission.
In particular, please note that the posting of extracts from TSI commentaries
at other web sites or providing links to TSI commentaries at other web
sites (for example, at discussion boards) without our written permission
is prohibited.
We reserve the right to immediately
terminate the subscription of any TSI subscriber who distributes the TSI
commentaries without our written permission.
The
Fed's Serial Bubble-Blowing
The Fed's serial bubble-blowing has been the biggest influence
on the US economy over the past 15 years. In general terms, it goes
like this: The Fed's actions help bring about a credit/investment
bubble. In a misguided effort to provide support after the bubble
bursts, the Fed then takes actions that create a new
credit/investment bubble and the cycle repeats. The economy is
structurally weakened by each new bubble, causing the Fed's
interventions to become progressively greater as it tries to
short-circuit the natural corrective process.
The official justification for the policy is that a new bubble
results in the creation of wealth and therefore helps support the
economy while the effects of the previous bubble are worked off, but
as explained by fund manager John Hussman in his latest
weekly
letter: "Only those who sell at extreme valuations have the
potential to capture any benefit from them, and that benefit only
comes by saddling some other investor with poor returns going
forward. This is redistribution, not creation of wealth."
Clearly, the Fed's actions have resulted in a lot of wealth being
redistributed to high-net-worth individuals, especially those
operating in the financial sector. This has magnified income and
wealth inequality in a way that could lead to serious social unrest
in the future. Unfortunately, successful producers of real wealth
tend to get tarred with the same brush as those who profit greatly
from the unjust wealth redistribution wrought by the Fed.
Hussman goes on to say:
"For the vast multitude of investors, repeated bouts of
Fed-induced speculation do nothing but to repeatedly create a false
hope and then dash it, as investors should have learned from more
than 15 years of alternating speculative episodes and subsequent
collapses.
Despite years of excitement during the tech bubble, leading to the
2000 market peak, the completion of the market cycle left the total
return of the S&P 500 no greater than the return from Treasury bills
for the entire period from May 1996 to October 2002.
Despite years of excitement during the housing bubble, leading to
the 2007 peak, the completion of the market cycle left the total
return of the S&P 500 no greater than the return from Treasury bills
for the entire period from June 1995 to March 2009.
Despite years of Fed-induced hope and speculation that has brought
the S&P 500 to its recent heights, we easily expect the completion
of the present market cycle to leave the total return of the S&P 500
no greater than the return from Treasury bills for the entire period
since early 1998, with annual total returns averaging less than 2%
over something like an 18-year span of time."
If the chips had been allowed to fall where they may when the
tech/internet bubble burst in 2000, the US economy would probably
have suffered a severe 2-year recession and then resumed its
long-term growth trend. However, as new inflation-fueled bubbles
pile additional economic distortions on top of the economic
distortions caused by previous bubbles it becomes more economically
painful in the short-term, and therefore more politically difficult,
to let the chips fall where they may. That's especially so when the
wrong lessons are learned from earlier attempts to mitigate the
fallout from a bursting credit bubble.
We don't know how the current monetary experiment will end. It could
eventually lead to hyperinflation, but there are other
possibilities. What we do know is that the Fed is presently headed
full-steam along a path that will create increasingly-large
obstacles to real economic progress and showing no inclination to
change course.
The best case is probably that the US economy experiences another
lost decade before commonsense and good economic theories finally
prevail.
T-Bond
Update
The correlation often isn't apparent on a daily
or even a weekly basis, but the US Treasury Bond and gold markets have clearly
been positively correlated over the past two years. Most recently, the rebound
in the gold price from its December bottom coincided with a rebound in the
T-Bond.
There has been a minor parting of ways since early February, with the T-Bond
first consolidating while gold continued to advance and then the T-Bond
advancing while gold began to consolidate. However, it's a good bet that the two
markets, that in some respects are polar opposites, will generally remain in
synch with each other for the bulk of this year. The reason is that as long as
the general level of inflation fear remains low, gold and T-Bonds will both tend
to be boosted by signs of economic weakness and pushed downward by signs of
economic strength.
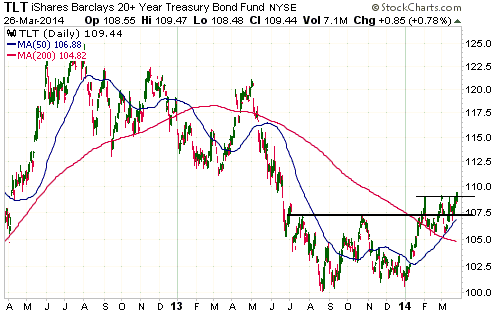
TLT, an ETF proxy for long-dated US Treasury Bonds, completed a 6-month basing
pattern in early February and then immediately started to consolidate. The price
action suggests that its short-term consolidation might have just ended. At the
same time, sentiment remains constructive in that the public (the 'dumb money')
is currently not interested in owning T-Bonds.
We guess that TLT will work its way up to 115 within the next few months.
The Stock Market
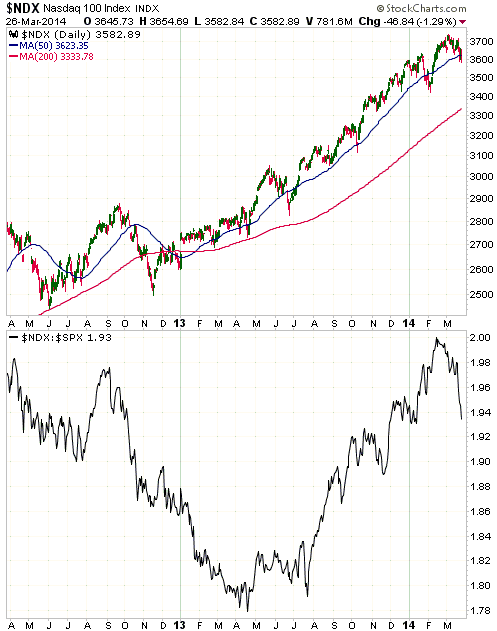
The following chart shows the NASDAQ100 Index (NDX) and the NDX/SPX
ratio. Notice that while the NDX's decline from its high has been very minor to
date in dollar terms, relative to the SPX it has dropped sharply over the past
few weeks.
We are pointing out the pronounced change in the NDX's relative strength because
it could turn out to be important. The reason is that the upward trend of the
past year was characterised by strength in the tech-heavy NDX relative to the
other senior US stock indices.
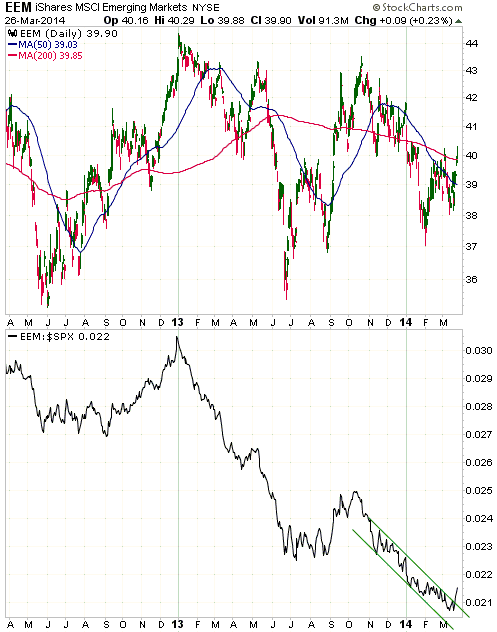
Turning to the "emerging markets", the top section of the following chart shows
that EEM has again moved up to test lateral resistance and its 200-day MA
at/near $40. Its performance in US$ terms has been choppy and trendless, but
relative to the SPX it has been in a clear-cut downward trend. The bottom
section of the following chart illustrates EEM's relative weakness.
Interestingly, over the past two trading days the EEM/SPX ratio broke out to the
upside from the well-defined channel that had limited its movements since
October-2013. We take this as an early warning that even if EEM's bear market is
not complete, it could be about to strengthen relative to the US stock market
for at least a couple of months.
Gold and the Dollar
Gold
From the email
sent to subscribers after Tuesday's US trading session:
"...although gold made new lows for the move this week, we continue to expect
that the overall correction will end up being roughly in line with the future
price path drawn on the chart included in the latest Weekly Update.
Specifically, we are looking for an initial low around the current time followed
by a rebound and then a second/final decline that breaches or successfully tests
the initial low. However, we think that the remaining downside potential is
small and have therefore shifted our short-term outlook from "neutral" to
"bullish"."
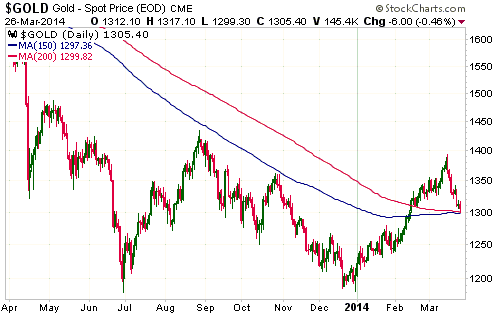
The following daily chart shows that this week's market action has taken the
gold price down to the 150-day and 200-day moving averages, both of which are
near $1300. This was considered to be the most likely place for the overall
correction, rather than just the first leg of the correction, to end, but with
the first leg having already taken the price down to $1300 it is now very
probable that the overall correction will be larger than expected.
The expected price pattern (an initial decline, a rebound to a lower high and
then a second decline that tests or breaches the low of the initial decline)
hasn't changed, but it is clear that the overall correction is going to be both
deeper and longer than previously thought likely. With next Monday (31st March)
being the end of the quarter we won't be surprised if the initial decline
extends into the early part of next week and the overall correction extends into
the second half of April. Lateral support at $1275-$1280 is now the most
probable area for a correction low.
Gold Stocks
Although the correction in the gold bullion market is going to be deeper and
longer than expected prior to this week, provided that it doesn't do much worse
than result in a test of lateral support at $1275-$1280 it will still be
'run-of-the-mill'. However, the gold-mining sector has already exceeded the
bounds of a routine correction within a short-term upward trend. In doing so it
has become more 'oversold' than anticipated.
To further explain, the 150-day MA acted as resistance over the past 12 months.
When this resistance was decisively breached in February it became support that
would be a likely downside target for a future correction. The support would
hold if tested as part of a routine short-term correction, but, as illustrated
by the following daily charts of the XAU and GDXJ, it hasn't. Also, whereas a
routine short-term correction would be expected to take the daily RSI(14) down
to around 45-50, the bottom sections of the following charts reveal that the RSI
for both the XAU and GDXJ has dropped to the mid-30s.
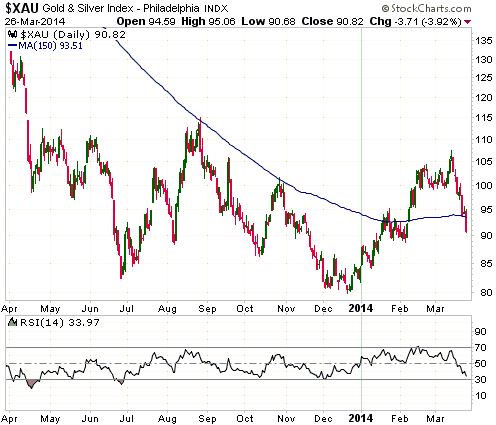
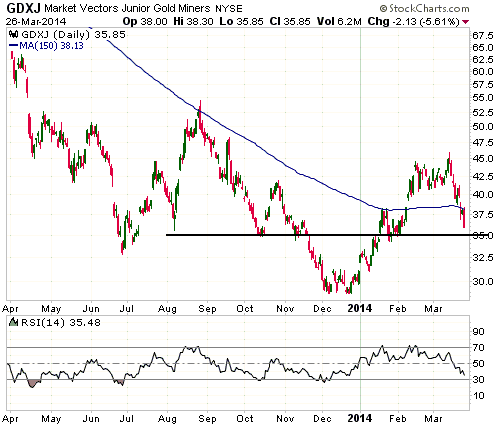
The price pattern for the gold-stock indices will end up looking similar to that
of gold bullion, but what we should see as the correction progresses is
resilience in the mining stocks. This will ideally lead to a bullish
non-confirmation, with new correction lows in gold not being confirmed by new
correction lows in the HUI and the XAU.
The Currency Market
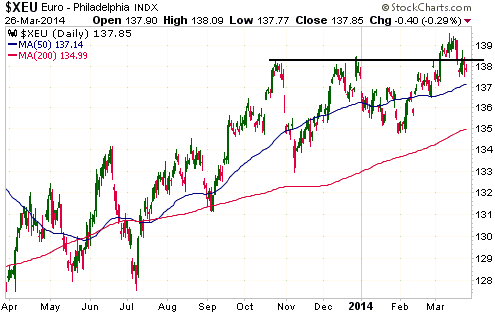
The Euro
Due to the US$/euro exchange rate being almost 60% of the Dollar Index, bearish
on the Dollar Index means bullish on the euro. However, it is difficult to be
bullish on the euro when the ECB seems -- via the public utterances of its
representatives -- to be paving the way for the implementation of a NEGATIVE
deposit rate with the aim of forcing European banks to make ill-conceived
lending decisions.
Our short-term euro outlook has shifted from "bullish" to "neutral", which means
that our short-term Dollar Index outlook has shifted from "bearish" to
"neutral". This is not due to the increasing risk of the ECB doing something
harebrained; it is due to the euro's failure to maintain its recent upside
breakout. This breakout failure could turn out to be meaningless, but as things
presently stand it should be viewed as a warning sign.
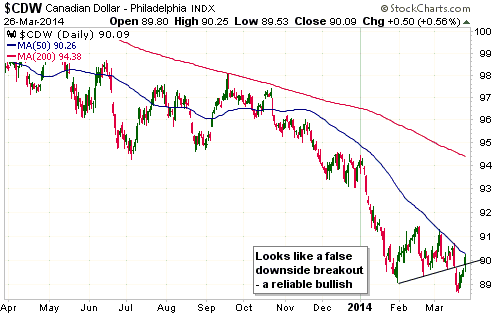
The C$
By early March the A$ had done enough to clearly indicate that an
intermediate-term bottom was in place, but the C$'s price action indicated the
potential for a decline to new multi-year lows prior to such a bottom. The C$'s
decline to new multi-year lows happened last week, but this week's market action
suggests that last week's downside breakout was false. As we've noted numerous
times over the years, a false downside breakout is a reliable bullish signal. In
fact, it is more reliably-bullish than an upside breakout.
The 50-day MA limited earlier rebound attempts, so a daily close above this MA
would provide a clearer indication that last week's downside breakout was false.
Updates
on Stock Selections
Notes: 1) To review the complete list of current TSI stock selections, logon at
http://www.speculative-investor.com/new/market_logon.asp
and then click on "Stock Selections" in the menu. When at the Stock
Selections page, click on a stock's symbol to bring-up an archive of
our comments on the stock in question. 2) The Small Stock Watch List is
located at http://www.speculative-investor.com/new/smallstockwatch.html
 From
the email
sent to subscribers after Tuesday's US trading session: From
the email
sent to subscribers after Tuesday's US trading session:
"Please note that the following three changes have been made to short-term
trading positions included in the TSI Stocks List:
1) Kinross Gold (KGC) was stopped out on Monday 24th March when it closed below
US$4.80. The result, for TSI record purposes: a 7.9% loss.
2) The UltraShort Emerging Markets ETF (EEV) was stopped out on Tuesday 25th
March when EEM closed above US$39.50. The result, for TSI record purposes: a
2.1% loss.
3) The short-term position in Gold Fields Ltd. (GFI) was exited at Tuesday's
closing price of US$4.05, solely for the purpose of locking-in a gain. The
result, for TSI record purposes: a 29% profit."
We plan to add some new short-term gold-stock trading positions within the next
few weeks, but at this stage -- despite the obvious weakness in the gold-stock
indices -- the stocks we would be most interested in adding haven't dropped far
enough to create the sort of short-term reward/risk ratio that we desire. We are
also interested in adding a long-term position in a particular junior gold
stock, but the stock we have in mind has held up relatively well to date and
would have to fall by at least 10% from its current level to find its way into
the TSI List.
Chart Sources
Charts appearing in today's commentary
are courtesy of:
http://stockcharts.com/index.html

|
