![]()
![]()
![]()
![]()
- Interim Update 26th April 2017
Copyright
Reminder
The commentaries that appear at TSI
may not be distributed, in full or in part, without our written permission.
In particular, please note that the posting of extracts from TSI commentaries
at other web sites or providing links to TSI commentaries at other web
sites (for example, at discussion boards) without our written permission
is prohibited.
We reserve the right to immediately
terminate the subscription of any TSI subscriber who distributes the TSI
commentaries without our written permission.
Taking longer than
expected
In the financial markets things
often take longer than expected to start happening and then happen faster
than expected. Perhaps this is due to a type of inertia. Once a large
majority of market participants embrace a particular view of the financial
world it can take a lot of evidence over a long period to shift a critical
mass to an opposing view, but after a critical mass has shifted its
outlook there is a virtual breaking of the dam.
Anticipating the
breaking of the dam wall is problematic. This is because as long as the
cracks remain small, any steps that are taken to protect against or profit
from the wall's eventual/inevitable rupture will result in an opportunity
cost or a loss. However, a hefty bet on the cracks remaining
small/manageable will result in disaster if it is maintained just a little
too long.
Extending the analogy, the challenge is that while the
dam's structural weaknesses can be determined with a fair degree of
accuracy there is never any way of knowing, in advance, exactly when the
cumulative effects of these weaknesses will cause the wall to collapse. In
other words, there's no way of knowing exactly when market participants
will shift their collective perception in a way that creates a tipping
point.
The most obvious current example of something taking longer
than we expected is the start of an intermediate-term decline in the US
stock market, but that's not the only example. There's also the downward
correction in the Dollar Index, which was originally expected to end
during the first quarter.
When financial-market outcomes don't
occur within the expected timeframe it's important to make at least a
partial retreat, that is, to temporarily be less aggressive. This is
because it is much easier to be objective when you don't have a lot at
stake.
The Stock Market
The US
Revisiting the reasons to be bearish
Last month we published a list of reasons to be both short- and
intermediate-term bearish on the US stock market. Although the S&P500
Index (SPX) subsequently never traded more than about 3% below its
early-March peak and broke above a significant resistance level on Monday
of this week, most of the reasons still apply. Here's the list again, with
a note regarding current status below each item.
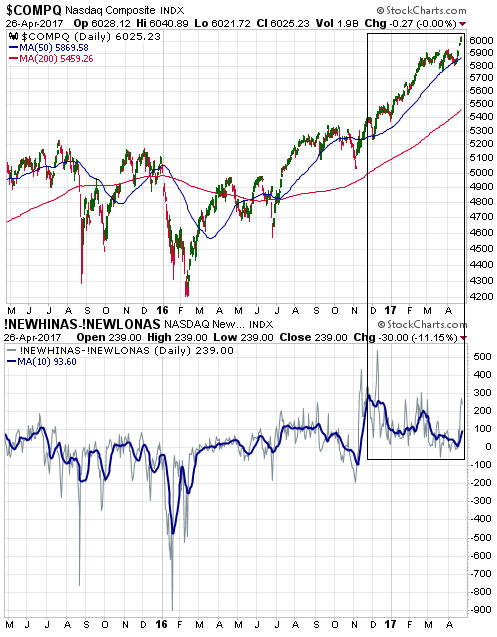
1) A bearish
divergence between market internals and the senior indices.
As
mentioned in the latest Weekly Update and as illustrated by the following
chart, the bearish divergence is intact. Note: The chart shows that the
NASDAQ Composite Index and the 10-day MA of the NASDAQ's High-Low
Differential (the 10-day MA of the difference between the number of
individual NASDAQ stocks making new 52-week highs and the number making
new 52-week lows) have been trending in opposite directions since
late-November.
We reiterate that the divergence is more likely to
be closed by declines in the senior indices than improvements in market
internals, although, as we are seeing, such divergences can persist for
many months before they matter.
2) Sentiment, as evidenced by the unusually high level of the
Investors Intelligence (II) bull/bear ratio.
Sentiment is still a
threat, as the pervasive bullish complacency of early-March was reduced
only a little by the market's March-April downward drift.
3) The
extreme readings of momentum oscillators such as the RSI.
In
February the SPX became as 'overbought' (in momentum terms) as it ever
gets, which was a warning to expect price weakness. However, the 6+ weeks
of downward drift following the 1st March peak eliminated this threat.
4) Weakness in the T-Bond market.
As we mentioned a month ago,
this threat has subsided. Weakness in the T-Bond market would become the
stock market's biggest problem if the T-Bond were to make a sustained
break below its December low, but it looks like a T-Bond breakdown has
been postponed by at least a few months.
5) The depletion of the
US Treasury's cash reserve and the "debt ceiling" issue.
In the
27th March Weekly Update, we wrote:
"The US government should
be able to fund itself for the next three months, partly because tax
payments enable the government to run a substantial surplus every April
and partly because there are accounting tricks that enable additional
borrowing without increasing the official total debt figure. However, it's
possible that the Treasury will be out of both money and accounting tricks
by the end of July. Furthermore, it's a good bet that the financial
markets will start 'worrying' about the government's inability to add to
its total debt well before the Treasury runs out of money and accounting
tricks."
And:
"...the extraordinary stock-market
strength of the past few months was to a large extent predicated on the
belief that Trump's tax-cutting and infrastructure-spending plans would
give a hefty boost to corporate earnings, but there is no possibility of
any real progress being made with regard to implementing these plans until
there is a substantial elevation of the "debt ceiling". Furthermore, after
the "debt ceiling" negotiations get into full swing it could become
apparent that tax-cutting will be a 2018 story and ramped-up
infrastructure-spending will be a never story."
We don't know
when the stock market will start worrying about the government's inability
to add to its total debt and more generally to fund itself, but based on
the price action it obviously hasn't started worrying yet.
This is
still an issue. It will eventually become important, but perhaps not until
June-July.
6) The signs of weakness in the prices of industrial
commodities.
Given that the commodity-price weakness has recently
become more pronounced, this is very much still an issue.
7) The
tightening of monetary conditions.
With the annualised 3-month
rate-of-change in the US money supply having just fallen to its lowest
level in more than 17 years, the tightening of monetary conditions is now
the most important reason to be concerned about intermediate-term downside
risk.
8) The tendency over the past 18 years for major turning
points in the US stock market to happen in March.
Although the 1st
March high for the SPX is still the current bull market's high to date, it
appears that a turning point of importance did not happen in March-2017.
9) Regime uncertainty.
Due to Trump's foreign-policy flip-flops
and increasing haphazardness, this appears to be a bigger threat today
than it was a month ago.
Current Market
Situation
As outlined above, six of our nine reasons to be
both short- and intermediate-term bearish on the US stock market remain
valid. It doesn't seem to matter, though, because the SPX managed to hold
above its March low earlier this month and quickly returned to its March
peak during the first half of this week. This week's price action paints
the March-April decline as a routine consolidation.
A break to new highs is likely, either immediately or following a few
days of 'backing and filling'. Beyond that, we have no opinion regarding
the market's short-term prospects.
We do, however, remain
intermediate-term bearish, mainly due to items 1), 2), 5) and 7) in our
list of reasons to be bearish.
Gold and the Dollar
Gold
Over the first three days of this week the US$ gold price pulled back and
tested support at $1260. A daily close below $1260 would be gold's first
material sign of weakness, but the performance of the gold-mining sector
continues to sound a cautionary bell.
With the Dollar Index dropping to a 5-month low during the first half
of this week, gold's pullback to support might seem strange to some market
observers and pundits. However, there was nothing strange about it.
A quick 1%+ decline in the Dollar Index will usually be accompanied by
a rise in the US$ gold price IF all else remains the same, but all else
often doesn't remain the same. In particular, movements in the T-Bond
price can counteract the effects on the gold price of movements in the US
dollar's exchange rate, because the positive correlation between the gold
price and the bond/dollar ratio is stronger than the negative correlation
between the gold price and the Dollar Index.
The following chart
shows the gold price and the bond/dollar ratio over the past three months.
Both the gold price and the bond/dollar ratio peaked on 18th April and
have since pulled back.
Gold Stocks
Current Market Situation
The HUI had to close below 202 to
indicate that the rebound from the March low was over and that a decline
to below the March low, and quite possibly to below the December-2016 low,
was in progress. The close below 202 happened on Monday 24th April. The
HUI then fell sharply on Tuesday and traded as low as 186 on Wednesday
before rebounding.
Despite this week's break below short-term support it is still
possible that the HUI is consolidating prior to a move to new highs for
the year, but this possibility has a very low probability. The relative
weakness in the gold-mining sector over the past 2.5 months suggests that
a capitulation will be required to 'clear the decks' and create the type
of sentiment backdrop capable of launching a strong rally.
A
capitulation could occur as soon as next week, leading to an excellent
sector-wide buying opportunity during the first half of May. However,
there could also be 1-2 months of frustrating, back-and-forth price action
between the March low and the April high prior to a capitulation.
The first of the aforementioned possible outcomes would be the easier to
trade, but the market is not under any obligation to make things easy.
Junior Gold Mining ETFs
To
overcome the liquidity-related issues stemming from its own increasing
popularity, the Market Vectors Junior Gold Miners ETF (GDXJ) will be
revamped such that it is more of a proxy for mid-tier gold miners than
junior gold miners. This prompts the question: Is there a better ETF for
investors wanting broad-based exposure to the junior end of the
gold-mining universe?
We're not sure. Alternatives include the
Global X Gold Explorers ETF (GOEX) and the Sprott Junior Gold Miners ETF
(SGDJ), both of which have performed better than GDXJ over the past couple
of months. However, these alternatives are also weighted more towards
mid-tier than junior mining companies.
Based purely on past
performance, which, as the commonly-used disclaimers say, is not
necessarily indicative of future performance, GOEX is the best of these
ETFs. Over the past two years GOEX handily outperformed both GDXJ and
SGDJ.
Here are charts of GDXJ, GOEX and SGDJ. Notice that GDXJ has
broken below its March low whereas GOEX and SGDJ are currently testing
their March lows.
The Currency Market
The outcome of the first
round of France's presidential election greatly reduced the potential for
meaningful political change and caused the financial world to breathe a
huge sigh of relief at the beginning of this week. This sigh of relief
manifested in rapidly-rising European equity prices, leading to a sharp
rise in the euro/US$ exchange rate.
A knock-on effect was an
extension of the Dollar Index's short-term decline. The Dollar Index has
managed to hold above support at 98.6 on a daily closing basis, but there
is a decent chance that this support will soon be breached.
The 98.6 support level is a 'line in the sand' that ideally would not
have been crossed. However, if it is crossed during the next week or so we
suspect that the downside breakout will be short-lived. This is because
the break below support would be happening with the market 'oversold' and
because the Dollar Index has made an intermediate-term bottom during the
month of May in each of the past three years (meaning: for some unknown
reason the Dollar Index has established a yearly cycle with a low in May).
Updates on Stock Selections
Notes: 1) To review the complete list of current TSI stock selections, logon at
http://www.speculative-investor.com/new/market_logon.asp
and then click on "Stock Selections" in the menu. When at the Stock
Selections page, click on a stock's symbol to bring-up an archive of
our comments on the stock in question. 2) The Small Stock Watch List is
located at http://www.speculative-investor.com/new/smallstockwatch.html
![]() Mariana
Resources (MARL.V) gets bought
Mariana
Resources (MARL.V) gets bought
We introduced MARL to the
TSI readership and added it to the
TSI
Small Stocks Watch List (SSWL) in the 27th March Weekly Update when it
was trading at C$0.95. At that time we described MARL as having part
ownership of one of the best projects (the Hot Maden gold-copper project)
in one of the worst locations (Turkey).
We concluded:
"The
country risk means that MARL is not well suited to being a significant
holding, but with the price having dropped back from a mid-January
(post-PEA) peak of C$1.50 to C$0.95 it could be worth a small-sized bet."
It was announced prior to the start of trading on Wednesday 26th April
that Sandstorm Gold (SAND) had agreed to buy MARL. Based on Tuesday's
closing price for SAND the deal valued MARL at about C$1.90/share, but,
due to a post-announcement decline in the price of SAND, MARL ended
Wednesday's session at 'only' C$1.71. This constituted a one-day gain of
66%.
MARL is now within 20% of being fully valued and in the future
its price will move up and down with the price of SAND. It has therefore
been removed from the SSWL. Needless to say (but we'll say it anyway),
anyone who owns the stock should sell.
Chart Sources
Charts appearing in today's commentary
are courtesy of:
http://stockcharts.com/index.html
![]()