|
- 26 June, 2002
Commodities
Our 2002 forecast, published at the
beginning of this year, was for commodities to perform very well relative
to stocks. We weren't confident, however, that commodity prices would be
able to provide good absolute returns in the face of a severely weak stock
market. This was because the CRB Index had tended to move in lock-step
with the S&P500 Index over the past couple of years.
Below is a chart comparing the CRB
Index and the S&P500 Index since January 2000. Notice how commodities
and stocks were moving together until the beginning of this year when a
divergence occurred with commodity prices continuing to move up while the
stock market tanked.
The extent of the CRB's strength relative
to the S&P500 since the beginning of this year is illustrated by the
following chart of the S&P500/CRB ratio (the line falls when the CRB
is rising relative to the S&P500).
So, was our concern that commodity
prices would be held back by a weak stock market unfounded? It is too early
to tell since we are probably yet to see the worst of the stock market's
decline. Also, the CRB Index has received a substantial boost as a result
of energy prices being pushed higher in anticipation of a war in the Middle
East.
The way we see it, the worst case for
the CRB Index is that it trades sideways while the stock indices work their
way towards major lows and begins a powerful up-trend as soon as the stock
market bottoms.
Unlike the major stock indices, which
are still priced as though we were in the best of all possible worlds,
the CPI-adjusted prices of many commodities are near their Great Depression
(1932) lows. We are in a world where substantial inflation (money supply
growth) has already occurred and where the monetary authorities will remain
under enormous pressure to continue the inflation. As such, the probability
of those Great Depression commodity-price lows being breached is miniscule
and most surprises are likely be on the upside.
It's all well and good to have a view
on what the market is going to do, but price action must confirm that view
within a reasonable time. So far, prices are generally doing what they
should be doing if our longer-term bullish view on commodities is going
to prove to be correct. Firstly, the CRB Index has been in an up-trend
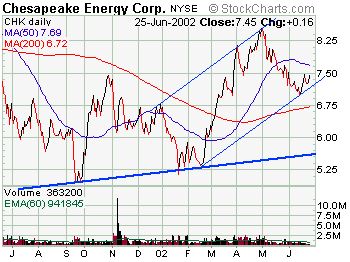
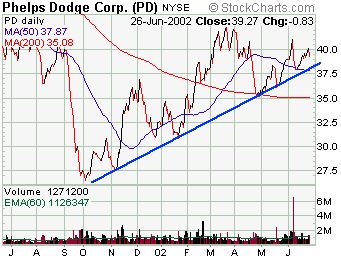
since October of last year. Secondly, the stocks of the commodity producers,
which are often good leading indicators of the associated commodities,
have held up well over the past few months. As examples, below are charts
of copper/coal producer MIM Holdings, natural gas producer Chesapeake Energy
and copper producer Phelps Dodge. These stocks remain in up-trends and
appear to be simply marking time while the bloodbath in the telecom sector
runs its course. Thirdly, although it dropped quite sharply on Wednesday
the A$, another leading indicator of commodity prices, has been very strong
since last September (a 3-year chart of the A$ is shown below).
One last point before we leave the
commodities market. The world's attention is often drawn to what is happening
in the US and at the moment the financial news of the day revolves around
the on-going carnage in the US telecommunications sector. However, demand
coming from China will potentially be one of the most important drivers
of commodity prices in the years ahead. If the Chinese economy continues
to expand at a rapid rate then China's increasing consumption of oil and
industrial commodities will put substantial upward pressure on commodity
prices.
The US
Stock Market
Value and Trust
During the 1990-1991 bear market the
greatest fear in the stock market was that some of the major banks, including
Citibank, were going to go bust. Today, the market appears to be in the
process of discounting the total collapse of the US telecommunications
industry. The industry won't collapse and the stock prices of the survivors
will be hundreds of percent above current levels in a few years time, but
the challenge lies in picking the survivors. The task of picking the survivors
today is, however, made all the more difficult by an inability to trust
the financial reports issued by the corporations. Worldcom looked like
a bargain a couple of week's ago at $2 per share, but anyone who paid that
price has probably lost 100% of their investment. It doesn't matter whether
you pay $200/share or only 20c/share for the stock of a company, if the
company goes bust you lose 100% of your money.
The lack of trust is a major issue,
particularly with the companies that have substantial debt and where the
incomes of senior managers have been largely dependent on stock price performance
(where there has been a huge financial incentive to make things seem better
than they really are). Non-insiders must rely on the integrity of the financial
information issued by companies and if that information can't be trusted
then there is no basis for making an investment, at least from a value
perspective, regardless of how cheap the price appears to be.
It has become very easy to find good
value in the tech and telecommunication sectors. For example, Lucent's
current market cap is less than 50% of its annual revenue and Corning's
current market cap is around 80% of this year's revenue. There also appears
to be tremendous value in some of the cable companies with Cablevision
now trading at around 50% of revenue and Charter Communications selling
at an incredible 30% of revenue. These companies are all presently losing
money but if they can manage to survive and work their way back to profitability
then their stock prices will make enormous gains from current levels.
Despite the apparent value we are not
yet jumping into tech/telecom stocks with both feet. This is partly because,
as mentioned above, we can't trust the financial reports. It is also because
there are still some very large companies that have ludicrously-high market
caps relative to the sizes of their businesses (for example, Microsoft
is still priced at 10-times its annual revenue). Lastly, although the technical
and sentiment evidence indicates that the market might be very close to
a short-term low, our assessment is that the market is not yet close to
a long-term low.
Current Market Situation
The news of Worldcom's massive fraud
created a spike in fearfulness during the first couple of hours of trading
on Wednesday that actually helped set the stage for the grind higher over
the remainder of the day. To put it bluntly, the Worldcom debacle caused
anyone who was on the verge of selling to puke-up their shares near the
start of trading. After that any incremental buying was bound to move prices
higher.
Sentiment has certainly reached levels
that are consistent with at least a short-term bottom. For example, in
addition to the spike in volatility, the high put/call ratios, the high
Arms Index readings and the low bullish percentages reported by the popular
sentiment surveys, there are now two dollars in Rydex money-market and
bear funds for every one dollar in Rydex bull and sector funds. What we
don't have, as yet, is a genuine reversal. Yesterday's rebound in the stock
indices was impressive but it was not confirmed by good breadth (on both
the NYSE and the NASDAQ there were more declining stocks than advancing
stocks and down volume exceeded up volume). The bottom line is that we
can't be sure the sell-off on Wednesday morning didn't create a low that
will hold for several weeks, it's just that we have no evidence that it
did.
Below is a chart of the S&P600
Index, an index of small cap stocks. Strength in small cap stocks since
last September prompted some analysts to wrongly conclude that a new bull
market was underway, so over the past few months we have been paying more
attention than usual to this index. The S&P600 has just dropped marginally
below its 200-DMA, but remains above support at 220.
Hopefully Wednesday's rebound will
evolve into a multi-week rally, thus allowing us to buy more put options
at good prices in preparation for the next, and possibly final, downward
leg. The risk is that the capitulation is not yet complete, even in the
short-term, and that yesterday's lows will be decisively breached at some
point over the coming week. If this is the case then our gold stocks, which
currently appear to be discounting a sustained rebound in both the stock
market and the Dollar, would almost certainly come back to life.
Gold and
the Dollar
The new SA mining legislation
The new Minerals and Petroleum Development
bill has made its way through the South African parliament and currently
sits on president Mbeki's desk awaiting his signature. Based on what we've
read there will probably be some further minor changes to the Bill, but
the final version could be enacted as early as mid-August.
The Government's goal with this bill
is to gain more control over the exploitation of SA's vast mineral wealth.
The new legislation will help them achieve this goal by transferring the
ownership of all mineral rights to the State. Those wanting to prospect
and mine will then have to apply for licenses to do so.
Having the ownership of all mineral
rights transferred to the State is certainly not a good thing, but it doesn't
significantly reduce the value of existing gold mining company assets.
This is because the current owners (the mining companies) will have the
exclusive right to apply for licenses to continue mining/exploring their
existing assets. As far as we can tell the main problems with the Bill,
from an investment perspective, are that a) it creates uncertainty by giving
more weight to ministerial 'discretion' at the expense of objective law,
and b) it will result in preference being given to "historically disadvantaged"
persons when granting new licenses (the SA Government's objective is to
have 30% black ownership of the mining industry). Greater uncertainty usually
means higher risk premiums (lower prices). 30% black ownership of the mining
industry is not a problem and, for that matter, neither is 50% nor any
other percent. The problem here is that the laws of a country should not
discriminate, even if the goal of the discrimination is to redress past
wrongs.
The big question is, should we continue
to invest in companies such has Harmony and Gold Fields given the new risks,
or at least the uncertainties, created by this new legislation?
The answer is yes, for two reasons.
Firstly, the stock market is a discounting mechanism and since the risks
associated with this new bill have been well-publicised it is reasonable
to assume that the market's worst fears are already factored into the current
stock prices. Secondly, as investors in Harmony Gold (for example) we are
being well-paid to take on additional risk. This is because Harmony's gold
reserves are selling for US$58 per ounce whereas we would have to pay US$100
per ounce for Newmont's reserves, US$320 per ounce for Agnico Eagle's reserves
and US$440 per ounce for Goldcorp's reserves.
Our view is that the stocks of Harmony
and Gold Fields will out-perform their North American counterparts by a
wide margin during the next stage of this gold bull market. SA has traditionally
been perceived to have a lot more political risk than, for example, the
US, but strangely enough this risk has always seemed less important to
investors during those periods when the gold price has been trending higher.
Harmony and Gold Fields remain our
two favourite investments amongst the larger-sized (>US$1B market cap)
gold producers. However, investors certainly shouldn't have all of their
eggs in the SA basket. It is fine to take a risk if you are being paid
to take the risk, but you never risk everything even if the odds are heavily
in your favour. As such, geographical diversification is important in a
gold/silver stock portfolio. Furthermore, although we like some of the
large-sized SA gold stocks (HGMCY, GFI and even DROOY), we see no reason
to speculate on the small SA gold stocks since there are plenty of good
opportunities in the more politically-safe countries.
Current Market Situation
Below is a 7-year chart of the Dollar
Index. The dollar slid through major support at 108 with ridiculous ease
and stopped at the long-term up-trend line. There is little doubt that
the up-trend will be broken and that the Dollar will fall to much lower
levels, but it really would be extraordinary if this support gave way immediately.
As far as we can tell, the plunge in
the Dollar is not being driven to any significant extent by speculation
in the futures markets. What we have seen over the past 3 months is what
happens to the currency of a country that is heavily reliant on the constant
in-flow of investment capital when those capital flows diminish. Even the
Bank of Japan's recent efforts to support the Dollar against the Yen met
with only fleeting success. As the following chart shows, the Yen is once
again upwardly mobile. It is, however, approaching some serious resistance
in the 84-87 range. If nothing else the close proximity of this resistance
will probably cause the BOJ to spring back into action and resume their
Yen selling (central banks look at charts and try to intervene at those
times when their buying/selling will have maximum impact).
There is no change to our views on
gold and gold stocks. A correction is underway that will potentially last
for another 2 months or so, but this is a correction within a major bull
market and the sharp dips should therefore be bought. In the 5th June Interim
Update we suggested under-the-market buy prices for a few stocks, warrants
and options that would make suitable additions to the portfolio of anyone
who felt under-exposed to the gold sector. Some of these recommendations
subsequently hit our suggested buy prices before rebounding to higher levels.
Below is a chart showing the gold price
in euros. The euro gold price is close to important support and we expect
this support to hold.
Our chart showing the ratio of gold
stocks (as represented by the TSI Gold Stock Index) and the gold price
confirms that gold stocks are still in an up-trend relative to the bullion.
This, in turn, is evidence that we are simply seeing a correction in a
bull market.
Update
on Stock Selections
We are going to add 2 more gold stocks
to the Portfolio, Bendigo Gold (ASX: BDG) at A$0.305 and Canyon Resources
(AMEX: CAU) at US$2.25.
Below is a chart of BDG. We successfully
traded BDG earlier this year and have continued to follow it over the past
few months. The recent upside breakout on increasing volume has prompted
us to establish a new position.
BDG is not exactly a cheap stock. It
has a market cap of around US$160M and has not yet proven-up any resources.
However, BDG controls all the tenements in the Bendigo gold mining area
and exploration/research carried out by the company over many years has
identified a resource potential in excess of 12M ounces. The savvy management
team at Harmony Gold liked BDG enough to invest A$50M in the company last
year, giving it a 33% stake. Harmony can take its ownership of BDG to more
than 50% through the conversion of options at A$0.30/share. BDG, in partnership
with Harmony, plans to develop a 400,000 oz/year operation at Bendigo.
Below is a chart of Canyon Resources.
CAU has 10M ounces of gold resources, 5M ounces of gold reserves (estimated
at a gold price of $300/oz), and a market cap of only US$40M. Furthermore,
all of its resources and reserves are located in the US. Most North American
gold reserves are priced by the market at around $100/oz, yet CAU's reserves
are available for only $8/oz. What's the catch? The catch is that almost
all the resources are located in Montana and an anti-mining initiative
was passed in Montana in 1998 that prevents CAU from developing these resources.
A more detailed explanation can be found here: http://www.canyonresources.com/projects/mcdon.html.
Canyon subsequently filed a lawsuit with the aim of overturning the anti-mining
initiative or obtaining damages. If the lawsuit is successful then CAU
would be worth at least $20/share. If not, it would probably be worth less
than $1/share. So, buying CAU is a bet on the outcome of a court case with
an interesting risk/reward ratio. We are told that a decision is due on
18th August. Thanks to Charles M for the 'heads up' on Canyon.


|
