![]()
![]()
![]()
![]()
- Interim Update 26th July 2017
Copyright
Reminder
The commentaries that appear at TSI
may not be distributed, in full or in part, without our written permission.
In particular, please note that the posting of extracts from TSI commentaries
at other web sites or providing links to TSI commentaries at other web
sites (for example, at discussion boards) without our written permission
is prohibited.
We reserve the right to immediately
terminate the subscription of any TSI subscriber who distributes the TSI
commentaries without our written permission.
Commodities
The copper market
catches fire
The copper price surged to a 2-year high on
Tuesday 25th July and is now testing long-term resistance at $2.90-$3.00.
There were many guesses in the press about the reason for this week's
sharp price rise, including optimism about China's economic growth and
concerns about production at some of the world's largest copper mines.
What's our guess?
Our guess is that it was partly driven by
speculation regarding the increasing copper demand for use in electric
vehicles*. This is a long-term positive that shouldn't have a big effect
on the supply-demand balance anytime soon, but speculative enthusiasm
doesn't have to be firmly grounded in reality.
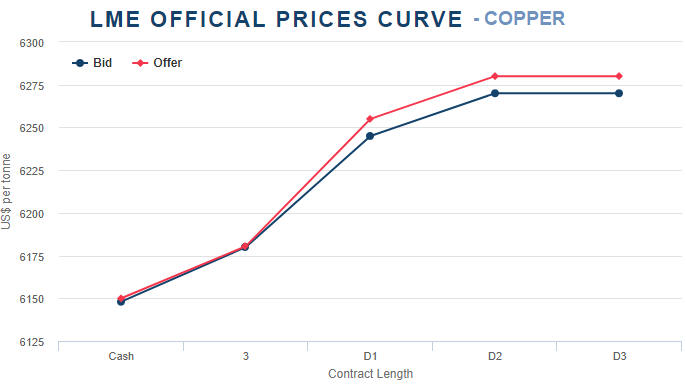
Whatever the reason,
it is clear that speculators have played the biggest role in this week's
rapid rise in the copper price. We say this because of the behaviour of
the "term structure" in the copper futures market. As illustrated by the
first of the following charts from the London Metal Exchange (LME) web
site, there continues to be a 'normal' upward slope over time in the
prices of copper futures, meaning that later-dated contracts are priced
higher than earlier-dated contracts. To put it another way, the copper
market is in a normal state of "contango". This means that there is no
current tightness of supply nor any expectation among commercial traders
that supply will tighten in the foreseeable future.
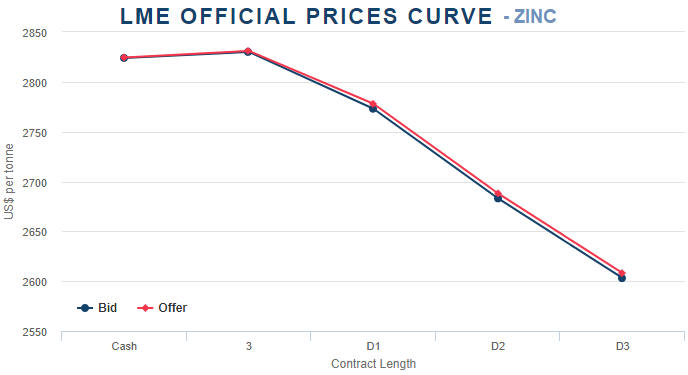
The second of
the following charts from the LME site shows the "term structure" of a
base-metal market with bullish fundamentals. This chart shows a downward
slope in the zinc futures curve, meaning that the zinc market is in
"backwardation". The implication is that in the zinc market there is
current tightness of supply and an expectation that the tightness will
persist.
The fact that the copper price is being driven upward by speculators
rather than commercial users doesn't mean that the price is close to an
important top (although it is probably nearing a multi-week top). First,
the speculators could be correctly anticipating a bullish change in the
fundamentals. Second, the latest COT data suggests that there is plenty of
additional scope for the build-up of speculative 'longs'.
We
highlighted the opportunity to bet on a short-term rise in the copper
price two weeks ago, with a particular focus on FCX (the world's largest
publicly-traded copper producer). FCX was trading at US$12.27 at the time.
We reiterated the opportunity a week ago, when FCX was trading at $13.11.
As illustrated below, in response to this week's gain in the copper price
the stock has rallied to $15.06.
For exposure to copper, Nevsun Resources (NSU) is another stock that
is worth mentioning at this time. Unlike the junior and mid-tier
copper-mining stocks that have already rocketed upward, NSU is still in
basing mode.
NSU offers exposure to two of the best -- based on our
expectation of what will happen to prices over the coming 6-12 months --
commodities, namely copper and zinc. Specifically, NSU is a current
producer of copper and zinc (mainly zinc) at its Bisha project in Eritrea
and owns one of the best exploration-stage copper projects in the world in
the form of the Timok Upper Zone (TUZ) in Serbia.
Due to the
country risk associated with Eritrea we have not considered owning NSU
shares over the past several years, but we estimate that well over half of
NSU's value is now linked to the newly-acquired (as of mid-2016) TUZ
project.
*We discussed this potential price driver in
the 19th June Weekly Update under the heading "Oil's loss will be copper's
gain".
More interested in buying weakness than selling
strength in oil
Our most recent comment on the oil market
was in the 10th July Weekly Update. At that time we wrote:
"If
the oil price bottoms near last week's [the 7th July] low and subsequently
moves up to around $50 then we will consider taking a new position in USO
(oil ETF) put options, but we have recently become more interested in
buying into oil-price weakness than selling or speculating bearishly into
oil-price strength. There are two reasons, the first of which is the
emerging evidence of a general financial-market shift in favour of
"inflation" plays such as industrial commodities. The second and more
important reason is that the rally in the Canadian dollar (C$) has
eliminated the main factor underpinning our bearish oil view."
The oil price did bottom near the 7th July low and has since moved up
to around $50, but for the reasons mentioned in the above excerpt from our
10th July report we have not taken a new position in USO put options.
There's still a realistic chance that the oil price will drop into the
$30s before reaching a sustainable price low, but the risk of this
happening is now smaller and the overall financial-market backdrop
indicates that our primary focus should be on building up long-side
exposure to industrial commodities. This includes oil, although we prefer
the industrial metals.
The Stock Market
Time for a VIX
speculation?
In the 10th May Interim Update we wrote:
"With the VIX at such a low level it is tempting to buy VIX call
options. At least, it would be if the options weren't so expensive.
VIX call options with a few months to expiry often seem expensive
because they are based on VIX futures prices rather than on the index
itself. For example, even though the VIX ended the 10th May session at
only 10.2, the October-2017 VIX futures contract ended the same session at
15.6. Consequently, if you were to buy October-2017 VIX calls right now
you would be buying calls that are priced on the basis of an underlying
index value of 15.6.
The large premium to the spot index at which
VIX futures contracts usually trade is the reason you will lose money
buying a volatility ETF/ETN such as VXX unless you get the timing exactly
right. These ETFs/ETNs are regularly rolling from relatively low-priced
nearer-dated contracts into relatively high-priced later-dated contracts,
leaking value as they go."
The VIX has since fallen from 10.2
to 9.6 (see chart below), but, more significantly for anyone interested in
trading the October-2017 call options, the price of the VIX October-2017
futures contract has since fallen from 15.6 to 13.4. This means that the
October call options are now a lot cheaper. For example, since 10th May
the price of the VIX October-2017 $15 call option has dropped from around
$3.00 to around $1.30.
At Wednesday's closing price of US$1.33 the VIX October-2017 $15.00
call options offer a good risk/reward, especially given that we are
entering the 3-month period of the year when the largest volatility spikes
have occurred in the past. If the stock market gets through the next three
months without a significant volatility spike then these options will lose
all of their remaining value and expire worthless, but we suspect that all
it would take to generate a 300%+ profit opportunity in the options would
be for the SPX to experience a 5%-10% decline prior to the 18th October
option expiry date.
Due to the attractive risk/reward, we have
added the VIX October-2017 $15.00 call option to the TSI List at US$1.33.
Keep in mind that in the absence of a significant volatility spike within
the next three months, the likely loss on this trade will be 100%.
Note that we do not suggest buying a VIX ETF or ETN. In our opinion, this
should be an option trade or no trade.
Gold and the Dollar
Gold
On
Wednesday the Fed did what we and most observers were expecting, which is
leave its targeted interest rates unchanged and continue to pave the way
for the start of a gradual balance-sheet reduction process. As we
mentioned in a
blog post
early this week: "Unless the stock market tanks in the meantime,
this balance-sheet reduction will probably be announced on 20th September
(following the FOMC Meeting) and kick off in October."
The
Fed's words prompted a minor positive reaction in the gold market. For
example, the following daily chart shows that the SPDR Gold Shares ETF
(GLD) ended the day with a gain of 0.8%. This small gain didn't alter the
chart pattern, though.
For the reasons mentioned in the latest Weekly Update (sentiment, the
gold-bullish shift in the fundamental backdrop and silver's positive
price-momentum divergence) we are open to the possibility that what was
originally expected to be a counter-trend rebound from the early-July low
will evolve into something more substantial. An upside breakout by the
gold-mining sector (see below) would indicate that we are dealing with
something more than a counter-trend rebound in the bullion market.
Gold Stocks
The gold-mining sector is now in a
very interesting position, in that over the coming few days it must either
break out to the upside or reverse downward. The reason is that GDX
reached the top of its contracting range on Wednesday 26th July.
As
illustrated by the following daily chart, GDX is essentially in the same
position now as it was when it reversed downward from multi-week highs in
April and June. Will it be different this time?
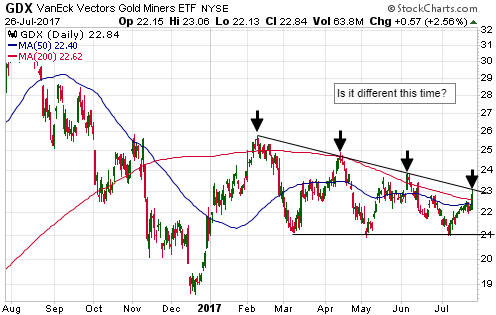
All it will take to generate evidence that it is different this time
is a daily close above Wednesday's intra-day high, meaning a daily close
above $23.06 for GDX and a daily close above 197.5 for the HUI. If upside
breakouts occur then the initial targets for the indices/ETFs will be the
February highs (220 for the HUI, $25.50 for GDX).
The
Currency Market
Different currencies have different types
of short- and intermediate-term drivers. For example, the A$ and C$ tend
to be so strongly influenced by commodity prices that almost nothing
matters except the commodity-price trend. For another example, over the
past two years the euro's performance against the US$ has been dominated
by the Germany-US 10-year interest-rate differential, although prior to
that it was most strongly influenced by the strength of European equities
relative to US equities. For a third example, refer to the following chart
showing the Yen and the US$ gold price.
Due to the performance of
the Yen having been so similar to the performance of the US$ gold price it
is reasonable to conclude that either the Yen is being driven by the gold
price or that the Yen and gold have some fundamental drivers in common.
The latter possibility is the more plausible, although we confess to being
puzzled by how tight the Yen-gold relationship has been over the past two
years.
Due to the strength of the positive correlation between the Yen and
gold, if you are bullish on the Yen you should probably buy gold. This is
because in all likelihood they will keep moving in the same direction, but
if the relationship breaks down it probably will be because the BOJ or the
Japanese government does something so stupid that the gold price shoots
upward while the Yen drops.
Updates on Stock Selections
Notes: 1) To review the complete list of current TSI stock selections, logon at
http://www.speculative-investor.com/new/market_logon.asp
and then click on "Stock Selections" in the menu. When at the Stock
Selections page, click on a stock's symbol to bring-up an archive of
our comments on the stock in question. 2) The Small Stock Watch List is
located at http://www.speculative-investor.com/new/smallstockwatch.html
![]() Removing
Cordoba Resources (CDB.V), adding Nevsun Resources (NSU)
Removing
Cordoba Resources (CDB.V), adding Nevsun Resources (NSU)
A
few weeks ago CDB.V announced a deal that worsened the risk/reward by
enough to make us want to remove the stock from the TSI List. We wrote
that we would remove the stock when it next traded above C$0.80, but we
have run out of patience and have decided to remove it at Wednesday's
closing price of C$0.77. At this price the trade ends with a break-even
result.
To maintain the same level of exposure to copper in the TSI
List we have added NSU as a trading position with an expected duration of
3-9 months. NSU was briefly discussed earlier in today's report, but here
are a few more details:
1) Based on a total current share count of
302M, NSU has a market cap of US$785M at the 26th July closing price of
US$2.60.
2) The company has a strong balance sheet, with no
long-term debt and US$196M of working capital at 31st March.
3) In
the June quarter the company's Bisha project produced 43M pounds of zinc
and 5.7M pounds of copper.
4) Based on a PEA completed in
March-2016, at a copper price of US$3.00/pound the TUZ project has an
after-tax NPV(8%) of US$1.55B and an IRR of 106%. At a more conservative
copper price of $2.40/pound the after-tax NPV(8%) is still a substantial
US$1.1B.
5) A PFS for the TUZ is scheduled for completion in
Q4-2017.
6) Our back-of-the-envelope valuation for NSU is
US$3.40/share at $2.40/pound for copper and US$4.10/share at $3.00/pound
for copper.
Chart Sources
Charts appearing in today's commentary
are courtesy of:
http://stockcharts.com/index.html
http://www.lme.com/
![]()