|
- 26 September 2001
Commodities
- the next great bull market
Our forecast at the beginning of this
year was that commodity prices, as represented by the CRB Index, would
be weak during the first half of the year and turn higher some time during
the second half. In the August-27 WMU we refined this forecast based on
our views at that time on the bond market and economic growth and argued
that the CRB Index would likely bottom in September. At the same time we
also made the following comment: "Although we give the CRB Index a reasonable
chance of turning higher during the next month we will look to the A$ and
the C$ for confirmation of a trend change. The commodity currencies tend
to move in the same direction as commodity prices and they often lead commodity
prices. A sustainable up-move in the CRB Index should therefore be accompanied
by, or led by, an upturn in the A$ and the C$."
Since we forecast that the CRB Index
would bottom in September the prospects for global economic growth have
taken a tumble due to the recent insane acts of terrorism, so where do
we now stand with respect to commodity prices?
The long-term
First, let's step back and take a big
picture view of the CRB Index. As the following chart clearly shows, commodity
prices have been in a secular bear market since 1980. Within that secular
bear trend there have been a number of cyclical bull and bear markets,
with the most recent cyclical bull market having ended late last year.
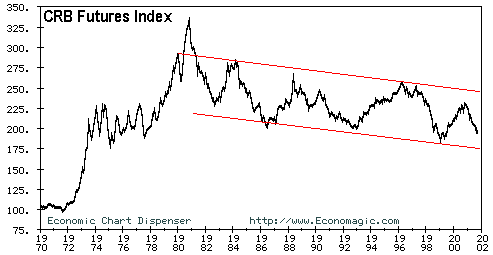
The most recent cyclical low occurred
in July of 1999 when the cash CRB Index hit 182.67. It recently traded
as low as 189, so with the 1999 bottom likely to provide solid support
the downside risk from current levels appears to be minimal. Even if the
1999 low is penetrated, the bottom of the long-term downward-sloping channel
is only a few points further down. From this purely technical perspective
there appears to be very little remaining downside in commodity prices.
Taking an even longer-term view, the
inflation-adjusted CRB Index is now at its lowest level in more than 80
years. Commodities are cheaper today, in real terms, than they were during
the Great Depression of the 1930s. When the prices of essential resources
are at 80-year lows and close to an area of good long-term price support,
it is time for investors to do some buying provided there is a good
reason to expect a change in the price trend. That good reason, in this
case, is the on-going rapid expansion of the money supply.
Explosive money supply growth such
as we have seen over the past year will have a big effect on prices,
the only question being which prices. The excessive money creation
that occurred during 1998 and 1999 had the greatest impact on tech stocks,
real estate and oil. Ex-oil, commodity prices were not major beneficiaries.
However, even if the NASDAQ has just made an enduring low sentiment has
been damaged to the extent that the tech and internet stocks will not be
the primary focus of speculation over the next few years. Partly due to
the absurd under-valuation of commodity prices relative to almost everything
else in the world, partly due to the evidence that secular trends may be
in the process of changing, and partly due to the fact that the stocks
of commodity-producing companies had been performing quite well prior to
the general stock market panic of the past several weeks, we think the
main focus of speculation/investment over the next few years will be on
commodities and commodity-producing companies.
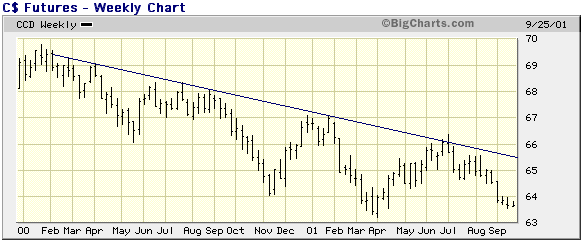
The short-term
Below are charts of the Australian
Dollar and the Canadian Dollar, the two major commodity currencies (so
called because the economies of Australia and Canada are heavily reliant
on the export of commodities). The A$ had broken above its 20-month downtrend
at the beginning of August and looked to be completing a normal pullback
prior to the events of September-11. However, the A$ plunged with the US
stock market last week due to a panic away from risk and a 'ramping
down' of economic growth expectations. The C$ was weak prior to the terrorist
attacks and has, over the past 3 months, appeared to be suffering from
guilt by association (it is the only major currency that has not benefited
from the downward reversal in the US$ and has, instead, fallen with
the US$ against the other major currencies).
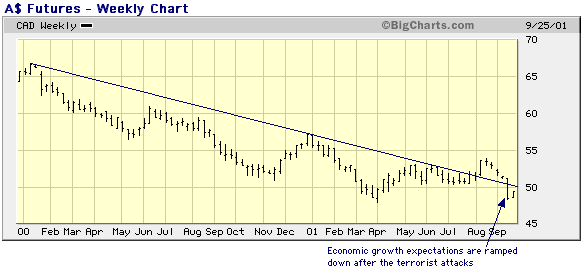
Recent events may have only temporarily
pushed the A$ off its trend, in which case we should soon see a snap-back
to pre-panic levels (around $0.53). However, a drop to new lows by the
A$ would suggest that an upturn in the CRB Index is still at least a few
months away.
Although we don't plan on turning short-term
bullish on commodities until we see a sustained upward reversal in the
A$ and the C$, we don't think our previous forecast for a September
bottom in the CRB Index will be far off the mark. The events of Sep-11
have caused global growth expectations to be revised downward and probably
delayed the CRB's bottom by 2-3 months, but the actions of central banks
in the wake of these terrible events are going to give commodity prices
a shot in the arm. As such, the CRB Index will now hit a lower level than
it would have in the absence of the attacks, but the eventual upturn will
most likely be sharper.
On a related matter the recent plunge
in energy prices, assuming there is no immediate bounce-back, will suppress
the PPI and the CPI over the next few months. This could potentially be
positive for commodity prices in general and gold in particular by creating
an environment in which the Fed will not feel pressured to deviate from
its 'easy money' policy. In other words, the longer the effects
of inflation remain hidden from view the more profligate the Fed will be
and hence the greater the eventual price increases will be.
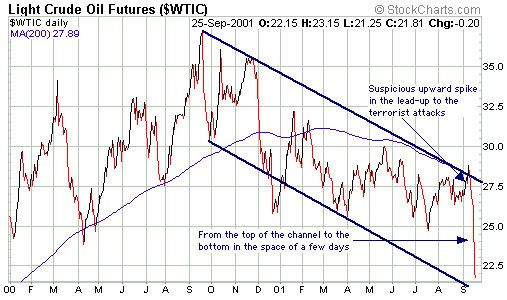
Oil and oil stocks
We were short-term bearish on oil between
late-May and late-July, but canceled that view in late-July after the oil
price spiked below $25. Since that time we have been neutral, expecting
the oil price to range-trade between $25 and $28. Prior to the terrorist
attacks and the suspicious trading in oil futures in the days leading up
to the attacks, oil appeared to be headed back to the lower end of our
expected range. However, over the past 2 weeks the oil price has spiked
above the top-end and well below the bottom-end of this range and currently
sits at around $22. The following chart suggests that there won't be much
additional downside in the short-term (the oil price bounced off the channel
bottom on Wednesday). Longer-term we are bullish on oil, although barring
disruptions to oil supply as a result of military conflict in the Middle
East we expect to see the oil price under-perform the prices of most other
commodities over the next 6 months.
The following paragraph from the Jul-18
Interim Update is just as applicable now as it was then:
"As big a hit as oil and oil stocks
have taken over the past 2 months, gold and gold stocks are MUCH more attractive
(from both an investment and a 'long side' trading perspective) than oil
and oil stocks at the current time. The reasons are: a) relative valuation,
b) the oil price is sensitive to global economic growth (although we expect
an economic recovery to begin over the next few months, this dependence
on economic growth is a risk), and c) the SF and the euro have broken out
to the upside (the precursor to a gold rally)."
Oil stocks began to break down in May,
at the same time that most oil companies were reporting blow-out earnings
and the vast majority of analysts were recommending the purchase of shares
in oil companies. Based on the earnings that were being reported at that
time, the P/E ratios of the oil companies appeared to be low despite the
preceding run-ups in their stock prices. However, there are few things
less relevant to a company's stock price than its current P/E ratio.
The market is constantly trying to adjust stock prices based on expected
future earnings, and in the case of oil stocks the market was once
again prescient.
Resource stocks
Below is a chart of MIM Holdings (ASX:
MIM), a diversified Australian mining company with major exposure to copper
and coal. This chart illustrates one of the difficulties of investing in
the stocks of commodity-producing companies in that the MIM stock price
doubled during the second quarter of 1999 while the CRB Index was still
bottoming. By the time the CRB Index turned higher in July of 1999, the
best percentage gains in the MIM stock price had already occurred.
The stock price of Freeport McMoran Copper and Gold (NYSE: FCX) behaved
similarly to MIM in 1999.
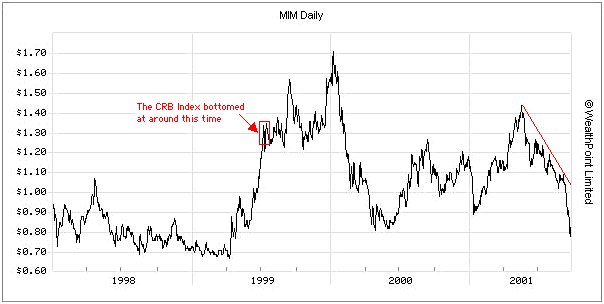
The best time to buy resource stocks
is often about 3 months prior to an upturn in commodity prices.
Below is a chart of North American
copper producer Phelps Dodge (NYSE: PD). The PD stock price has recently
taken an even more spectacular dive than the MIM stock price.
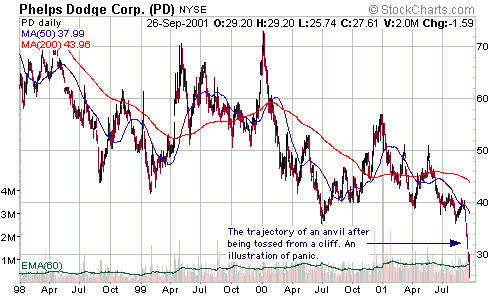
The recent behaviour of the stock prices
of the commodity producers suggests that a sustained upturn in the CRB
Index is at least 2-3 months away. However, if we are right about the effects
of the massive inflation that continues to occur in the US and throughout
the world, the next cyclical bull market in commodities is really going
to be something. Furthermore, the stock market will begin to discount this
bull market well before there is any definitive evidence that a bull market
is in the offing. As such, we suggest that investors begin to build
a position in some of these commodity-producers now. We will immediately
add MIM to the Portfolio.
Summary
We are probably still 2-3 months away
from a bottom in the CRB Index. If the A$ drops to a new low over the next
few weeks then the final bottom in the CRB Index may even be delayed to
the first quarter of next year. We think a reasonable approach for longer-term
investors is to start building positions in the stocks of large commodity-producers
now with the aim of averaging-in over the next few months.
The US
Stock Market
Current Market Situation
There is very little to add to the
analysis that was presented in the latest WMU. The stock market made a
panic low last Friday morning and the most likely course of events is that
the panic low will be tested at some point during the next few weeks.
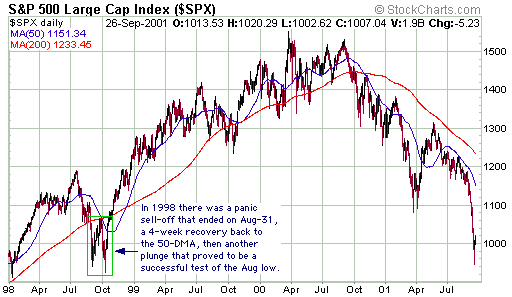
Below is a chart of the S&P500
Index since the beginning of 1998. During 1998's stock market catharsis
the market's recovery following its Aug-31 panic low lasted about 4 weeks,
after which a plunge back to the August lows occurred. This year's test
of the low, assuming we do get a test (there are no guarantees), could
happen at any time between now and the end of October. Note that the Japanese
stock market, which has led the US market throughout much of this year,
has not yet made a definitive upward reversal. This supports the idea that
there will be a test of last week's lows.
We purchased an initial position in
QQQ (NASDAQ100 Trust) shares on Tuesday and plan to add a second position
after we see some evidence that the bottom is in. What we have at this
stage is a market where fear has reached a level that has, in the past,
only ever occurred near major (multi-year) lows.
Gold and
the Dollar
Current Market Situation
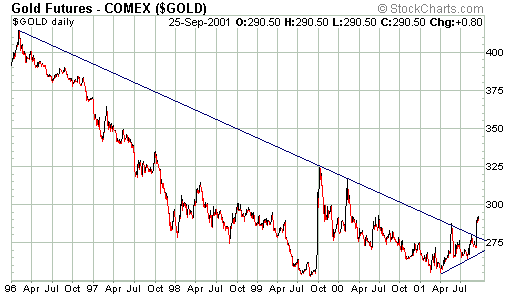
When we look at the following chart
we keep thinking we must be missing something. It seems blatantly obvious
that the 5-year downtrend has been decisively broken, the gold price is
in a short-term up-trend and a move well above $300 over the next few weeks
is a formality. However, if this is all true then why has there been only
minimal speculation in the stocks of gold mining companies? We don't have
an answer to that, but suspect that a daily close above $300 will be enough
to cause panic buying of gold stocks.
The following extract from the latest
WMU is still applicable: "If the gold price does spike sharply higher
over the coming week then we would take the opportunity to harvest some
profits. Otherwise, we will continue to hold as long as the trend remains
bullish. New buying should only be done during periods of price weakness."
By the way, a sharp spike higher would be a move of at least $25 over the
space of 1-3 days.
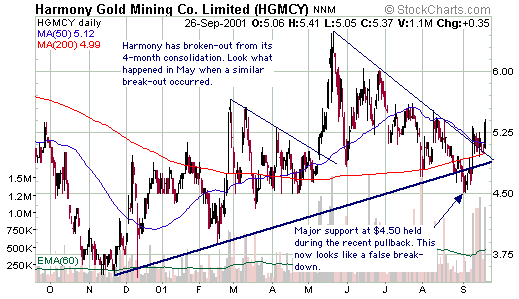
Harmony Gold Mining, which along with
Anglogold and Gold Fields Ltd has recently been a laggard, has broken out
to the upside and looks to be headed much higher.
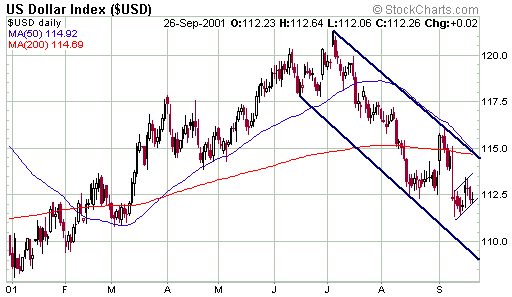
The below chart shows that the Dollar
Index has edged higher over the past week within the confines of its multi-month
downtrend. The Dollar's recent recovery has been weak, suggesting that
another downward spike could soon be seen despite the lopsidedly-bullish
(for the Dollar) traders' commitments. At some point during the next 5
weeks, possibly in parallel with the stock market dropping to test last
week's low, we expect the Dollar Index to fall to 108 or lower.
Changes
to the TSI Portfolio
QQQ purchased at US$29.00 on Sep-25
and MIM purchased at A$0.85 on Sep-27.

|
