![]()
![]()
![]()
![]()
- Interim Update 26th December 2018
Copyright
Reminder
The commentaries that appear at TSI
may not be distributed, in full or in part, without our written permission.
In particular, please note that the posting of extracts from TSI commentaries
at other web sites or providing links to TSI commentaries at other web
sites (for example, at discussion boards) without our written permission
is prohibited.
We reserve the right to immediately
terminate the subscription of any TSI subscriber who distributes the TSI
commentaries without our written permission.
TSI Holiday Season
Schedule Reminder
- The Weekly Update that
would have been posted on Sunday 30th December (as per the normal
publishing schedule) will instead be posted on Tuesday 1st January. This
will allow us to incorporate the yearly closing prices into our
discussion/analysis.
- There will be no Interim Update on Thursday
3rd January.
- The normal TSI publishing schedule will resume with
the Weekly Update on Sunday 6th January.
The Lithium
Market
Monitoring the price of lithium
is not easy, because there is no lithium contract on the LME or any major
futures market. In other words, there is no benchmark. Instead, prices are
negotiated between producers and consumers on a case by case basis.
Further complicating matters is that the commonly-traded lithium comes in
two forms with different prices. There is Lithium Carbonate and Lithium
Hydroxide. A consequence is that information on lithium pricing often must
be obtained from the large producers or users of the commodity*.
Most lithium carbonate comes from lithium-containing brines, known as
salars, in Argentina and Chile. Salar brines are underground reservoirs
that contain high concentrations of dissolved salts (including lithium)
and generally are found below the surfaces of dried lakebeds. As explained
HERE,
to extract lithium from brines the salt-rich waters must first be pumped
to the surface into a series of evaporation ponds where solar evaporation
occurs over a number of months. When the lithium chloride in the
evaporation ponds reaches an optimum concentration, the solution is pumped
to a recovery plant where extraction and filtering remove any unwanted
boron or magnesium. It is then treated with sodium carbonate (soda ash),
thereby precipitating lithium carbonate. The lithium carbonate is
filtered, dried, and ready for delivery.
Lithium hydroxide, on the
other hand, is mostly extracted from spodumene and other minerals via
hard-rock mining processes.
The cost of producing lithium carbonate
from salars is generally much lower than the cost of producing lithium
hydroxide from hard-rock mines. However, the carbonate usually requires
further processing to make it suitable for batteries, whereas the
hydroxide can be directly used in batteries. Considering that batteries
for electric vehicles (EVs) should be the most important source of future
demand growth, this potentially gives the producers of the hydroxide a big
advantage.
Putting some numbers to the aforementioned advantage, a
30th November
article at mining.com notes:
"UK-based consultants Roskill
predicts annual growth of nearly 39% through 2031 for hydroxide compared
to 13% CAGR for lithium carbonate.
Total consumption of hydroxide
is expected to rise four-fold versus carbonate, with demand climbing to
1,605,500 tonnes and 460,100 tonnes respectively by 2031."
We
suspect that most consultants are greatly underestimating the rate at
which the production of EVs, and therefore the demand for lithium, will
grow over the next 7 years. As a consequence, the demand-growth advantage
of hydroxide is probably even greater than suggested by Roskill.
Even with much faster EV adoption than currently envisaged by most
analysts there shouldn't be a sustained shortage of lithium at any time.
The reason is that the lithium-mining industry is capable of ramping-up
supply in response to a rising price. For example, the steep upward trend
in the lithium price from Q1-2016 to Q1-2018 prompted a supply response
that led to a substantial price correction over the past three quarters.
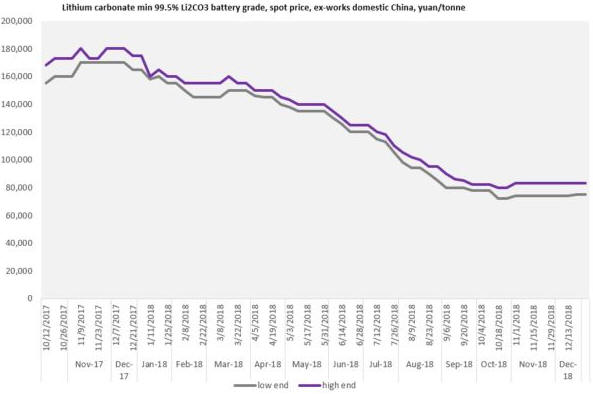
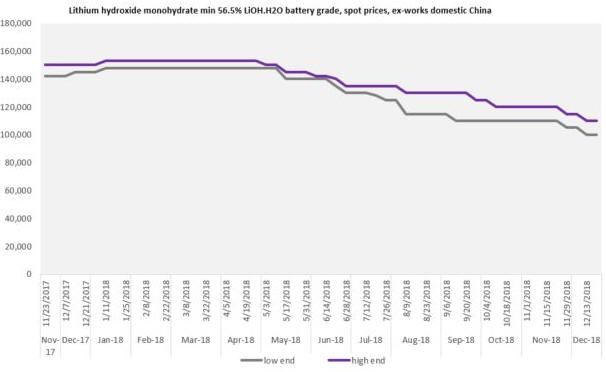
The price correction is illustrated by the following charts from
https://www.metalbulletin.com/lithium-prices-update, the first of
which shows the price of lithium carbonate (ex-works China) in yuan/tonne
and the second of which shows the price of lithium hydroxide (ex-works
China) in yuan/tonne.
Notice that the hydroxide price has held up
much better than the carbonate price. Specifically, notice that the low
end of the carbonate price range has moved from a 2018 peak of about
180,000 yuan/tonne (US$25,700/tonne) to 75,000 yuan/tonne
(US$10,700/tonne), while the low end of the hydroxide range has moved from
a 2018 peak of 155,000 yuan/tonne (US$22,100/tonne) to 100,000 yuan/tonne
(US$14,300/tonne). That is, hydroxide has gone from a 14% discount to a
33% premium.
Due to the demand-growth advantage of hydroxide over
carbonate it's a good bet that the hydroxide premium will continue to
increase, although the premium is limited by the fact that at some point
it would become more economical to convert lithium carbonate into a form
suitable for use in EV batteries than to purchase the battery-ready
lithium hydroxide.
Nothing is guaranteed and there is a risk that all the new investment
in lithium hydroxide production now happening in Australia will be more
than sufficient to cater for the coming increase in demand, but, as
mentioned above, we suspect that most forecasters are greatly
under-estimating the future EV-related demand for battery metals such as
lithium. We therefore like the idea of maintaining long-term exposure to
well-financed lithium hydroxide producers/developers such as Mineral
Resources (MIN.AX) and Kidman Resources (KDR.AX).
*For example, when Orocobre (ASX: ORE,TSX: ORL)
recently advised that its average selling price for lithium carbonate
was expected to be only US$10,800/tonne in Q4-2018, it was surprising new
information that caused a broad sell-off in lithium mining stocks.
The Stock Market
In the latest Weekly Update we
marveled at the extent to which the NASDAQ had become stretched to the
downside as measured by the number of individual NASDAQ stocks making new
12-month lows. We wrote:
"...on Thursday of last week...the
number of individual-stock new lows on the NASDAQ was a lot greater than
on any other day since the beginning of 1998 with the exception of during
the crescendo of the 2008 crisis and near the conclusion of the 1998
crisis."
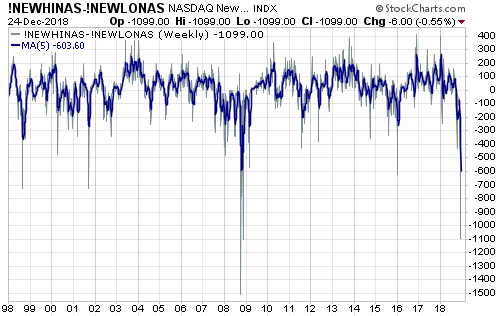
Well, the situation became even more extreme on
Monday 24th December. As indicated by the thick blue line on the following
chart, at the close of trading on 24th December the 5-week MA of NASDAQ
New Highs minus NASDAQ New Lows dropped slightly below the lowest level
reached during the 2008 panic. In other words, by this measure the NASDAQ
was more stretched to the downside early this week than it was at the
crescendo of the Global Financial Crisis.
Other indicators currently aren't as extreme as the one displayed on
the above chart. For example, although the VIX got as high as 36 on Monday
of this week (see chart below) we are yet to get the sort of VIX spike
that usually marks the conclusion of a steep 10%-20% drop in the SPX.
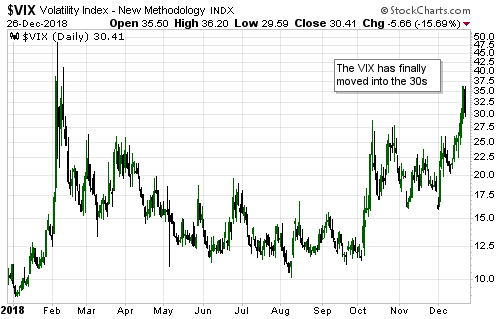
Putting the VIX aside, it's extraordinary that the market has become
so 'oversold' only three months from a major peak. Either we are into a
bear market that will turn out to be the worst since the 1930s or the
entire decline is going to be over much sooner than expected. Both
possibilities are realistic, but it would be prudent to assume the former
and act accordingly until proven otherwise.
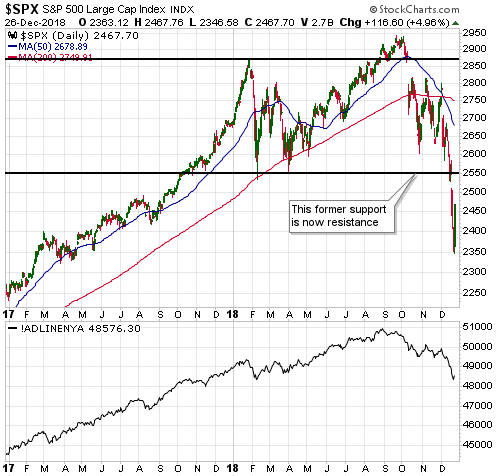
Turning to the price
action, volatility was extreme during the first two trading days of this
holiday-shortened week. The SPX plunged 2.7% to a new 12-month low on
Monday and then accomplished a spectacular 5% up-move on Wednesday.
Former intermediate-term support at 2500-2550 is now resistance and
probably will hold if tested over the next couple of weeks. This implies
that a lot of the near-term upside potential may have been exhausted on
Wednesday.
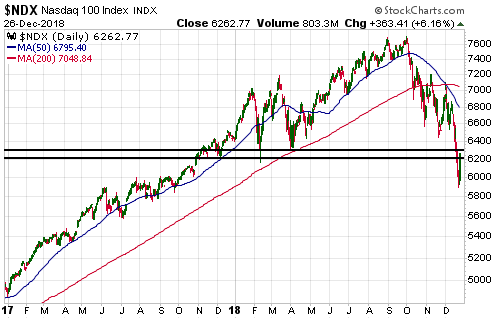
Thanks to a 6.2% surge on Wednesday, the NDX is already testing the
intermediate-term support (now resistance) that was breached last week.
In the discussion of the Oil Services ETF (OIH) in the latest Weekly
Update we wrote that the downward momentum extreme pointed to a 'W' bottom
rather than a 'V' bottom. A 'W' bottom would involve a low now/soon
followed by a rebound and then a test of the low during January or
February.
It's a similar story for the senior US stock indices.
Considering the extent to which these indices became 'oversold', 'V'
bottoms are less likely than 'W' bottoms. That is, assuming that at least
a 1-2 week bottom is now in place there should be a test of this week's
low prior to the start of a multi-month rally. That's regardless of
whether we are dealing with a new bear market or a substantial bull-market
correction.
Gold and the Dollar
Gold
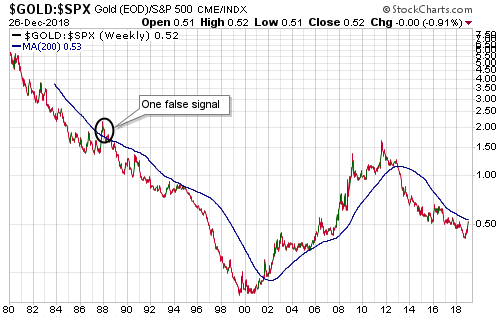
Gold and the S&P500 (SPX) are at opposite ends of an investment seesaw.
They sometimes trend upward together or downward together due to changes
in the primary measuring stick (the US$), but when one is in a long-term
bull market the other will be in a long-term bear market. Which is in a
bull market and which is in a bear market can be established by charting
one relative to the other.
Here is a weekly chart of the gold/SPX
ratio going back to 1980. Crosses above and below the blue line on this
chart (the 200-week MA) have a near perfect record of indicating, in a
timely manner (for investors, not short-term traders), transitions between
gold bull and gold bear, with just one false signal caused by the 1987
stock market crash.
The gold/SPX ratio is now very close to
generating a bear-to-bull signal for gold and, by extension, a
bull-to-bear signal for the US stock market.
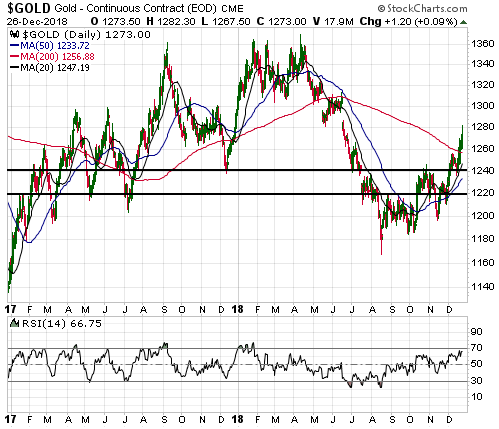
On Wednesday 26th December the US$ gold price rose to the $1280s in
response to fear of further weakness in the stock market. It then gave up
its gains as the stock market began to strengthen.
Although the
gold market is not 'overbought' and remains supported by constructive
sentiment and slightly-bullish fundamentals, Wednesday's market action
indicates that a 1-2 week top may be in place. However, the short-term
upward trend will be intact as long as the price doesn't close below
US$1240.
Taking into account sentiment, fundamentals, price action and the
expected performances of related markets (stocks, bonds and the US$), we
expect to see gold trading well into the $1300s during the first quarter
of 2019. However, as noted above we won't be surprised if there is a
multi-week correction/consolidation before significant additional gains
are made.
Silver
For the first time in many
months, silver's short-term chart pattern looks more bullish than gold's.
Of particular significance, on Wednesday 26th December the silver price
finally broke above resistance at $14.90 and sustained its breakout to
day's end. In doing so it appears to have completed a base.
Wednesday's breakout suggests that silver will trade up to at least the
$15.60s and possibly to $16.00 within the next few weeks.
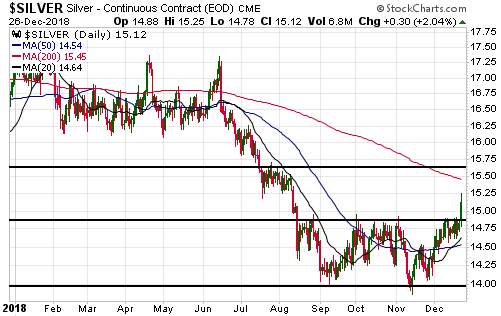
We recently added the SLV $14.00 call option with an 18th January 2019
expiry date to the TSI List. SLV is priced about $1 below silver bullion,
meaning that a quick move by the silver price to $15.60-$16.00 should
result in the SLV price rising to $14.60-$15.00. If this were to happen
prior to 18th January then our options would trade at $0.60-$1.00. As
previously advised, for TSI record purposes the option will be exited if
it trades at $0.60.
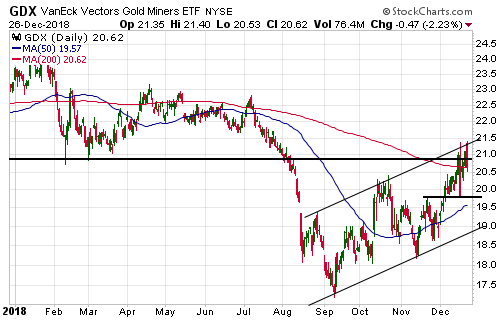
Gold Stocks
The Gold
Miners ETF (GDX) has lateral resistance at $21.00 and resistance at the
top of its short-term channel (currently near $21.40). The most important
nearby support is at $19.80.
On Wednesday of this week GDX did
something similar to what it did a week earlier, which is rise to its
channel top and then reverse course. The 26th December downward reversal
was not as pronounced as the 19th December downward reversal, though, and
GDX ended the day exactly at its 200-day MA.
GDX's poor performance
relative to gold bullion on Wednesday suggests that the downward reversal
from the channel top marked at least a 1-2 week high. However, the
gold-mining ETFs and indices stand a good chance of making significant
additional headway during the first quarter of next year.
Ideally,
GDX will hold above $19.80 during any near-term corrective activity.
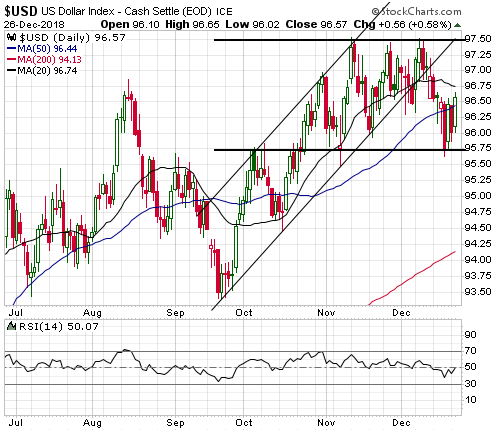
The Currency Market
The Dollar Index (DX)
still has to close below 95.75 to confirm a short-term top. If/when that
happens, the initial target will be 93.5.
Updates on Stock Selections
Notes: 1) To review the complete list of current TSI stock selections, logon at
http://www.speculative-investor.com/new/market_logon.asp
and then click on "Stock Selections" in the menu. When at the Stock
Selections page, click on a stock's symbol to bring-up an archive of
our comments on the stock in question. 2) The Small Stock Watch List is
located at http://www.speculative-investor.com/new/smallstockwatch.html
Chart Sources
Charts appearing in today's commentary
are courtesy of:
https://stockcharts.com/
![]()