![]()
![]()
![]()
![]()
- Interim Update 27th February 2019
Copyright
Reminder
The commentaries that appear at TSI
may not be distributed, in full or in part, without our written permission.
In particular, please note that the posting of extracts from TSI commentaries
at other web sites or providing links to TSI commentaries at other web
sites (for example, at discussion boards) without our written permission
is prohibited.
We reserve the right to immediately
terminate the subscription of any TSI subscriber who distributes the TSI
commentaries without our written permission.
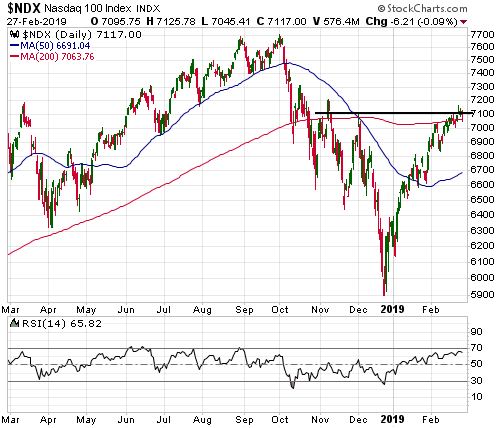
The Stock Market
Over the first three days of
this week the senior US stock indices moved sideways near important
resistance levels. For example, the following daily chart shows that the
NASDAQ100 Index (NDX) traded in a narrow range and closed at lateral
resistance on each of the past three days.
In effect, this means
that nothing happened. We are left expecting a sizable multi-week
correction followed by a rise to a new high for the year.
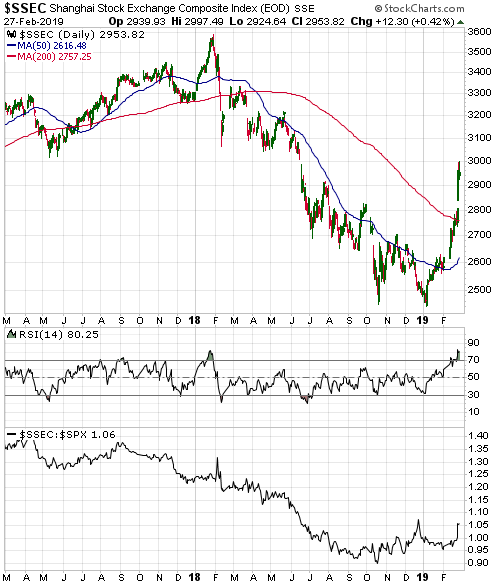
The US stock market has been quiet over the past month, but the same
cannot be said about China's stock market. The following daily chart shows
that the Shanghai Stock Exchange Composite Index (SSEC) is up by around
15% since the beginning of February, which constitutes a phenomenal 4-week
gain for such a large market. The chart also shows that the SSEC's daily
RSI is now as high as it was at the January-2018 peak and that the SSEC
has been outperforming the SPX since October-2018.
Part of the reason for the SSEC's rapid rebound is the widespread
anticipation of at least a temporary halt to the US-China 'trade war'.
It's a good bet that both Trump and Xi are eager to make a deal, the
former because he wants the stock market at new highs and the latter
because he wants to be able to focus on more important issues. Therefore,
a trade deal probably will be signed when the political leaders meet in
late-March. Another part of the reason for the SSEC's rapid rebound is the
general belief that the Chinese government wants a stronger stock market.
To explain the above sentence, China's stock market is dominated by
retail traders who buy or sell in response to cues from the government.
When a stronger stock market is desired, senior officials hint or state
outright that the market is too low. In response, the public buys. If it
turns out that talk is not enough by itself to set an upward trend in
motion, monetary conditions are loosened or regulations are changed in a
way that encourages share ownership. And when a weaker stock market is
desired, senior officials talk about the market being over-valued or
express concerns about excessive speculation. In response, the public
sells. If it turns out that talk is not enough by itself to dampen the
public's enthusiasm, monetary conditions are tightened or regulations are
changed in a way that discourages share ownership.
Due to the bad
experience of 2015, when stock-market speculation (gambling) got out of
hand and set the scene for a devastating crash, it's likely that Chinese
authorities will be quicker in the future than they were in the past to
throw cold water at rapidly-rising stock prices. Therefore, there is very
little chance of another roaring bull market in Chinese equities anytime
soon.
Our guess is that the SSEC will maintain an upward bias for
another 2-3 months and then begin the journey back to its 2018 low.
Gold and the Dollar
Gold
What is GLD's physical gold inventory telling
us?
An increase in the amount of gold bullion held by GLD
(the SPDR Gold Shares) and other bullion ETFs does not cause the gold
price to rise. The cause-effect works the other way around and in any case
the amount of gold that moves in/out of the ETFs is always trivial
compared to the metal's total trading volume. However, it is reasonable to
view the change in GLD's gold inventory as a sentiment indicator.
Ironically, an increase in the amount of physical gold held by GLD and the
other gold ETFs is indicative of increasing speculative demand for "paper
gold", not physical gold. As we've explained in the past (for example,
HERE), physical gold only ever gets added to GLD's inventory when the
price of a GLD share (a form of "paper gold") outperforms the price of
gold bullion. It happens as a result of an arbitrage trade that has the
effect of bringing GLD's market price back into line with its net asset
value (NAV). Furthermore, the greater the demand for paper claims to gold
(in the form of ETF shares) relative to physical gold, the greater the
quantity of physical gold that gets added to GLD's inventory to keep the
GLD price in line with its NAV.
Speculators in GLD shares and other
forms of "paper gold" (most notably gold futures) tend to become
increasingly optimistic as the price rises and increasingly pessimistic as
the price declines. That's the explanation for the positive correlation
between the gold price and GLD's physical gold inventory illustrated by
the following chart. That's also why intermediate-term trend reversals in
the GLD gold inventory tend to follow intermediate-term trend reversals in
the gold price. The thick vertical lines on the following chart mark the
intermediate-term trend reversals in the US$ gold price.
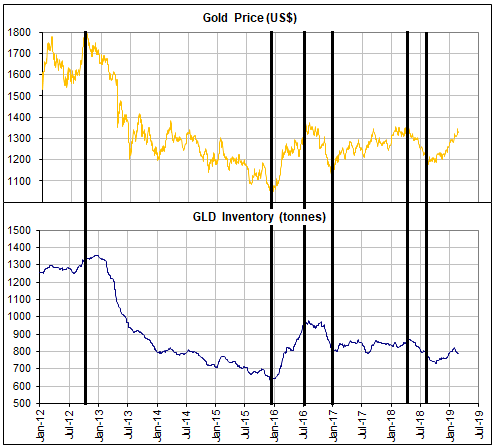
Interestingly, the increase in the GLD inventory that has occurred in
parallel with the latest upward trend in the gold price has been
relatively small. This suggests that the price rally has been driven more
by increasing demand for physical gold than by increasing demand for paper
gold.
In terms of influence on the gold price, speculative trading
of gold futures is vastly more important than speculative trading of GLD
shares. Therefore, assumptions about paper versus physical demand
shouldn't be based solely on the change in the GLD inventory. The
situation in the gold futures market also must be taken into account.
Determining the situation in the gold futures market has been made
difficult over the past two months by the lack of up-to-date COT data, but
the idea that the recent rally in the gold price has been driven primarily
by increasing physical demand is consistent with the gold futures Open
Interest (OI). At around 500K contracts, the current OI in Comex gold
futures is closer to a 3-year low than a 3-year high.
The upshot is
that the bulk of the increase in the gold price over the past few months
appears to be the result of increasing demand for physical gold as opposed
to increasing speculation in the 'paper' gold markets. Gold rallies
usually don't end until speculators in the 'paper' markets become
enthusiastically bullish, so at the moment we don't expect anything more
bearish than a routine short-term correction.
Current Market Situation
In the
latest Weekly Update, we wrote:
"...with the gold market being
short-term 'overbought', a routine correction could begin at any time. It
could have begun last Thursday [21st February] or it could begin after a
test, within the next week or two, of major resistance in the $1360s. Once
it does begin the most likely area for a correction low will be
$1250-$1280."
To put it another way, the gold price could drop
back to around $1250 within the next couple of weeks without signaling an
end to the rally that began last August.
At this time we still
don't know whether or not a routine correction has begun, although there
are two reasons to suspect that it has. First, the US$ gold price closed
slightly below its 20-day MA (the black line on the following chart) on
Wednesday 27th February, which is a minor bearish signal. Second, there is
a divergence between gold and the Yen (discussed below) that could have
near-term bearish implications for gold.
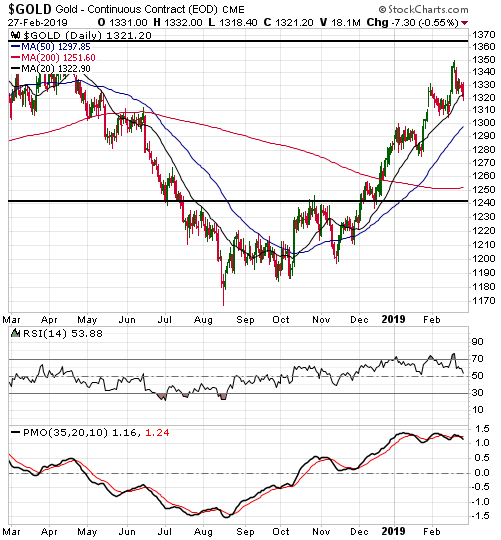
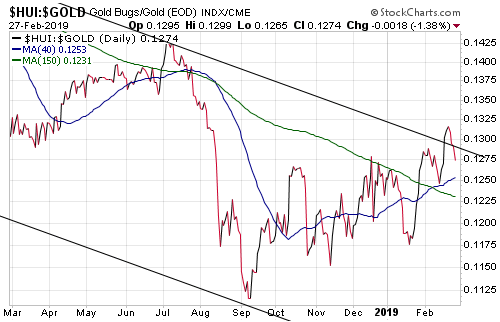
From our perspective, how gold performs relative to gold-mining stocks
is of greater importance right now than how gold performs in US$ terms. As
long as the HUI/gold ratio holds above its 40-day MA (the blue line on the
following chart) during any corrective activity over the weeks ahead, the
short-term outlook will remain bullish for both gold bullion and the
gold-mining sector.
Gold Stocks
The following daily chart of the
HUI shows that the gold-mining rally from the September-2018 low has been
'choppy'. A characteristic of the 'choppiness' is that pullbacks have
tended to retrace more of the preceding up-moves than would be the case in
a stronger or more consistent rally. This shouldn't have adversely
affected investors using a scale-in/scale-out approach, but it would have
made life difficult for short-term traders who mitigate risk using stops.
In a choppy advance or decline, prudently-selected stops will tend to get
hit shortly before the market reverses course.
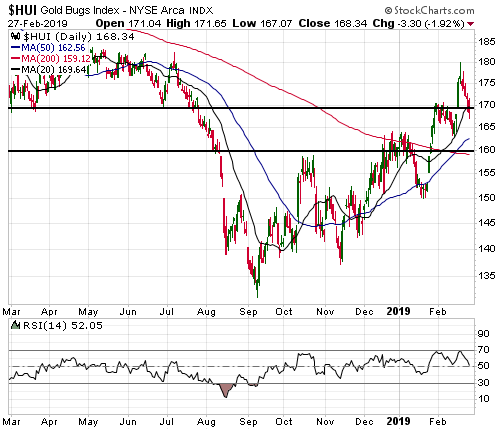
The gold-mining indices and ETFs cannot fall by much from their
current levels in nominal terms or relative to gold bullion without
invalidating the short-term bullish outlook. For risk management reasons,
this is good. It should mean that short-term traders who are 'long' the
gold-mining sector will be prompted to exit without experiencing
significant draw-downs. However, the way the sector has been performing
over the past several months it also could result in the exiting of long
positions just prior to the start of a 1-2 week price surge.
That's the reality of the current situation and many other situations that
arise in the financial markets. If you are a short-term trader either you
limit your potential loss to a small amount and run the risk of getting
stopped out at an inopportune time, or you run the risk of incurring a
large loss.
For the HUI and also for GDX, the upside breakout that
happened early last week opened up the possibility of a quick additional
gain of at least 10%. The pullback of the past few days hasn't eliminated
that possibility, although again we are seeing a pullback retrace more of
the preceding up-move than would be the case in a stronger or more
consistent trend.
The Currency Market
The
British Pound rose to a multi-month high in response to anticipation of a
softer or delayed Brexit. Other than that, nothing worth mentioning
happened in the currency market over the first three days of this week.
However, something worth mentioning has developed over the past several
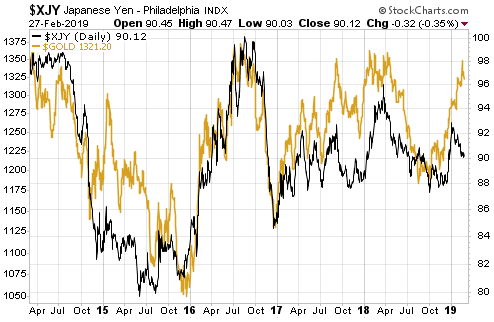
weeks. That something is a divergence between the Yen and gold.
For
many years the Yen has been the currency with the strongest correlation to
gold. The correlation is positive, meaning that the prices of gold and the
Yen have a strong tendency to trend in the same direction. Divergences
sometimes occur, but they tend to be short-lived.
In early January
the Yen and the US$ gold price were roughly where they should be relative
to each other, with both having rallied over the preceding three months.
However, the following chart shows that they subsequently went in opposite
directions, with the Yen moving downward while gold stayed on its upward
path.
It's not clear whether this divergence has short-term bearish
implications for gold or short-term bullish implications for the Yen, but
we view it as a reason to be circumspect regarding gold's near-term
prospects.
Updates on Stock Selections
Notes: 1) To review the complete list of current TSI stock selections, logon at
http://www.speculative-investor.com/new/market_logon.asp
and then click on "Stock Selections" in the menu. When at the Stock
Selections page, click on a stock's symbol to bring-up an archive of
our comments on the stock in question. 2) The Small Stock Watch List is
located at http://www.speculative-investor.com/new/smallstockwatch.html
![]() Osisko
Gold Royalties Warrants (TSX: OR.WT). Recent price: C$0.44
Osisko
Gold Royalties Warrants (TSX: OR.WT). Recent price: C$0.44
We added OR.WT to the TSI List last August. This is what we wrote at
that time:
"Osisko Gold Royalties (OR, OR.TO) is like a hedge
fund that invests in gold/silver royalties, gold/silver streaming deals
and junior gold/silver mining stocks. Its current market cap is around
C$1.9B, as is its book value.
We previously wrote that the OR
warrants (OR.WT on the TSX) would be added to the TSI List if they traded
at C$1.05. They traded at this price last week.
The warrants have
an exercise price of C$36.50, meaning that they are a very long way out of
the money (OR ended last week at C$11.92, which is close to the bottom of
its 3-year range). However, they don't expire until 18th February 2022, so
there is a lot of time for the sort of increase in the stock price that
would inject substantial value into the warrants."
Thanks to a
huge rally over the past 2.5 months, the OR stock price is now about 25%
higher than it was last August when we added the associated warrants to
the List. Refer to the first of the following charts for the details.
However, the second of the following charts shows that the warrant price
has not responded at all to the recent rally in the underlying stock.
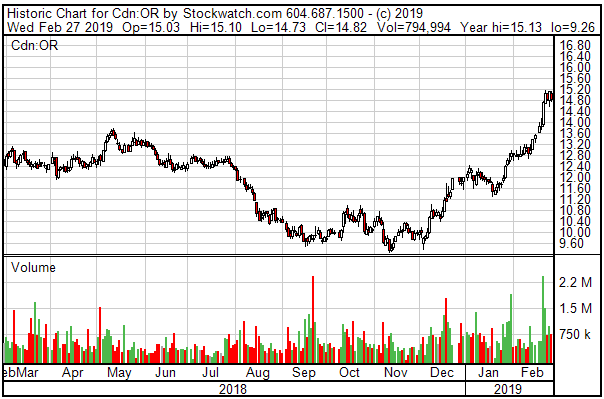
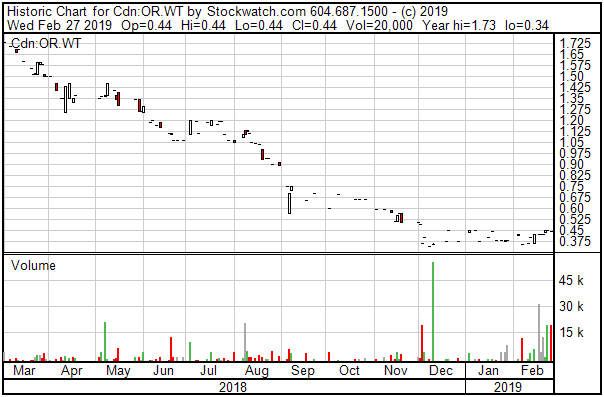
One reason for the dismal performance of the warrants is time decay.
The warrants are well out of the money and are now about 6 months closer
to expiry. However, the main reason is the inefficiency of the market.
It is common for illiquid stock warrants to trade a long way from fair
value. More often than not they are very over-valued, but occasionally
they become very under-valued. The OR warrants were slightly over-valued
when we wrote about them last August, but now they are very under-valued.
Depending on the assumed volatility of the underlying stock (OR), at the
current OR price of about C$15/share we calculate fair value for the
warrants to be C$0.60-C$0.90. That's why we are mentioning them today.
Chart Sources
Charts appearing in today's commentary
are courtesy of:
https://stockcharts.com/
https://www.stockwatch.com/
![]()