|
- Interim Update 27th April 2011
Copyright
Reminder
The commentaries that appear at TSI
may not be distributed, in full or in part, without our written permission.
In particular, please note that the posting of extracts from TSI commentaries
at other web sites or providing links to TSI commentaries at other web
sites (for example, at discussion boards) without our written permission
is prohibited.
We reserve the right to immediately
terminate the subscription of any TSI subscriber who distributes the TSI
commentaries without our written permission.
China about to dump US treasuries?
The article posted HERE
argues that China's government is about to dump about two-thirds of its
dollar-denominated reserves, thus "sending the world a message that US
debt is no longer a viable investment opportunity." According to the
article's author, the evidence that China's government will soon take
such a dramatic step comes in the form of recent statements from
Chinese public- and private-sector sources. For example, the article
includes the following quote from the Xinhua news service: "Xia
Bin, a member of the monetary policy committee of the central bank,
said on Tuesday that 1 trillion U.S. dollars would be sufficient
[China's total foreign currency reserve is presently worth about 3
trillion US dollars]. He added that China should invest its foreign
exchange reserves more strategically, using them to acquire resources
and technology needed for the real economy."
It's a good bet that China's government will eventually sell down its
foreign currency reserves, but we see no evidence that it is about to
do so. Unless China's monetary officials have been taking stupid pills,
the statements recently reported in the press certainly don't
constitute such evidence. Think of it this way: if you were the world's
largest holder of a particular investment and you planned to reduce
your stake, would you publicise your plan and thus enable all other
holders to 'front run' you? Of course you wouldn't! As we've mentioned
in the past, we never cease to be amazed that people who rationally
treat official US statistics and proclamations with great scepticism,
irrationally accept the propaganda emanating from China.
Our interpretation, which could be wrong but has the advantage of being
based on the assumption that Chinese officialdom isn't acting counter
to its own interests, is that China's government has no intention of
reducing its US treasury holdings in the near future. Rather, China's
governing class is becoming increasingly concerned about the inflation
problem (rapidly rising prices in China for real estate and the basic
necessities of life) that has stemmed from its own manipulations of the
currency and credit markets, and wants to tighten monetary conditions
gradually -- to reduce the inflation threat -- without creating major
problems for its exporting industries. This would be very difficult to
do regardless of what the US Federal Reserve were doing, but is being
made even more difficult by the Fed's ultra-accommodative monetary
stance. To put it in a nutshell, we get the impression that China's
policy-makers are wrestling with the dilemma that it is extremely
difficult, and perhaps impossible, to effectively combat an inflation
problem whilst maintaining a peg to a depreciating currency. Part of
the perceived solution to this dilemma appears to involve "jawboning"
with the aim of pushing the Fed towards a less-accommodative monetary
stance.
If we are right about what is motivating the public pronouncements of
Chinese officialdom, then China won't be making a significant reduction
to its treasury holdings anytime soon. Doing so without first
eliminating the currency peg would only add to the inflation problem
(the biggest single concern of China's policy-makers at this time), the
reason being that the dumping of treasuries would prompt more debt
monetisation by the Fed (the Fed would very likely act to prevent
T-Bond yields from rising in response to China's selling). And the
elimination of the currency peg does not appear to be a realistic
short-term prospect because China's policy-makers labour under the
wrongheaded theory that a relatively weak currency helps the economy by
promoting exports. This theory is false because a relatively weak
currency only helps the exporting sector at the expense of the rest of
the economy (artificial currency weakness brings about a forced wealth
transfer from one part of the economy to another), and at some point
the currency weakness even stops providing a net benefit to the
exporting sector due to rapidly rising prices for labour and raw
materials.
Bernanke gives inflation trade the 'green light'
The
Fed announced on Wednesday that "QE2" would end as planned in June. At
the same time, the FOMC Statement reiterated that the official
overnight interest rate would be kept near zero for an "extended
period" and that "measures of underlying inflation continue to be
somewhat low". That's right -- apparently there still isn't enough
"inflation". Also, in a post-FOMC-meeting press conference Bernanke
said that he was unconcerned about inflation and that the Fed would
maintain its balance sheet at the elevated level resulting from its QE
programs by re-investing the principal and interest payments it
receives from its mortgage-backed securities.
Naturally, stock and commodity bulls were emboldened, as were US$ bears.
The Stock Market
The
S&P500 Index pulled back to support in mid April and then reversed
upward. Over the past two trading days it has broken out to the upside.
A daily close below the bottom of the channel drawn on the following
chart would now be clear-cut evidence of a downward trend reversal.
The recent price
action indicates that the broad stock market will probably maintain an
upward bias for at least a few more weeks. However, seasonal forces
become less supportive after next week and a potentially significant
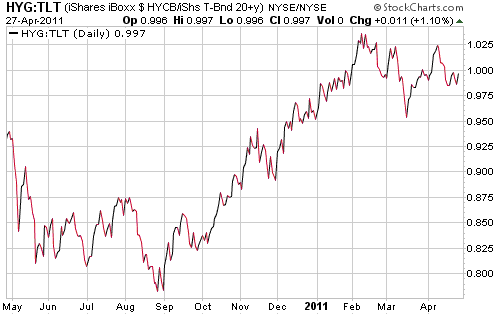
bearish divergence is developing between the stock market (as
represented by the S&P500) and credit spreads (as represented by
the HYG/TLT ratio). We are referring to the fact that the S&P500
has just moved to a new 52-week high, whereas the following chart shows
that the HYG/TLT ratio remains comfortably below its February peak.
It will be interesting to see if this divergence continues to build over the weeks ahead.

Gold and
the Dollar
Gold and Silver
Gold versus silver and other commodities
There's an old saying to the effect that the public will believe almost
any bullish story as long as the price is rising. For example, as a
result of the spectacular rise in the prices of tech and internet
shares during the late 1990s, the investing public came to believe that
traditional valuation metrics did not apply to these shares and that
technology-driven increases in productivity would cause seemingly-crazy
valuations to become even crazier over the decade ahead. For another
example, when the oil price went parabolic during the final few months
of 2007 and the first six months of 2008, the public got caught-up in
the idea that the world was running out of oil even though the
spectacular price rise was accompanied by an increase in oil supply
relative to commercial demand. For a third example, one of the bullish
stories that has recently been embraced in response to silver's massive
price advance is that silver is all but guaranteed to make additional
large price gains relative to gold because the world's aboveground
silver supply is less than the world's aboveground gold supply.
As discussed in a very sensible article by Bob Moriarty at http://www.321gold.com/editorials/moriarty/moriarty042511.html,
the assertion that the supply of silver is less than the supply of gold
is probably way off the mark. In any case, arguing for silver over gold
on the basis of the relative aboveground supplies of the two metals
and/or the relative rarities of these metals in the ground, misses the
point.
Although there is probably a lot more aboveground silver in the world
than gold, there is almost certainly a lot more aboveground gold in
readily saleable form (bars, coins, 24-carat jewellery held for
store-of-value purposes) than there is silver in similar form. In fact,
there is a lot more gold in readily saleable form than there is any
other commodity. So, if it's correct to argue that silver should
continue rising against gold because there is less aboveground silver
than gold in the world, then it is also correct to argue that every
commodity known to man should rise against gold.
The aboveground supply of gold in readily saleable form is, today,
vastly greater than the aboveground supply of any other commodity. This
was also the case 10 years ago, and 20 years ago, and 30 years ago, and
40 years ago, etc. And yet, gold is the only major commodity to rise in
price during each of the past 10 years, and, as evidenced by the
performance of the gold/CRB ratio, gold has been in a very long-term
upward trend against commodities in general since 1971. It is obvious,
then, that there is a fatal flaw in the argument that gold should
perform worse than other commodities due to its vastly greater
aboveground supply.
To understand why gold's relatively large aboveground supply is not a
negative you need to understand that there are certain characteristics
a commodity must have in order to be highly successful in the role of
money. Throughout much of recorded history both gold and silver
possessed all of these characteristics, but there is now one important
characteristic that gold possesses and silver does not. We are
referring to the requirement that the amount of the commodity used in
industrial/commercial applications be trivial compared to the amount of
the commodity used as money (the general medium of exchange). This is
to prevent large changes in industrial/commercial demand from causing
large changes in money purchasing power.
Now, we aren't arguing that gold is money today (it isn't). Nor are we
arguing that silver will not out-perform gold over the course of the
long-term bull market that encompasses both gold and silver (we have
always maintained that silver's reward potential was greater than
gold's, but that the additional reward potential was offset by greater
risk). What we are arguing is that gold is now a long way ahead of any
other commodity (including silver) in terms of ability to fulfill the
monetary role, an implication of which is that gold will very likely
continue to out-perform silver by a wide margin during those periods
when there is a surge in the demand for the safety/liquidity of "money"
(2001-2003 and 2008, for example) and under-perform silver during those
periods when there is a general shift towards riskier ventures.
Current Market Situation
Market Vane's survey indicates that on Monday 25th April, 97% of
traders were bullish on silver. This is the sort of sentiment extreme
that usually only occurs in the vicinity of a very important top. It
doesn't mean that an important top is already in place, but it strongly
suggests that traders and investors should approach the silver market
very cautiously.
Both silver and the silver/gold ratio are in parabolic blow-off mode.
As mentioned in our 24th April market update, we can be confident about
HOW these parabolic advances will end (they will end in spectacular
declines), but we can't be confident about WHEN they will end.
Our guess is that the blow-offs will end by the middle of next month.
This guess is consistent with the marked increase in volatility that
has occurred over the past three trading days, because the price action
tends to encompass greater swings as an important top is approached.
However, there is no evidence, yet, that a top is in place. In
particular, we note that on a daily closing basis the silver/gold ratio
made a new high for the move on Wednesday 27th April, meaning that as
at the close of trading on Wednesday the short-term trend was still
heading upward.
Gold is not stretched to the upside, but it is still likely to reach an
intermediate-term peak of its own within three weeks of a peak in the
silver market.
To hedge our exposure to precious-metals-related investments, we are
continuing to accumulate SLV July put options in response to surges in
the silver price. This put-option position can be likened to fire
insurance that we pay for gradually over time as the risk of fire
increases. If a fire doesn't happen then we will incur a loss equal to
the insurance premium, but in the mean time we will have gained peace
of mind.
The following chart from the excellent Sharelynx.com
web site shows gold relative to the CRB Index since 1970. The chart
shows that the current situation is nothing like late-1979, but that it
could be akin to late-1976. During 1975-1976 the US economy rebounded
following the inflation scare and recession of 1973-1974. Confidence
rose, but the policies of the government and the Fed did not permit a
sustained turnaround (the same mistakes continued to be made, largely
because the causes of the 1973-1974 crisis were misdiagnosed). After
the economic rebound ran its course, gold embarked on a huge multi-year
rally in REAL terms (that is, it achieved huge gains relative to other
commodities as well as relative to the US$).

Gold Stocks
The gold sector pulled back during the first two days of this week and
then reversed upward on "Fed day". Gold bullion and the major gold
stocks had already gained some ground prior to the Fed news, but became
more buoyant after the Fed made it clear that US monetary policy would
remain accommodative for the foreseeable future.
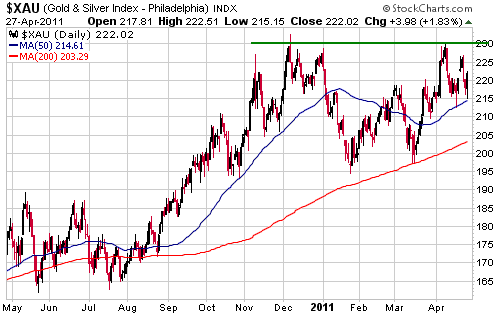
The following daily chart shows that the XAU reversed upward on
Wednesday from the vicinity of its 50-day moving average. This leaves
open the possibility that a break to new highs will soon occur,
although time is running out in that 'seasonality' turns bearish during
the second half of May and silver appears to be in the final stage of
its rally. Furthermore, Wednesday's price action did nothing to
alleviate the bearish divergence between gold equities and gold bullion.
If the XAU manages to break above resistance at 230, the measured
objective -- based on the depth of the 5-month consolidation -- would
be 265. The corresponding measured objective for the HUI would be
around 700.

If we are lucky
enough to get a break to new highs and some follow-through to the
upside in the gold-stock indices over the next couple of weeks, we will
view it as a final opportunity to do some selling prior to a
multi-month correction.
Currency Market Update
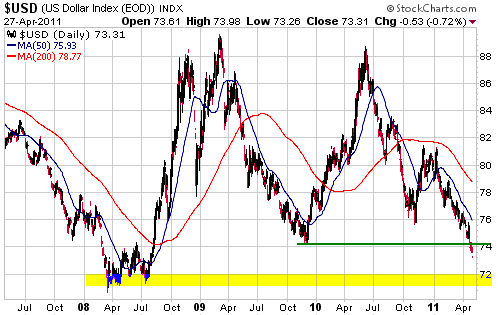
As illustrated by the following daily chart, the Dollar Index has
broken below support defined by its November-2009 low. This leaves the
2008 low as the only remaining chart-related support, in that a move
below this support would put the Dollar Index at an all-time low.

With Bernanke at the
helm of the Fed and appearing to be oblivious to the damage being done
to the US economy via policies designed to cause the US$ to weaken
relative to almost everything, it is difficult to imagine how the
Dollar Index could ever turn around and begin trending upward. However,
the financial markets are always attempting to discount the future,
which means that the currency market has already made an attempt to
discount the future effects of the Fed's current monetary stance. The
main risk, for anyone net-long the US$, is that the Fed will become
even more profligate over the months/quarters ahead. This is a very
real risk due to the current Fed chairman's breathtaking ignorance.
Our view is that the strength in the stock market, the strength in
silver relative to gold and the weakness in the US$ are linked. We
therefore expect that intermediate-term reversals in the Dollar Index,
the silver/gold ratio and the broad stock market will occur within
about one month of each other. We also expect that the first of these
reversals will occur by mid May, despite the 'best' efforts of the Fed.
The reason is that sentiment and momentum have reached the sorts of
extremes that almost always lead to such reversals.
Update
on Stock Selections
(Notes: 1) To review the complete list of current TSI stock selections, logon at http://www.speculative-investor.com/new/market_logon.asp
and then click on "Stock Selections" in the menu. When at the Stock
Selections page, click on a stock's symbol to bring-up an archive of
our comments on the stock in question. 2) The Small Stock Watch List is
located at http://www.speculative-investor.com/new/smallstockwatch.html)
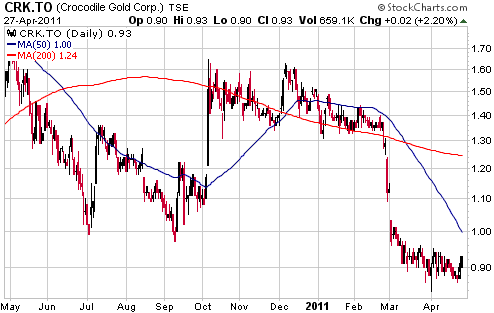
 Crocodile Gold (TSX: CRK). Shares: 321M issued, 400M fully diluted. Recent price: C$0.93 Crocodile Gold (TSX: CRK). Shares: 321M issued, 400M fully diluted. Recent price: C$0.93
CRK, a junior gold producer with operations in Australia's Northern
Territory, announced a resource update on Tuesday. As far as we can
tell, this week's resource update consolidated the increases/changes
that had been reported in earlier press releases. It therefore didn't
result in any change to our valuation for the stock.
CRK's in-ground resources are very lowly valued. In fact, the resources
are being valued by the market as if they belonged to an
exploration-stage company rather than a current producer. The reason
for the low valuation is the combination of an earlier failure to
achieve a production forecast and two poorly-timed equity financings
(especially the large financing arranged at the beginning of March).
Increased production is the key to a substantial gain in the stock's
valuation. Almost regardless of what the company reports in terms of
resource upgrades and drilling results, we suspect that the stock price
will have trouble surmounting resistance at C$1.00-C$1.15 until the
company reports improved production results or the market starts to
believe that production will increase as planned. As noted in an
earlier write-up, this could mean that the stock will be 'dead money'
until at least September.

 Candidates for new buying Candidates for new buying
Strangely, although gold and silver bullion are probably close to
intermediate-term peaks we are finding it easier to identify buying
opportunities than to identify selling opportunities within the ranks
of the associated mining equities. The four gold stocks we mentioned in
our 19th April update (GSS, CFO.V, PVG.TO, and RSG.AX) are still
suitable for new buying, as is JAG following this week's pullback to
the mid-US$5 area. We suspect that these stocks will hold up well
during the next intermediate-term correction in the bullion markets.
Chart Sources
Charts appearing in today's commentary
are courtesy of:
http://stockcharts.com/index.html

|

