![]()
![]()
![]()
![]()
- Interim Update 27th April 2016
Copyright
Reminder
The commentaries that appear at TSI
may not be distributed, in full or in part, without our written permission.
In particular, please note that the posting of extracts from TSI commentaries
at other web sites or providing links to TSI commentaries at other web
sites (for example, at discussion boards) without our written permission
is prohibited.
We reserve the right to immediately
terminate the subscription of any TSI subscriber who distributes the TSI
commentaries without our written permission.
The reaction to the Fed
The Fed handed down its latest
words of wisdom at the conclusion of the FOMC Meeting on Wednesday 27th April.
The latest FOMC announcement was almost the same as the preceding one, which
wasn't the least bit surprising. As expected by almost everyone, no action was
taken on the interest-rate front and no clear signals were given as to when
future action would likely happen.
Even taking into account the lack of new information in the latest FOMC
announcement, the market reaction was remarkably muted. Of particular relevance
and as illustrated below, there was a very small up-tick in the price of the
December-2016 Fed Funds Futures contract on Wednesday. This represents a change
of only 4 basis points (0.04%) in the expected year-end level of the Fed Funds
rate.
The 'market' currently expects that there will be just one Fed rate hike in 2016
and that it will happen during the second half of the year.
China's 'brilliant'
central planners are at it again
Last week we cited the rapid
increase over the past several months in China's monetary inflation rate as
evidence that China's government had effectively 'thrown in the towel' on
economic stability and had returned to its strategy of promoting new
credit-fueled mal-investment in an effort to mask the adverse effects of
previous credit-fueled mal-investment. The efforts by China's central planners
to reverse the country's slow-motion economic train-wreck have predictably not
led to real progress, but these efforts have succeeded in rejuvenating
debt-fueled speculation in the property markets of some Chinese cities.
According to an
article in the Telegraph early this week:
"China's reflation drive has been explosive. New home sales jumped 64pc in
March from a year earlier. House prices have risen 28pc in Beijing, 30pc in
Shanghai, and 63pc in the commercial hub of Shenzhen. The rush to buy has spread
to the Tier 2 cities such as Hefei - up 9pc in a single month.
"The housing market is on fire," said Wei Yao, from Societe Generale. "In the
first quarter, increases in total credit exploded to 7.5 trilion yuan, up 58pc
year-on-year. There is no bigger policy lever than this kind of credit
injection."
"This looks like an old-styled credit-backed investment-driven recovery, which
bears an uncanny resemblance to the beginning of the "four trillion stimulus"
package in 2009. The consequence of that stimulus was inflation, asset bubbles
and excess capacity. We still think that this recovery will not last very long,"
she said.
The signs of excess are visible everywhere as the Communist Party once again
throws caution to the wind . Cement production jumped 24pc in March and
infrastructure investment rose 19pc."
As we stated last week at the end of our brief write-up on China's recent
monetary-inflation surge, the attempt to ignite a new boom in China is partly
responsible for the broad-based revival in the commodity markets. This is a good
reason to not yet be aggressive when buying exposure to industrial commodities.
The Stock Market
The US
Valuation
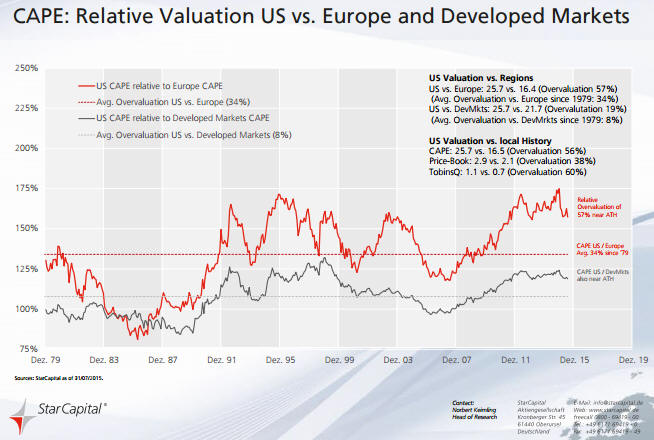
The following chart from
Star Capital does a good job of showing the US stock market's valuation
problem. The red and grey lines on the chart show the US stock market's
Cyclically-Adjusted Price/Earnings ratio (CAPE) relative to the average CAPE in
Europe and the average developed-market CAPE, respectively.
Using CAPE as the measuring stick, late last year (the cut-off for the chart)
the US stock market was 57% over-valued relative to Europe and 56% over-valued
relative to its own long-term average valuation. The situation today would be
similar.
When a stock market is this expensive, a lot has to go right just to prevent a
large decline. In particular, monetary conditions must remain easy, a recession
must be avoided, there must be a generally optimistic view about future
earnings, and the expected rate of "inflation" must be a low positive number.
Current Market Situation
The US stock indices are doing what they need to do to keep the bear-market
scenario alive.
The Dow Transportation Average (TRAN) is playing its part by not yet managing to
close above its March high. Consequently, the index that led to the downside
last year and to the upside since 20th January this year has not yet confirmed
April's new multi-month highs for the SPX.
In addition, the NASDAQ100 Index (NDX) has provided preliminary evidence of a
downward reversal by dropping quickly to its 50-day MA.
The NDX could now be at the equivalent of the two points marked with arrows on
the above chart. If so, there will soon be a 1-3 week rebound to a lower high
followed by a substantial decline.
A rebound in the NDX that retraces at least half of its recent sharp pullback
would create the next opportunity to purchase QID (a leveraged bear fund linked
to the NDX) or QID call options.
Metals and Mining
The SPDR S&P Metals and Mining ETF (XME) is a strange conglomeration of stocks.
Its top 20 holdings comprise 5 precious-metals (gold, silver or PGM) miners, 2
aluminium producers, 1 copper miner, 1 coal miner, and 11 steel manufacturers.
Therefore, buyers of this ETF are getting steel exposure diluted with a
hotchpotch of mining stocks.
Strange composition or not, this ETF has experienced a remarkable rally over the
past three months. By the beginning of March it was already 'overbought', but
this didn't prevent it from sustaining its upward trend.
As illustrated by the top section of the following chart, it is now up by more
than 100% from its January low. As illustrated by the bottom section of the
following chart, it has managed to handily outperform the gold-mining sector
since the second week of February.
XME has been elevated by the broad-based recovery in equity prices since 10th
February and by the efforts to ignite a new boom in China. At least one of these
props is likely to soon disappear.
Gold and the Dollar
Gold
The scale of the gold market
The amount of gold flowing into and out of the SPDR Gold Trust (GLD) inventory
is often portrayed as an important driver of the gold price, but it is nothing
of the sort. As we've previously explained*, due to the way the ETF operates it
can reasonably be viewed as an effect, but not a cause, of a change in the gold
price. In any case, the amount of gold that shifts into and out of the GLD
inventory is trivial in comparison to the overall market.
Since the beginning of December last year the average daily change in GLD's
physical gold inventory has been about 3 tonnes, or about 0.1M ounces. To most
of us, 0.1M ounces of gold would represent huge monetary value (at US$1250/oz,
0.1M ounces is worth US$125M), but within the context of the global gold market
it is a very small amount.
To give you an idea of how small we point out that over the same period (since
the beginning of December last year) the average amount of gold traded per day
via the LBMA (London Bullion Market Association) was around 20M ounces. Also
over the same period, average daily trading volume on the COMEX was roughly 250K
gold futures contracts. A futures contract covers 100 ounces, so the average
daily trading volume on the COMEX was equivalent to about 25M ounces.
Very roughly, then, the combined average amount of gold traded per day via the
facilities of the LBMA and the COMEX over the past few months was 45M ounces.
This amount is 450-times greater than the average daily change in the GLD
inventory and still covers only part of the overall market.
As an aside, over the past few months the average daily trading volume in GLD
shares has been about 15M. A GLD share represents slightly less than 0.1 ounces
of gold, so this equates to about 1.5M gold ounces. The volume of trading in GLD
shares is therefore an order of magnitude more significant than the volume of
physical gold going into and out of the GLD inventory, but it is still a long
way from being the most influential part of the overall market.
Once you understand the scale of the overall gold market you will realise that
many of the gold-related figures that are carefully tracked and often portrayed
as important are, in reality, far too insignificant to have any effect on price.
For example, the quantity of gold that trades via the combined facilities of the
LBMA and the COMEX on an average DAY is about 45-times greater than the quantity
of gold sold in coin form by the US Mint in an average YEAR.
An obvious objection to the above is that we are conflating physical gold and
"paper gold" (paper claims to current gold or future gold). Yes, we are doing
exactly that. When considering price formation in the gold market it makes sense
to consider the 'physical' and 'paper' components together because they are
inextricably and closely linked by arbitrage-related trading. In particular, in
the major gold-trading centres the price of a 400-oz good-delivery bar of
physical gold is always closely related to the prices of futures contracts and
the prices of other well-established paper claims to gold.
So, don't be misled by analyses that focus on relatively minor shifts in
physical gold location. Just because something can be counted (for example, the
daily change in the GLD gold inventory) doesn't mean it is worth counting, and
just because something can't be counted (for example, the total amounts of gold
traded and hoarded by people throughout the world) doesn't mean it isn't
important.
*Our last two blog posts on the topic are
HERE and
HERE. The crux of the matter is that neither a rising gold price nor a
rising GLD share price necessarily results in the addition of gold to GLD's
inventory. Additions of gold only happen if GLD's share price rises relative to
its net asset value and deletions of gold only happen when GLD's share price
falls relative to its net asset value, with the process driven by the
arbitrage-trading of Authorised Participants.
Current Market Situation
At the end of last week the gold market was hinting that near-term price
weakness was in store, but the market has since strengthened a little. The price
is now back above its 50-day MA and is no longer hinting at anything. The next
$60 move is just as likely to be to the upside as to the downside.
The gold price at the close of trading on 27th April was almost identical to the
gold price at the close of trading on 11th February. Therefore, what we've had,
to date, is a strong 2-month rebound from the December-2015 bottom followed by
2.5 months of going sideways. This could be the start of a cyclical bull market,
especially considering the relative strength of the gold-mining indices, but
it's way too soon for a rational and knowledgeable observer to make a definitive
statement about a long-term trend reversal. However, price targets of $3000/oz
for gold and $75/oz for silver are
already being bandied about by some pundits. Amazing.
Gold Stocks
Despite the trendless action in the gold market, the HUI remains in a short-term
upward trend and retains the potential for an upside blow-off (an explosive
trend-ending move). A daily close above 210 would warn that a blow-off was in
progress.
Note that resistance at 210 is a lot more significant than it appears to be on
the following chart. The reason is that in addition to being defined by price
highs over the past three weeks, this level was last year's peak. It is the
equivalent of $1308 in the gold market.
As mentioned in the latest Weekly Update, a daily close below 190 would suggest
that the first real correction of the past three months had begun. Extending the
overall rally to mid-year would almost certainly require an intervening
correction, whereas a break above 210 could set in motion a 1-2 week blow-off
move that culminated at an intermediate-term peak during the first half of May.
Taking both the magnitude and the consistency of the rise into account, the
rally from the 19th January bottom has been the gold-mining sector's strongest
ever from a multi-year bottom. This augurs well for the future, because it
suggests that even if we aren't dealing with a bull market we are dealing with a
rally that will last 1-2 years.
In the next Weekly Update we plan to review some very long-term charts in an
effort to put the current situation into perspective.
The Currency Market
The Dollar Index pulled back over the first three days of this week and in doing
so has extended what appears to be a multi-week basing pattern. It needs to
close above 95.1 to signal an end to the basing and the start of a rise to the
channel top at 96.5.
As we write, the currency market is reacting to news that the Bank of Japan
(BOJ) has decided to take no new/additional inflation-promoting measures for the
time being. Unlike the Fed's decision to do nothing, the BOJ's decision to do
nothing came as a surprise to many market participants.
The initial market reaction has been dramatic strength in the Yen, weakness in
Japanese equities and weakness in the Dollar Index. It will be interesting to
see if this reaction is sustained through to week's end.
Updates on Stock Selections
Notes: 1) To review the complete list of current TSI stock selections, logon at
http://www.speculative-investor.com/new/market_logon.asp
and then click on "Stock Selections" in the menu. When at the Stock
Selections page, click on a stock's symbol to bring-up an archive of
our comments on the stock in question. 2) The Small Stock Watch List is
located at http://www.speculative-investor.com/new/smallstockwatch.html
Chart Sources
Charts appearing in today's commentary
are courtesy of:
http://stockcharts.com/index.html
http://www.barchart.com/
![]()