![]()
![]()
![]()
![]()
- Interim Update 27th May 2020
Copyright
Reminder
The commentaries that appear at TSI
may not be distributed, in full or in part, without our written permission.
In particular, please note that the posting of extracts from TSI commentaries
at other web sites or providing links to TSI commentaries at other web
sites (for example, at discussion boards) without our written permission
is prohibited.
We reserve the right to immediately
terminate the subscription of any TSI subscriber who distributes the TSI
commentaries without our written permission.
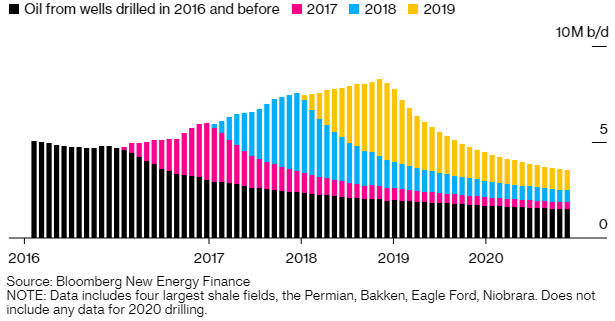
The coming plunge in US
oil production
A characteristic of oil
production from shale is a fast production decline (there is an initial
surge and then a rapid tapering of production from a typical well drilled
into a shale oil field). The producers of shale oil overcome this
challenge by constantly drilling new wells.
The point is
illustrated by the following two charts, both of which come from the
Bloomberg article posted
HERE. The first chart highlights the production declines from wells
drilled prior to 2020. The second chart shows what would happen to US
shale oil production if no new wells were drilled after May-2020 (in
effect, it shows the expected production decline from all existing wells).
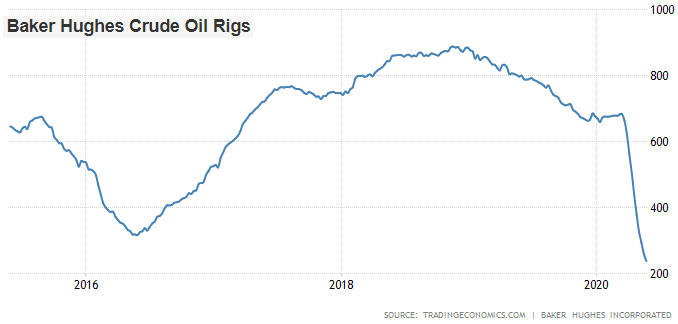
The drilling of new wells will continue. However, the next chart shows
that there already has been a precipitous decline in the number of
operating drill rigs -- from around 700 at the start of this year to
around 230 today. Furthermore, for most US companies focused on shale oil
production an oil price in the $30s will not provide sufficient incentive
to increase drilling activity. As a result, US oil production should trend
downward over the next several months.
The huge reduction in US drilling activity combined with the OPEC+
production cuts and a rebound in demand due to the easing of virus-related
restrictions has brought the oil market back into balance. The market
remains well supplied, but there is no longer a glut and a further
tightening of supply is likely over the months ahead due to the decline in
the US rig count.
It probably will take a sustained rise in the oil
price to well above $40/barrel to create a sufficient economic incentive
to ramp up drilling activity in the US. We expect this to happen within
the next 12 months, but not within the next 4 months. Therefore, we don't
expect to see oil below $20 again, although a downward correction in the
oil price probably will coincide with the next meaningful decline in the
stock market.
Trading around a
core position
One of our favourite money
management techniques is trading around a core position, where a core
position is the amount of exposure we want to maintain to a stock that we
think has a very bullish intermediate-term risk/reward. This tactic takes
advantage of volatility while minimising both risk and opportunity cost.
Trading around a core position works best with volatile stocks, such
as the stocks of junior mining companies, that are in long-term upward
trends or trading within long-term horizontal ranges, although it also can
be applied to stocks that are in declining trends. It's a way of
generating income from stocks that don't pay dividends or increasing the
income from stocks that do pay dividends. In effect, it amalgamates
long-term trading (a.k.a. investing) and short-term trading.
The
idea is that you add to your core position in a stock following a pullback
to a support area or after the stock price becomes stretched to the
downside ('oversold'), and then take profits on the additional shares
after the stock price rebounds to a resistance area or becomes stretched
to the upside ('overbought'). The decision to exit the add-on shares in
such a situation should be straightforward given that your core position
will cover you should the stock price continue to rise. There is, of
course, a risk that the stock price will continue to fall after the add-on
shares are purchased. This risk can be managed by a) applying the tactic
only to the stocks of companies with healthy balance sheets and b) not
buying more than you would be comfortable being stuck with if a rebound
doesn't materialise in the short-term.
Here are two recent examples
from our own account involving stocks that we follow at TSI.
The
first example is Alkane Resources (ALK.AX), a junior gold miner. As
indicated on the following daily chart, twice over the past six months we
bought ALK shares in the low-to-mid-$0.50s and then sold in the $0.90s. We
did this while holding a medium-large core position in the stock that we
plan to keep at least until the spin-out of its specialty metals project
in Q3-2020 and potentially for much longer. Note that the stock traded in
the A$0.90s again during the first two days of this week, but the
preceding pullback wasn't deep enough to prompt the initiation of a new
short-term trade and the $0.90s isn't high enough to prompt a reduction in
our core position.
The second example is Peyto (PEY.TO), a mid-tier natural gas producer.
As indicated on the following daily chart, we were buyers of PEY shares in
the C$1.40s during the March crash (we mentioned this purchase at the
time). These shares were added to a medium-large core position. The stock
subsequently traded as low as C$0.90 before rocketing up to around C$3.00.
We sold the add-on shares near the 200-day MA in the C$2.80s (we
mentioned at the time that a short-term profit-taking opportunity had
arrived in this stock) and continued to maintain a core position.
Trading around a core position is part of the scaling approach to
buying and selling that we advocate. Scaling involves building a position
over time (ideally during weakness) and then exiting over time (ideally
during strength). For a stock that meets the relevant criteria, a core
position should be established by scaling in over time.
Scaling
in/out of positions and trading around core positions eliminates the need
for accurate timing of buy/sell decisions. The alternative is to try to
figure out the right times to go 100% in and 100% out. If you think that
you can consistently get the timing exactly right, you are kidding
yourself and are a financial accident waiting to happen.
Summing
up, with the stocks of well-managed and financially-solid companies it
often makes sense to trade around a core position. This involves doing
some buying during the periodic purges and some selling during the ensuing
surges, all the while maintaining significant ('core') exposure.
The Stock Market
The rally in the US stock market
continued this week, enabling the SPX to move slightly above its 200-day
MA. We addressed this possibility in the latest Weekly Update, when we
wrote:
"A sustained break above the 200-day MA at this time
would be a big surprise, but perhaps there will have to be at least a 1-3
day move above this widely watched MA to convince the majority that the
bull market has resumed and establish a sentiment backdrop that would be
consistent with an important top."
Of greater significance is
that the rally broadened out over the past two days. This is evidenced by
the following daily chart, which shows that the recent bearish divergence
between the SPX and the NYSE Advance-Decline Line (ADL) is now very close
to being eliminated.
The broadening-out of the rally is also evidenced by the charts of the
Dow Transportation Average (TRAN) and Russell2000 SmallCap ETF (IWM) shown
below. TRAN and IWM not only surged to new multi-month highs in nominal
dollar terms over the past two trading days, they also were strong
relative to the SPX.
The fundamentals (as indicated by our Equity True Fundamentals Model -
ETFM) remain decidedly bearish, so the risk of another substantial decline
is high. However, the fundamentals don't tell us anything about timing.
The concluding two paragraphs from last week's Interim Update still
apply. Here they are again:
"This is a time to be looking for
selling opportunities and/or tightening stops and/or hedging in some way.
Unlike the senior US stock indices, some commodity-related stocks and ETFs
still have significant short-term upside potential. For example, the Oil
Services ETF (OIH) could be about to complete a basing pattern (see chart
below). However, the entire market looks vulnerable.
We think the
best-case scenario involves a multi-month period of range trading by the
SPX. This scenario is plausible and potentially would allow the relatively
cheap commodity-related stocks/ETFs to make catch-up moves, but, as
mentioned earlier, a return to the March low is also plausible."
Here is an update of the OIH chart referred to in the above excerpt
from last week's Interim Update. There was an upside breakout (to complete
the basing pattern) on Wednesday 27th May that suggests the potential for
a quick rise to the $140s.
With regard to our own money management, advantage was taken of
Wednesday's strength to exit the OIH shares purchased during the March
crash (we mentioned the purchases in a TSI email alert at the time), but
we are maintaining exposure to OIH via January-2021 call options purchased
during and before the crash. Our current plan is to exit these calls if
there is significant additional strength within the next few weeks.
Gold and the Dollar
Gold
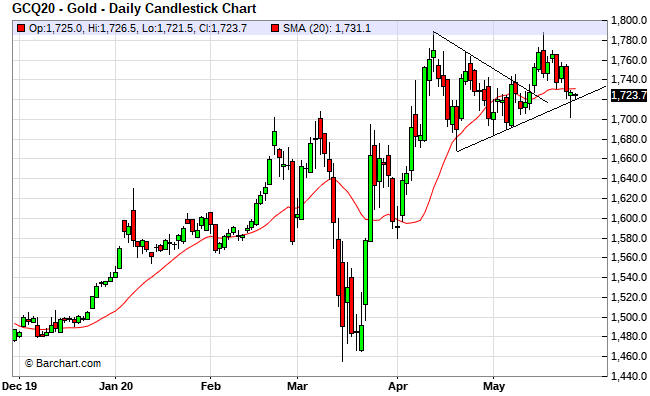
Below is a daily chart of the August-2020 gold futures contract.
Since testing its April-2020 high at the start of last week, the gold
price has pulled back. It's possible that gold has 'double topped'
slightly below $1800, but a daily close below $1680 or a weekly close
below $1690 is still needed to signal a short-term trend reversal.
Gold Stocks
On Tuesday of this week the HUI
broke below lateral support in the 280s and its 20-day MA. This is
preliminary evidence that a multi-month top is in place. A daily close
below support at 260 would be more conclusive evidence of a top. This
support survived a test on Wednesday.
The historical record tells us that May tops in the gold mining sector
can lead to correction lows anywhere from June to November. This
time-window is too wide to be useful, and in any case we can't find any
historical analogues of the gold mining sector's recent price performance
and current situation. As far as we know, never before has there been a
bona fide crash and full recovery within such a short period.
In
looking for relevant historical comparisons, the best we have been able to
come up with is that February-May of this year was an ultra-compressed
version of what took place between March-2008 and December-2009. It's
certainly the case that from a fundamental perspective the current
situation in the gold mining sector is similar to the situation during
2009.
As mentioned in earlier commentaries, after crashing in 2008
and fully recouping its losses by late-2009, the HUI commenced a
correction that took it back to the vicinity of its 50-week MA. If a
short-term top is in place then a similar outcome this time around would
result in the HUI bottoming in the 220s within the next couple of months.
If the HUI closes below 260 then 220 will become our target for a
correction low and the next sector-wide buying opportunity.
The Currency Market
The way we have drawn the
angled lines on the following daily chart makes it look like the Dollar
Index (DX) has just broken out to the downside, but the purpose of these
lines is simply to illustrate that the DX has been oscillating within a
narrowing range. To decisively break out of this range the DX will have to
either close below its early-May low (98.7) or close above its mid-May
high (100.6).
We suspect that there will be at least two points of
additional movement in the direction of the breakout.
Regardless of which way the DX breaks out of its current short-term
range, we expect that fundamental shifts over the months ahead will create
irresistible downward pressure on the US$. These fundamental shifts are
associated with relative stock market performance, interest rate
differentials and the Fed's plan that any increase in the demand for
dollars will be met with a counteracting increase in the supply of
dollars.
With regard to the coming 1-2 years we continue to be
bullish on the Australian dollar (A$), but our short-term concern is that
this currency will retrace at least half of its March-May rally after the
US stock market completes its post-crash rebound. The reason for our
concern is illustrated by the following chart, which shows the strong
positive correlation between the A$ and the SPX over the past four months.
Updates on Stock Selections
Notes: 1) To review the complete list of current TSI stock selections, logon at
http://www.speculative-investor.com/new/market_logon.asp
and then click on "Stock Selections" in the menu. When at the Stock
Selections page, click on a stock's symbol to bring-up an archive of
our comments on the stock in question. 2) The Small Stock Watch List is
located at http://www.speculative-investor.com/new/smallstockwatch.html
Chart Sources
Charts appearing in today's commentary
are courtesy of:
https://stockcharts.com/
https://tradingeconomics.com/
https://www.barchart.com/
http://bigcharts.marketwatch.com/
![]()