|
- Interim Update 27th September 2006
Copyright
Reminder
The commentaries that appear at TSI
may not be distributed, in full or in part, without our written permission.
In particular, please note that the posting of extracts from TSI commentaries
at other web sites or providing links to TSI commentaries at other web
sites (for example, at discussion boards) without our written permission
is prohibited.
We reserve the right to immediately
terminate the subscription of any TSI subscriber who distributes the TSI
commentaries without our written permission.
Inflation Expectations
The fall in inflation expectations since the second week of May has
effectively caused the Fed's monetary policy to become tighter even
while the Fed has been keeping the official overnight interest rate
unchanged...
Below is a chart of the "Expected CPI", calculated by subtracting the
yield on an inflation-protected 10-year T-Note from the yield on a
normal 10-year T-Note. We certainly aren't alone in our belief that the
CPI bears little resemblance to the actual effects of inflation on the
dollar's purchasing power, so the value of the "Expected CPI" is
probably not an accurate reflection of the markets' inflation
expectations. Rather, it probably just represents the effects of
inflation that the markets expect the government to 'fess up' to.
However, we have good reason to believe that the Expected CPI's trend
reflects the trend in inflation expectations.
Since the beginning of 2004 the Expected CPI has oscillated between
2.3% and 2.7%. That is, since the beginning of 2004 readings of around
2.7% for the Expected CPI have coincided with short-term peaks in
inflation expectations while readings of around 2.3% have coincided
with short-term troughs in inflation expectations. The most recent peak
occurred during the week ending 12th May -- the week during which gold,
silver and copper hit their highs for the year and the week that bonds
and the Dollar Index hit their lows. Inflation expectations have since
been on the decline in parallel with declines in metal prices.
Bonds have been beneficiaries of the May-September decline in inflation
expectations, which is not surprising. What is surprising is that the
US$ hasn't rebounded by much from its 12th May low. The fall in
inflation expectations since the second week of May has effectively
caused the Fed's monetary policy to become tighter even while the Fed
has been keeping the official overnight interest rate unchanged, which
should have given the US$ more of a boost than has been the case thus
far.
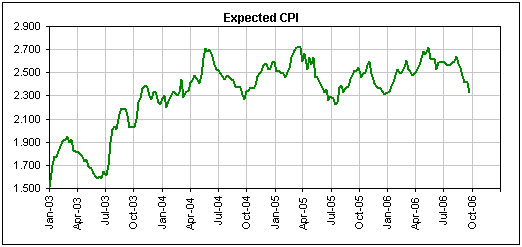
The Expected CPI is
now close to the levels at which it has 'troughed' over the past three
years, perhaps indicating that inflation expectations have gone almost
as low as they are going to go and are about to embark on a new
up-trend. A lot will depend, however, on what happens to metal prices.
To be specific, in order to drive the Expected CPI below the bottom of
its 3-year range the prices of gold and copper will probably have to
break decisively below their June lows, but if the June lows for these
metals hold over the coming month or so then the Expected CPI's 3-year
range should remain intact and bonds will retrace their recent gains.
The Stock Market
Commodity-Related Equities: how low can they go?
Major oil producer Conoco Phillips (NYSE: COP) is trading at around
5-times earnings; in other words, it has an earnings yield (the
reciprocal of the P/E ratio) of around 20%. Major copper producer
Phelps Dodge is also trading at an earnings yield of around 20%.
Gas-production majors Chesapeake Energy and Encana have earnings yields
of around 13%, and most natural gas-oriented income trusts now have
distribution yields in the 16%-20% range. Rio Tinto and BHP Billiton,
the world's two largest mining companies, have earnings yields of 11%
and 9%, resp.
Meanwhile, the S&P500 Index has an earnings yield of only 5.5%.
With the major commodity-related equities selling at such low
valuations in both absolute and relative terms, how much lower can
their stock prices go? In our opinion, not much lower in the absence of
a large downturn in the broad stock market.
We think industrial commodities are a few months into a cyclical
downturn that will ultimately last about 12 months, but it seems as if
this view of ours has already been largely discounted by the stock
market. The downside risk in commodity-related equities therefore
appears to be significantly less than the downside risk in the
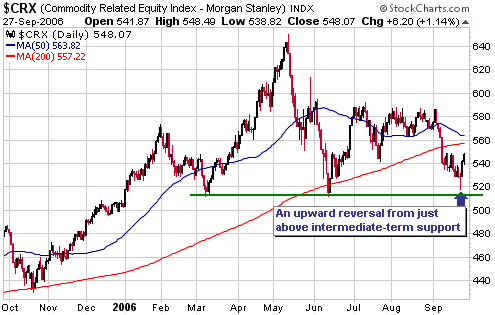
commodities themselves. In fact, this week's upward reversal in the
Morgan Stanley Commodity-Related Equity Index (see chart below) might
be indicating that an intermediate-term bottom is already in
place.
And even if an intermediate-term bottom isn't in place the scene
appears to be set for a tradable multi-month bounce in the commodity
stocks.
Gold and
the Dollar
Gold Stocks
Intermediate-term outlook
...for
the anticipated (by us) October-November low in the gold sector to be
followed by a major advance, as opposed to just a counter-trend
rebound, there will probably have to be an upside breakout by TYX/FVX.
Our view is that the popular gold stock indices -- the HUI and the XAU
-- will complete successful tests of their June lows during
October-November. Considering that earlier this week the XAU traded
within 2% of its June low and the HUI traded within 5% of its June low,
if our outlook proves to be close to the mark then the ultimate
correction lows for the major gold stocks aren't going to be far below
this week's lows.
As things currently stand the main risk to our outlook is that a change
in the liquidity trend -- from expanding to contracting -- has not yet
been signaled (gold and gold shares are counter-cyclical and tend to do
best when liquidity is contracting). It would certainly be possible for
gold shares to rebound over the next few months in parallel with a
further expansion in liquidity simply because they've become extremely
oversold, but to get a rally that ultimately takes the gold stock
indices to new multi-year highs there will most likely have to be a
major change in the liquidity trend.
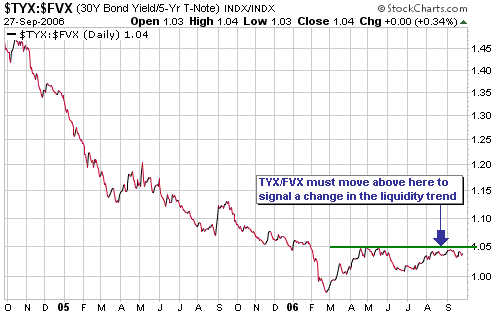
As noted in previous commentaries, an early warning signal of such a
trend change would be a decisive break above its May high by the
TYX/FVX ratio (the 30-year interest rate divided by the 5-year interest
rate). As illustrated by the following chart, such a signal is yet to
occur.
In other words, for the anticipated (by us) October-November low in the
gold sector to be followed by a major advance, as opposed to just a
counter-trend rebound, there will probably have to be an upside
breakout by TYX/FVX.
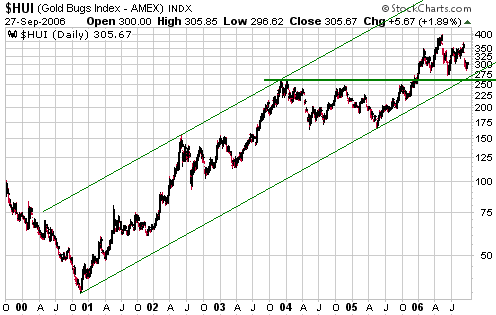
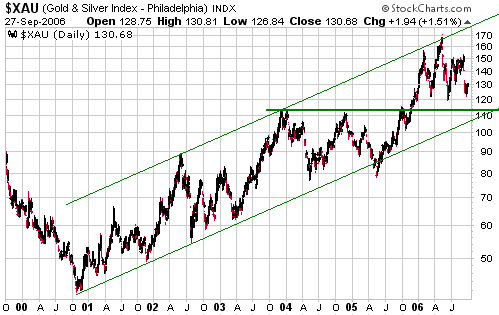
While the June lows
are important for the HUI and the XAU, the most important support
levels reside a few percent below the June lows. To be specific, there
is long-term lateral and trend-line support for both of these indices
about 5% below their respective June-2006 lows. These long-term support
levels are indicated on the following charts.
Short-term outlook
This week's lows in the XAU and the HUI were low enough to constitute
tests of the June lows, so there might not be a future opportunity to
buy the major gold stocks at significantly cheaper prices. We do,
however, think that a drop to marginal new lows will occur within the
next 2 months.
Gold and Silver
Sentiment
Current sentiment readings are generally consistent with the idea that
the gold price is close to an intermediate-term bottom. For example,
over the past week the MarketVane bullish consensus for gold hit a low
of 57%, or just 4% above the 2-year low. And this was despite the fact
that the gold price, at its worst levels over the past week, was still
about 40% above its lowest price of the past two years.
In our opinion, sentiment only becomes a significant factor in a market
when there is a substantial discrepancy between the public's perception
of the market and the market's price action. A bullish discrepancy of
this nature exists right now in the gold market in that the public has
become more bearish than would appear to be justified by the price
action.
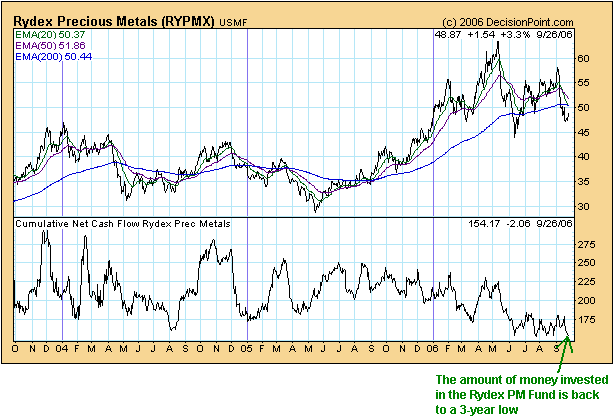
Further evidence of market-bottoming sentiment is provided by the
cumulative net cash flow into the Rydex Precious Metals Fund (RydexPM).
As illustrated by the following chart, the amount of money invested by
the public in RydexPM has just dropped back to the 3-year lows plumbed
in June.
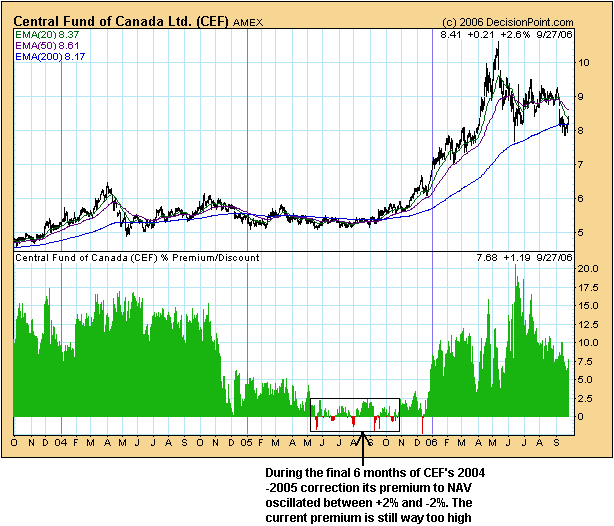
One sentiment
indicator that appears, on the surface, to be at odds with the view
that price is close to an important low is the premium to net asset
value (NAV) at which the Central Fund of Canada (AMEX: CEF) trades
(chart included below). CEF, which holds gold and silver bullion in
approximately equal amounts, ended Wednesday's trading session at a
premium of 7.68% to its NAV. Although well down from the 12%-20%
premiums at which it regularly traded earlier this year, a 7.68%
premium is unreasonably high and suggestive of some stubborn residual
optimism on the part of the investing public.
Now, whenever a fund maintains a substantial premium for an extended
period people invariably come up with explanations for why the premium
makes sense and why it will be sustained. However, premiums ALWAYS end
up disappearing. During the second half of last year, for instance,
there were many opportunities to buy CEF at a DISCOUNT to NAV; and due
to the introduction of the silver ETF in April of this year there is
even less reason for CEF to trade at a premium now than there was in
2005.
The main point we want to make, though, is that we don't perceive CEF's
current large premium to be in conflict with the view that the gold
price is approaching an intermediate-term bottom. This is because
during the 2004-2005 correction it wasn't until well after CEF's
ultimate price low that its premium to NAV bottomed out. Rather than a
lower price it was the dreary multi-month base-building process that
followed the price low that ended up draining away the residual
bullishness responsible for keeping CEF's premium at an elevated level.
In our opinion, investors will have the opportunity to purchase CEF at
a premium of zero within the next 12 months. In the mean time, people
looking to gain exposure to gold and silver bullion via the stock
market should stick to GLD and SLV.
Current Market Situation
In the latest Weekly Market Update we mentioned that December gold
futures had strong resistance at 615-620 and that a rebound at this
time would probably end at, or below, this resistance. With reference
to the following chart, the equivalent resistance level for December
silver is $12.00.
Currency Market Update
The Canadian Dollar dropped to its 200-day moving average last week and
then rebounded strongly, thus extending the consolidation pattern that
began in May. As illustrated by the following daily chart of December
CAD futures, the consolidation consists of a sequence of falling highs
and rising lows. A breakout from this pattern would project a move of
3-5 points in the direction of the breakout.
The downward- and upward-sloping trend-lines drawn on the following
chart will cross in about 2 months time, so the C$ will breakout of its
multi-month consolidation pattern -- one way or the other -- within the
next two months.
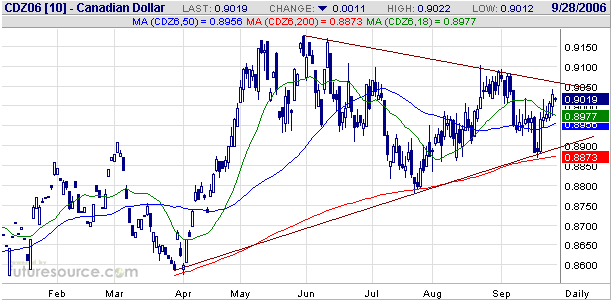
The above chart of
the C$ has a similar look to the charts of the euro and copper futures
included in the latest Weekly Update. Each of these markets appears to
be coiling in preparation for a quick-fire move in one direction or the
other. If we were forced to choose we'd say that the eventual breakouts
will be to the downside, but it's definitely a close call. Fortunately,
we aren't forced to bet on the directions of short-term moves in
currencies and commodities.
Update
on Stock Selections
(Note: To review the complete list of current TSI stock selections, logon at http://www.speculative-investor.com/new/market_logon.asp
and then click on "Stock Selections" in the menu. When at the Stock
Selections page, click on a stock's symbol to bring-up an archive of our comments on the stock in question)
 First Majestic Resource (TSXV: FR). Shares: 49M issued, 59M fully diluted. Recent price: C$2.55 First Majestic Resource (TSXV: FR). Shares: 49M issued, 59M fully diluted. Recent price: C$2.55
As noted in our 8th September Market Alert e-mail, when the price of a
stock plunges in a reaction to bad news the initial low is usually not
the final low. Assuming the company's long-term outlook has not been
damaged as a result of the negative development that resulted in the
stock-price plunge, what typically happens is that there is a rebound
followed by a drop to a new low prior to the start of a sustainable
advance.
In FR's case, we said that the normal course of events following the
stock's bad-news-related dive to an intra-day panic low of C$2.97 would
involve a rebound followed by a drop back to the C$2.50-C$3.00 range.
With FR having just dropped to the bottom of the aforementioned range
there is now a reasonable chance that the stock's ultimate correction
low is close at hand.
The bad news referenced above was, of course, the announcement that the
exploration-stage Dios Padre project was probably uneconomic. This news
probably justified a haircut of around 10%, so the fact that the stock
market reacted by taking the share price down by more than 30% created
a good buying opportunity. This type of over-reaction by the stock
market is not uncommon, especially in the world of junior resource
shares.
In our opinion, the 'investors' who panicked out of FR in the
C$2.50-C$3.20 range failed to take into account that the company will
be producing silver at the rate of 4M ounces/year before the end of
this year and is on track to increase its production to 5M ounces/year
by the end of next year. Using average gold stock valuations, which
tend to be lower than average silver stock valuations, 4M ounces/year
of profitable silver production would justify a market capitalisation
of around US$210M, or a price per FR share of around C$3.90. And 5M
ounces/year of profitable silver production would justify a price per
FR share of around C$5.00. FR is a production story, not an exploration
story.
As far as the stock's price performance is concerned, a near-term risk
is that the company will almost certainly have to raise money via an
equity financing within the next few months. That such a financing is
going to happen should be well known and fully priced into the market,
but you never know.
The last point we wanted to make is that someone's perceptions of
whether the current price of something is cheap or expensive will often
be strongly influenced by where the price has been in the recent past.
For example, a year ago a gold price of $580 would have seemed very
high because gold was, at the time, trading at only $460 and had not
traded above $500 in more than 20 years. However, gold at $580 now
'feels' cheap because in the mean time the price has been as high as
$725. Similarly, FR now feels cheap at $2.55 because it traded as high
as $7 in May, but at this time last year a price of $2.55 would have
been viewed as quite high.
While the stock price has been undergoing huge oscillations our
valuation has remained relatively constant. For example, during the
excitement earlier this year we said we thought FR was fully valued in
the C$4-C$5 range on a short- and intermediate-term basis. It
subsequently traded about 50% above the mid point of this range, thus
creating a good opportunity to take some money off the table. We still
think full valuation lies somewhere in the C$4-C$5 range, so with the
stock trading about 40% below the mid point of this range we have a
buying opportunity on our hands.
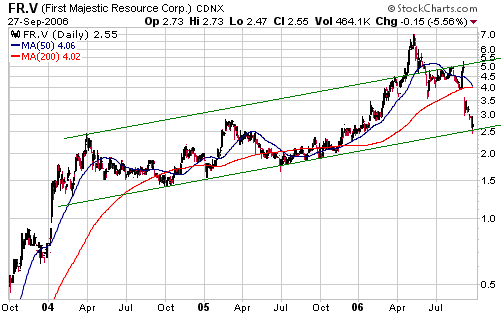
FR's oscillations between over- and under-valuation are evident on the
following chart. During the manic activity of April-May the stock
spiked well above the top of its 3-year channel, whereas it is now
trading at the bottom of the same channel.
 Metallic Ventures (TSX: MVG). Shares: 51M issued, 59M fully diluted. Recent price: C$2.10 Metallic Ventures (TSX: MVG). Shares: 51M issued, 59M fully diluted. Recent price: C$2.10
Early this week MVG announced the results of the independent scoping
study on its 1.1M-ounce Goldfield project in Nevada. The results were
good and have prompted the company to move the project into the
pre-feasibility stage. Specifically, the scoping study completed by
AMEC indicates the potential to produce 50K ounces of gold per year at
an operating cost, including royalties, of US$294/oz. In our opinion,
the scoping study results for this one project justify a stock price of
around C$2/share for MVG.
The more important scoping study is the one currently being completed
for the much larger (3.9M-ounce) Converse project. The results of the
Converse scoping study are expected to be published within the next few
weeks.
If the Converse results are also positive then we will almost certainly
keep MVG in the Stocks List in anticipation of a doubling in its stock
price over the coming year.
 Canarc Resource (TSX: CCM). Shares: 63M issued, 71M fully diluted. Recent price: C$0.76 Canarc Resource (TSX: CCM). Shares: 63M issued, 71M fully diluted. Recent price: C$0.76
CCM's New Polaris gold project in British Columbia looks better with
each new set of drilling results. For example, the latest drill results
included a spectacular intercept of 16.5m grading 23.1gpt of gold (http://biz.yahoo.com/iw/060925/0166439.html).
For anyone interested in accumulating a portfolio of exploration-stage
gold stocks, CCM is an obvious candidate for new buying in the C$0.70s.
 Daylight Resources Trust (TSX: DAY.UN). Recent price: C$13.90 Daylight Resources Trust (TSX: DAY.UN). Recent price: C$13.90
Further to the note included in the latest Weekly Market Update, our
cost base for DAY.UN (a component of the TSI Energy Trust Index (TETI))
has been changed due to each old share of DAY.UN being replaced, on
26th Sep 06, by: 0.6642 new shares of DAY.UN + 0.0417 shares of
Trafalgar Energy (TSX: TFL) + 0.0116 Trafalgar warrants (TSX: TFL.WT).
For record purposes we will assume that the TFL shares and warrants
were sold 'on market' at Tuesday's closing prices of C$4.17 and C$0.15,
resp.
The net result is that our cost base for DAY.UN has increased from
C$10.74 (the 14 July 06 closing price) to C$16.00. DAY.UN's weighting
in the TETI has been adjusted accordingly.
Note that the TFL warrants expire on 23rd October, so if you own them
you should either exercise them or sell them before this date.
Chart Sources
Charts appearing in today's commentary
are courtesy of:
http://stockcharts.com/index.html
http://www.futuresource.com/
http://www.decisionpoint.com/
|

