![]()
![]()
![]()
![]()
- Interim Update 27th September 2017
Copyright
Reminder
The commentaries that appear at TSI
may not be distributed, in full or in part, without our written permission.
In particular, please note that the posting of extracts from TSI commentaries
at other web sites or providing links to TSI commentaries at other web
sites (for example, at discussion boards) without our written permission
is prohibited.
We reserve the right to immediately
terminate the subscription of any TSI subscriber who distributes the TSI
commentaries without our written permission.
Commodities
Bearish copper
fundamentals, bullish zinc fundamentals
In the 26th July
Interim Update we wrote that speculators had played the biggest role in
copper's recent price rise. This was apparent due to the behaviour of the
"term structure" in the copper futures market. Specifically, there was a
'normal' upward slope over time in the prices of copper futures
(later-dated contracts were priced higher than earlier-dated contracts),
indicating that there was no current tightness of supply nor any
expectation among commercial traders that supply would tighten in the
foreseeable future. In the same commentary we wrote that the zinc market's
"term structure" was bullish, because a downward slope in the zinc futures
curve implied that there was current tightness of supply and an
expectation that the tightness would persist.
The prices of both
metals subsequently made additional gains and peaked in early-September,
but whereas the copper price has given back these gains the zinc price
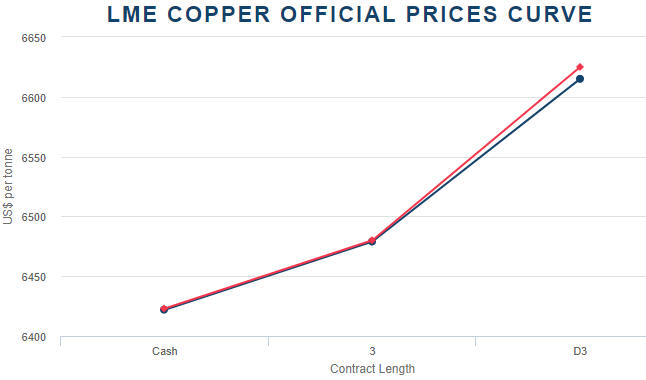
remains near its early-September peak. Here are the relevant charts.
The physical supply-demand situation has since become less supportive
for the copper price and even more supportive for the zinc price. This is
evidenced by the charts displayed below. The first chart shows that the
copper futures curve now has a moderately steep upward slope, meaning that
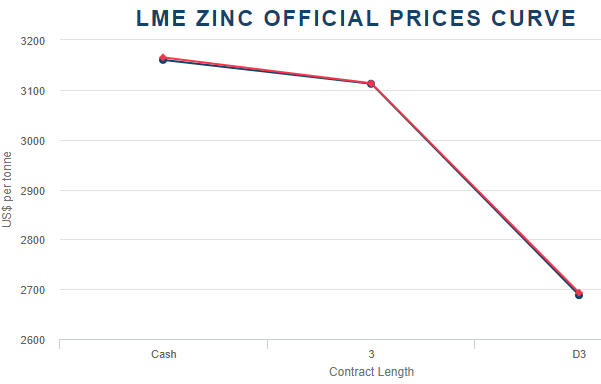
the copper market is very well supplied at this time. The second chart
shows that the zinc futures curve still has a downward slope. Furthermore,
the downward slope of the zinc futures curve has steepened over the past 2
months, meaning that the price gains have not yet started to alleviate the
'tightness' in the physical market.
A good argument can be made (and we have made it) that the increasing
popularity of electric vehicles and the related increase in the demand for
copper will put irresistible upward pressure on the copper price over the
next few years. However, the fundamental driver that matters the most in
the base-metals markets currently points to additional weakness in the
copper price, at least relative to the zinc price, in the short term.
The oil market confirms an upward trend reversal
When the oil price closed above $51 on Monday 25th September it
confirmed the upward reversal of its intermediate-term trend.
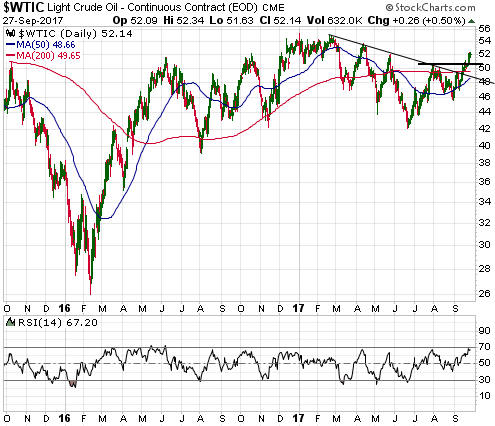
Even if the signal is valid, it is common for an obvious confirmation
of strength to be followed by a pullback. That's especially so when the
obvious confirmation occurs after the market has rallied for a few weeks
and is 'overbought', which is the current situation in the oil market.
Also, it's likely that the oil price will be pressured lower over the
coming few weeks by US$ strength and a broad-based commodity correction.
We noted a couple of months ago that it was time to stop selling
strength and to start buying weakness in the oil market. A pullback over
the coming few weeks could create the next short-term buying opportunity
in anticipation of the oil price moving up to the $60s during the first
half of next year.
The Stock Market
Team Trump has again
announced broad-brushed information about its proposed revamping of the US
tax code. And again, much was said about the large cuts to various
taxes and little was said about how the cuts would be funded.
If
sweeping tax cuts eventually get implemented it's likely that they won't
be funded. In other words, the reduction in tax payments will lead to
larger federal deficits and a faster pace of federal debt accumulation.
This means that the tax cuts will be yet another Keynesian stimulus
program.
The stock market currently likes Keynesian stimulus and in
all likelihood will continue to do so until government bond yields begin
to accelerate upward, at which point an increase in government
deficit-spending will be viewed by equity traders as a reason to sell
rather than a reason to buy.
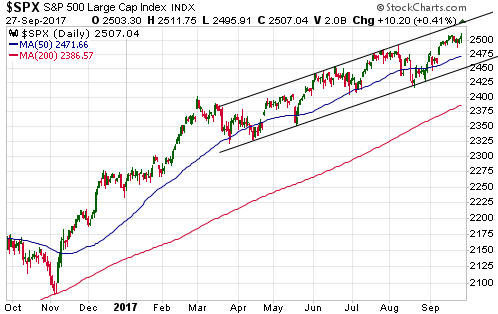
Despite the boost provided by the new
round of tax-cut jawboning, the SPX remains inside the very narrow range
in which it has moved since breaking to a new high 13 trading days ago. A
daily close below 2480 would be preliminary evidence of an upside breakout
failure while a daily close below 2450 (the short-term channel bottom)
would seal the deal.
Price-action-wise, the most important development during the first
three days of this week was the additional strength in the Bank Index
(BKX) and the BKX/SPX ratio. As illustrated below, the strength was
sufficient to break the BKX out of its 9-month channel.
Also, there were upside breakouts on Wednesday in two stock indices
that were laggards until about 5 weeks ago. We are referring to the
Russell2000 SmallCap Index (RUT) and the Dow Transportation Average
(TRAN).
Gold and the Dollar
Gold
It
doesn't help that the Dollar Index is rebounding, but the T-Bond market is
by far the most important source of the recent downward pressure on the
US$ gold price. The recent decline in the T-Bond price (rise in the T-Bond
yield) is both related to and leading to increasing confidence in the
banking sector, narrowing credit spreads, a higher real interest rate and
a falling bond/dollar ratio, all of which are bearish for gold. The
overall effect is that the GTFM, which appeared to be firmly entrenched in
bullish territory as recently as two weeks ago, is now perilously close to
turning bearish.
The most likely way for the short-term downward
pressure to be removed from the gold price would be for the stock market
to decline by enough to prompt a meaningful shift towards the perceived
safety of the T-Bond.
Turning to the following daily chart, we note
that the US$ gold price closed below its 50-day MA on Wednesday 27th
September. The 50-day MA needed to hold to avoid invalidating the
short-term bullish case, but given the non-supportive sentiment backdrop
and the deterioration (from gold's perspective) in the fundamental
backdrop it is not surprising that it has been breached.
The breach of the 50-day MA does not imply that there will be a lot
more downside in the gold price. What it implies is that the
early-September gold-price peak will hold for a few months.
With
regard to the most likely price for a short-term bottom, the 200-day MA
near $1250 is a realistic target. However, rather than targeting a
specific price it makes more sense to target a 'technical' condition
and/or sentiment situation.
Based on what happened in May and July
there's a decent chance that the next short-term bottom in the gold price
will coincide with gold's daily RSI(14) touching 30. This could occur as
soon as next week.
Gold Stocks
The HUI had
'last ditch' short-term support at 197.5. This support was breached on a
daily closing basis on Wednesday 27th September.
As is the case
with gold, the HUI's breach of support does not imply that there is a lot
more downside in store. Instead, it implies that the early-September top
was more important than we initially thought and that the next multi-week
rally will end at a lower high (that is, below 220).
The HUI has strong support at 180-185. This support range is a
potential target for a short-term bottom now that 197.5 has given way.
Regardless of whether the aforementioned support range is reached, we
expect that the gold-mining indices will make short-term bottoms within
the next two weeks in parallel with interim extremes in the gold price (a
low), the T-Bond price (a low) and the Dollar Index (a high).
The Currency Market
A
monetary-policy divergence for the ages
The policies of the
Fed and the ECB have been diverging since March-2015, when the ECB
introduced quantitative easing (QE) five months after the Fed ended a
similar course of action. The divergence became more pronounced when the
Fed kicked-off its rate-hiking program in December-2015 and next month
(October-2017) it will become as extreme as it can get.
It's likely
that in October-2017 the ECB will announce the 'tapering' of its 60B
euro/month QE program. However, this won't be a signal that the ECB's
monetary policy is about to become less 'accommodative', because a
reduction in the quantity of bonds that are monetised each month will go
hand-in-hand with a substantial extension of the program.
Specifically, the ECB has committed to monetise 60B euros of bonds per
month until December-2017, but has said nothing about what will happen
thereafter. In other words, the program currently runs until the end of
this year. The most reasonable expectation is that the program will be
extended well into 2018 at a reduced monthly rate.
In our opinion,
there is no chance that the ECB's QE program will end before mid-2018 and
a realistic chance that it will continue until 2019.
Also, there is
almost no chance of the ECB hiking its targeted interest rates within the
coming three months. Furthermore, while the ECB may remove its negative
interest-rate policy (NIRP) during the first half of next year, there's a
high probability that its deposit rate, which currently sits at negative
0.40%, will be no greater than zero in mid-2018.
At the same time,
the Fed has already hiked the equivalent of its deposit rate on four
occasions and probably will have implemented at least two more hikes by
the middle of next year. Also, the Fed is about to kick off a quantitative
tightening (QT) program beginning at $10B/month and ramping-up over the
ensuing 12 months to $50B/month.
It therefore seems that for at
least the next 9 months we will have the ramping-up of a Fed
money-supply-contraction program and the Fed moving its targeted interest
rates further into positive territory alongside a continuing ECB
money-supply-expansion program and the ECB maintaining either NIRP or
ZIRP. This means that the monetary-policy divergence that began in
March-2015 is about to become extreme, with the Fed ramping up its
tightening at the same time as the ECB extends its aggressive loosening.
Now, this doesn't imply that there will be something more than a 1-3
month rebound in the Dollar Index (DX) from its recent low and an
associated 1-3 month pullback in the euro from its recent high. The
monetary-policy divergence is clearly bullish for the US$ relative to the
euro, but the US$/euro exchange rate is driven by differences in market
interest rates that don't always follow monetary policy shifts in an
obvious way. For example, despite the Fed being 'tighter' than the ECB
throughout this year to date, the difference between the yields on 10-year
US and German government bonds (the interest-rate differential the matters
the most in this case) moved in the euro's favour until mid-July. Refer to
the following chart comparison of the euro (the blue line) and the
Germany-US 10-year bond-yield differential (the green line) for details.
Note: From mid-July until early-September the euro overshot to the upside
due to speculative buying that was not supported by the dominant
fundamental driver.
The bottom line is that monetary policy is becoming increasingly
supportive for the US$ relative to the euro, but the bond yields set by
the market will determine whether or not this translates into US$ relative
strength.
Current Market Situation
Although a reversal was yet to be confirmed by the price action, we
have been assuming that the Dollar Index made a short-term bottom in
early-September. This assumption was confirmed by the price action over
the past three trading days when the DX broke above lateral support at
92.5, lateral support at 93.0 and the 50-day MA.
Resistance at 94
is a likely 2-week target.
Updates on Stock Selections
Notes: 1) To review the complete list of current TSI stock selections, logon at
http://www.speculative-investor.com/new/market_logon.asp
and then click on "Stock Selections" in the menu. When at the Stock
Selections page, click on a stock's symbol to bring-up an archive of
our comments on the stock in question. 2) The Small Stock Watch List is
located at http://www.speculative-investor.com/new/smallstockwatch.html
Chart Sources
Charts appearing in today's commentary
are courtesy of:
http://stockcharts.com/index.html
http://www.lme.com/
http://www.kitco.com/
![]()