![]()
![]()
![]()
![]()
- Interim Update 27th December 2017
Copyright
Reminder
The commentaries that appear at TSI
may not be distributed, in full or in part, without our written permission.
In particular, please note that the posting of extracts from TSI commentaries
at other web sites or providing links to TSI commentaries at other web
sites (for example, at discussion boards) without our written permission
is prohibited.
We reserve the right to immediately
terminate the subscription of any TSI subscriber who distributes the TSI
commentaries without our written permission.
Cryptomania Update
From the 18th December Weekly
Update:
"We are now two weeks away from the start of a 2-week
window in which previous speculative manias have 'blown out'. Also, there
are precedents for blow-off tops in asset prices shortly after the start
of futures trading. Therefore, 'cryptomania' could be close to its zenith.
Be aware, though, that at this point a 30%-40% price crash could turn
out to be nothing more than a bull market correction. It will only be
known -- to the extent that such things can ever be known -- that a major
top is in place if there is a price crash, a rebound to a lower high and
then a decline to below the crash low."
On an intra-day basis,
a 45% price crash happened during Monday-Thursday of last week. This means
that the intra-day high of around $20,500 (basis the nearest futures
contract) on Monday 18th December could turn out to be the all-time high,
in which case last week's crash was the first part of a total, or
near-total, collapse. If so, the bitcoin bubble popped one week after the
commencement of futures trading on the CBOE and on the same day as the
commencement of futures trading on the CME.
Despite the ample
evidence that the enthusiasm for bitcoin and the associated "alt-coins"
was an extraordinary popular delusion and that the past few weeks was a
major speculative finale, there is still a realistic chance that last
week's price crash was a bull market correction. As mentioned above,
confirmation of a major top requires a price crash (done), a rebound to a
lower high (possibly in progress) and then a decline to below the crash
low.
The crash low in the cash market was $10,000, but for the
nearest futures contract it was $11,300.
Interesting COTs
Our most recent market update
was an
abbreviated Christmas edition sent by email last Friday. It was sent
before the latest Commitments of Traders (COT) report was published, so
this is our first chance to discuss the report's contents. We just want to
mention two significant developments.
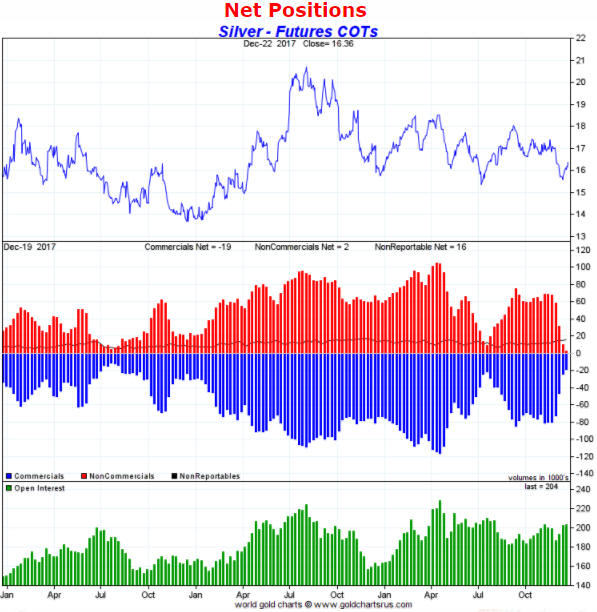
First, the following chart
shows that at the date of the most recent COT data (19th December) the
total speculative net-long position in silver futures (the inverse of the
blue bars in the middle section of the chart) was at its lowest level
since Q3-2015. This probably means that the current rally in the silver
price will extend to $17.50-$18.50 regardless of whether we are dealing
with a new intermediate-term upward trend or a counter-trend rebound.
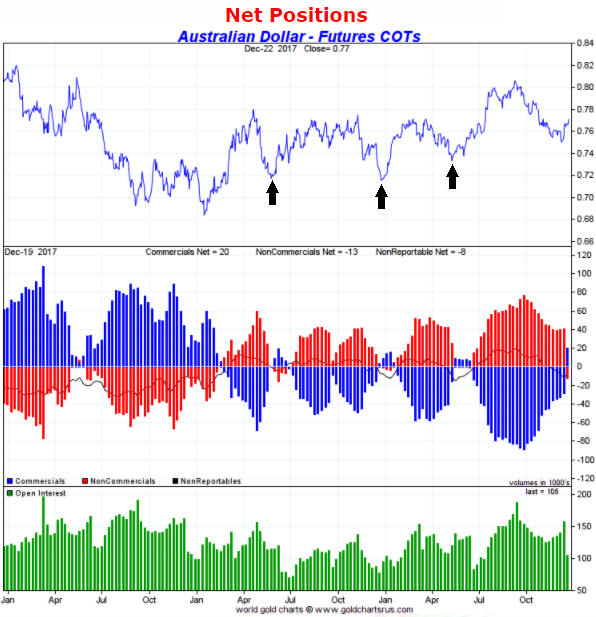
The second development worth mentioning is the change in the
Australian dollar's COT situation.
Three months ago the A$'s COT
situation was extremely bearish. Prior to last week it had been getting
less bearish (more bullish) at a steady pace in parallel with a downward
correction in the A$/US$ rate, but the latest COT numbers reflect a
dramatic improvement.
The latest COT numbers indicate that
speculators, as a group, were net-short the A$ by 20K contracts after
having been net-long by about 30K contracts a week earlier. This turn of
events means that the A$'s COT situation at 19th December was similar to
what it was at the last three multi-month price bottoms (marked by the
arrows on the following chart).
We have been expecting the A$ to
make a correction low in January or February. It still might, but the COT
data suggest that the low is already in place and that the A$ will do no
worse than test its December low within the coming two months.
Can monetary
deflation offset monetary inflation?
The answer to the above question is no; once there has been sufficient
monetary inflation to cause major economic problems the situation cannot
be put right by deflating the money supply. In fact, deflating the money
supply would magnify the pain. Understanding why this is the case requires
a brief explanation of why monetary inflation is so dangerous.
The
large-scale creation of money out of nothing doesn't cause a uniform rise
in prices. It causes some prices to rise faster than others and in doing
so leads to business owners, entrepreneurs and investors having false
impressions about the amount of future demand. It also causes a false
impression about the amount of real savings in the economy. These false
impressions, in turn, lead to many investing and business decisions that
will eventually prove to be ill-conceived.
Once the mistakes caused
by the falsification of price signals start being realised, a corrective
process -- usually called a recession -- gets underway. This entails a
widespread reduction in new investment, the liquidation of inventories,
the shelving of expansion plans and the reallocation of resources.
Naturally, the corrective process will result in temporary unemployment,
excess capacity and the general under-utilisation of resources.
Unfortunately, in today's world it will also result in central banks
creating a lot more money out of nothing in an effort to prompt a new
round of spending errors that will, according to Keynesian theory,
counteract the consequences of earlier spending errors.
In summary,
monetary inflation is a problem primarily because it falsifies the price
signals upon which business decisions are made, not because it leads to a
rise in the so-called "general price level".
Obviously, shrinking
the money supply can't mitigate the consequences of the bad decisions that
were prompted by the earlier expansion of the money supply. To explain by
way of a hypothetical example, assume that monetary inflation causes the
price of commercial real estate to sky-rocket and in response a real
estate developer begins to construct a large office building. Also assume
that two-thirds of the way through the construction it becomes apparent
that the future demand for office space will be much lower than originally
forecast, meaning that the building will not be needed. At this point, a
large quantity of resources has been consumed by a project that will not
be economically viable and may not even be completed.
Just as the
creation of money out of thin air causes price distortions, so does the
vanishing of money into thin air. When money is destroyed on a large scale
there isn't a uniform reduction in prices throughout the economy; instead,
some prices collapse while others fall by a small amount or not at all.
Deliberately deflating the money supply will therefore never make sense,
although under the current monetary system it is inevitable that some of
the money that gets loaned into existence during a boom will be destroyed
during the ensuing bust.
The Keynesian economists who guide the Fed
are blissfully unaware of how monetary inflation and deflation affect the
economy. As far as they are concerned, the economy is like a bathtub
containing an amorphous fluid called "aggregate demand". In this
unrealistic view of the world, the job of the central bank is to pump-in
or pump-out demand with the aim of keeping the bathtub filled to a
desirable level.
After a great many years of pumping into the
imaginary bathtub, in October of this year the Fed finally decided that
the level was a little high and began pumping out (it has begun to destroy
money, albeit at a very slow pace). As discussed above, this can only
hurt. However, the way the current system works the Fed has no choice.
Even if its new leadership understood that the damage has been done and
that reducing the money supply could only magnify the inevitable negative
consequences, for the Fed to retain credibility a deliberated monetary
contraction is almost mandatory.
This is because a Fed decision to
maintain its balance sheet at today's bloated level would be a tacit
admission that QE results in a permanent addition to the money supply as
opposed to a temporary exchange of money for assets. This would not be an
issue in the present, but it would become an issue the next time the Fed
decided that QE was appropriate. Furthermore, since the Fed monetises
assets that eventually mature, holding its balance sheet at today's
bloated level forever would necessitate the endless monetisation of new
assets to replace the maturing old assets.
Therefore, we can be
confident that the Fed will persist with its deflationary 'pumping-out'
operation until asset prices plunge. After prices plunge, the pumps will
be reversed in an effort to prompt a new round of spending errors.
The Stock Market
Tesla (TSLA) is one of the
poster children for the bull market in technology-related stocks. In the
18th December Weekly Update we wrote that:
1) TSLA was possibly the
most over-priced large-cap stock in the US market.
2) There were
signs in TSLA's chart that it may be close to completing a top of at least
intermediate-term significance.
3) A weekly close below $300 would
complete TSLA's topping pattern and project a decline to around $200,
where the stock would still have a very high valuation (renowned
short-seller Jim Chanos believes that Tesla's equity would be
appropriately valued at zero).
4) TSLA was a reasonable candidate
for a bearish speculation in the $340-$360 range, with an initial
protective stop placed slightly above the September high.
The stock
price has since dropped from the mid-$340s to $311, or about 10%, but it
is still within the confines of its 6-month trading range. Only a break
below $300 followed by downward acceleration would confirm that the price
action of the past 6 months constituted a major top as opposed to a
bull-market consolidation.
Of the senior US stock indices, the NASDAQ100 Index (NDX) is the best
proxy for the bullish trend. This is because the NDX is the senior index
that is most strongly influenced by the large-cap stocks that have been
the focal points of speculation over recent years.
The NDX has
consolidated over the past few days and looks set to make at least one
more new high. This next high could turn out to be very important.
In the market update sent by email last Friday, we wrote:
"Based
on current chart patterns, it's likely that the first sign of serious
weakness will occur in Europe, not in the US.
The EURO STOXX 50
Index (STOX5E) has now spent 26 trading days oscillating within a
horizontal range, the bottom of which lies at 3525. It closed at 3571 on
Thursday 21st December.
A daily STOX5E close below 3525 would be a
sign of serious weakness and could be a timely prompt to establish a new
bearish speculation focused on the more highly-priced US market, while a
daily STOX5E close above 3620 (the top of the range) would suggest that
the market was temporarily out of danger."
The STOX5E has now
spent 28 days within the above-mentioned range.
We expect a
downside breakout by the STOX5E in early-January.
With regard to bearish speculations, our own account contains a
position in TSLA put options expiring in April-2018 and we are looking for
an opportunity to add some April-2018 QQQ put options. For those who
prefer to avoid options trading it could make sense to average into QID
(ProShares UltraShort QQQ) over the next few trading days.
Gold and the Dollar
Gold
The
rebound in the gold price from its mid-December-2017 low has been purely
sentiment-driven, in that the price has moved upward in response to
speculators becoming increasingly bullish -- and becoming net buyers of
gold futures -- even though the fundamental backdrop has not been
supportive. In this respect it is similar to the initial decline from the
September-2017 peak, in that during the three-week period immediately
following the early-September peak the price was pushed downward by the
scaling back of an extremely aggressive speculative net-long position
despite the fundamental backdrop being gold-bullish.
Almost
regardless of what happens to gold's true fundamentals, we expect that the
shift in speculative sentiment will result in the gold price making some
additional headway over the coming few weeks. However, an
intermediate-term (6-12 month) upward trend would require a substantial
fundamental shift in gold's favour. This could happen in response to an
intermediate-term decline in the broad stock market, but it hasn't begun
yet.
With regard to the short-term price action, gold is nearing
important lateral resistance at $1300. We suspect that this resistance
will hold if tested within the next few days and that there will be some
corrective activity over the coming 1-2 weeks. The rally should then
resume.
Taking into account the COT situation, gold's price action and the
recent performance of the HUI/gold ratio, at this time the rally from the
mid-December low looks similar to the rally from the early-July low.
Gold Stocks
The rally from the December low
has not yet moved the HUI above its 200-day MA. However, GDX, GDXJ and the
XAU have broken solidly above their respective 200-day MAs. GDX's breakout
is illustrated by the daily chart displayed below.
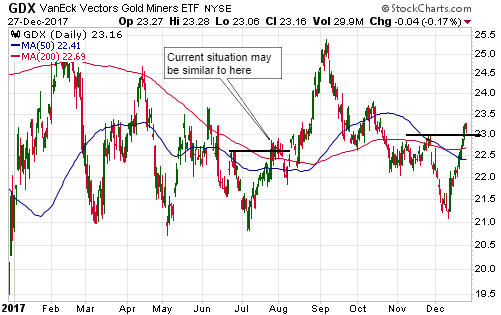
The gold-mining indices and ETFs are probably close to highs that will
hold for at least two weeks, but even if we are dealing with nothing more
than a counter-trend rebound there is likely to be additional upside
before the overall rebound is complete. What we expect from here is an
interim high within the coming three trading days followed by a pullback
to the vicinity of the 50-day MA and then a move to above the
aforementioned interim high.
The Currency Market
92.5 has consistently acted as support and resistance for the Dollar
Index (DX) over the past 5 months. Right now it is an important support
level. If the DX breaks through this support and doesn't reverse course
soon after, then a decline to a new 12-month low will be on the cards.
We suspect that the 92.5 level will hold for now or that a downside
breakout within the next few days will prove to be short-lived. This is
because the DX presently has both sentiment and fundamentals on its side.
Updates on Stock Selections
Notes: 1) To review the complete list of current TSI stock selections, logon at
http://www.speculative-investor.com/new/market_logon.asp
and then click on "Stock Selections" in the menu. When at the Stock
Selections page, click on a stock's symbol to bring-up an archive of
our comments on the stock in question. 2) The Small Stock Watch List is
located at http://www.speculative-investor.com/new/smallstockwatch.html
![]() Potential
addition to the TSI Stocks List: Aura Minerals (TSX: ORA). Shares: 34M
issued, 35M fully diluted. Recent price: C$2.61
Potential
addition to the TSI Stocks List: Aura Minerals (TSX: ORA). Shares: 34M
issued, 35M fully diluted. Recent price: C$2.61
In 2016 we
wrote of our interest in Rio Novo Gold (RN.TO). We thought that the stock
offered very good value below C$0.20 considering the economics and
construction-ready status of the company's Almas gold project in Brazil,
but were put off by the weak balance sheet. Our tentative plan at the time
was to add RN to the TSI Stocks List if, and only if, it raised enough
money at a low-enough cost to solidify its financial position while
remaining an excellent value proposition. That never happened.
Here
we are more than a year later with RN still offering excellent value and
still having a very weak balance sheet (at 30th September it had a working
capital deficit of US$5M), meaning that it is in no condition to move the
Almas project forward. The difference, now, is that RN has agreed to be
taken over by Aura Minerals (ORA.TO), a gold-mining company with the same
controlling shareholder (Northwestern Enterprises), in an all stock deal*.
The merging of these two companies was announced last week and makes
so much sense that we wonder why it didn't happen sooner. This is a case
of one plus one being a lot greater than two, because the combination
removes the individual weaknesses.
ORA is profitable, has a healthy
balance sheet and is currently producing gold at the rate of around 120K
ounces/year from a mine in Honduras and two mines in Brazil. With its
existing assets it may be able to increase its production rate, but not by
much. In other words, it lacks organic growth potential. RN, on the other
hand, has huge growth potential but no way of financing the growth. When
RN becomes part of ORA there will be a clear and fairly short path to a
40% increase in the latter's annual production, given that the Almas
project is expected to have average annual production of 52K ounces.
If the merger is completed as planned then the combined company will
have 43M shares, 55% of which will be held by Northwestern.
We
roughly estimate the post-merger value of an ORA share to be C$6.70, which
is about 160% above the current share price. This assumes that a) the 120K
ounces/year of current production is worth US$1000/oz (much lower than
average), b) the Almas project is worth 50% of the NPV estimated in the
Feasibility Study** completed last year, c) the combined company initially
will have net working capital of US$30M, and d) ORA's other assets are
worthless.
The most important short-term company-specific risks
are:
1) The merger doesn't get approved by minority shareholders.
2) An asset sale that was arranged by ORA a few weeks ago and that
should add US$40M to its balance sheet in February falls through.
Both of the above events have low probabilities, but if either happens it
will be a deal-breaker for us.
Despite the apparent value at the
current price (C$2.61), we aren't going to add ORA to the TSI List at this
time. Instead, we'll wait for a better opportunity. The main reason is
that the stock price has risen sharply on low volume over the past two
weeks and is close to resistance defined by its 2016 high (see chart
below). The other reason is that with gold and the gold-mining indices
having not yet signaled the start of an intermediate-term rally, there
should be no hurry to buy any gold-mining stock.
Hopefully there
will be a significant pullback in the stock price within the next few
weeks. If there is then we will add an ORA position to the TSI List,
either directly or indirectly (via RN). Specifically, ORA will be added to
the List if it trades at C$2.05 or RN will be added to the List if it
trades at C$0.10. Note that paying C$0.10 for RN would be equivalent to
paying about C$1.90 for ORA.
*0.053 of an ORA share for each RN share.
**At a gold price of $1250/oz the Almas project was
estimated to have an after-tax NPV(5%) of US$147M and an IRR of 34%.
Chart Sources
Charts appearing in today's commentary
are courtesy of:
http://stockcharts.com/index.html
http://www.goldchartsrus.com/
![]()