|
- Interim Update 28th February 2007
Copyright
Reminder
The commentaries that appear at TSI
may not be distributed, in full or in part, without our written permission.
In particular, please note that the posting of extracts from TSI commentaries
at other web sites or providing links to TSI commentaries at other web
sites (for example, at discussion boards) without our written permission
is prohibited.
We reserve the right to immediately
terminate the subscription of any TSI subscriber who distributes the TSI
commentaries without our written permission.
Overview
Below is a copy of the e-mail alert that we sent to subscribers in
response to Tuesday's gyrations in the markets. We are reproducing it
in full in today's report because it is a good summary of how we view
the current situation.
We certainly didn't anticipate Tuesday's wild market action, but the moves were generally in line with our views. In particular:
a) The US$ moved sharply
lower in line with our short-term bearish outlook while T-Bonds moved
sharply higher in line with our short-term bullish outlook.
b) Over the past week
we've reiterated short-term bullish views on the Yen and the Swiss
Franc, two of the strongest currencies on Tuesday.
c) Although we are
short-term bullish on gold and gold stocks, we have warned that a
multi-week correction would probably soon begin.
d) We've been concerned
about the failure of the NASDAQ100 Index (NDX) and the Broker/Dealer
Index (XBD) to confirm the new highs in other stock market indices, but
were waiting for more evidence before bringing our short-term stock
market view into line with our bearish intermediate-term outlook.
That the US stock market
and stock markets around the world have turned down prior to bullish
confirmations from the NDX and the XBD suggests, to us, that stock
market corrections of at least intermediate-term significance have
commenced. Furthermore, it is quite possible that major peaks (the type
that will hold for more than 12 months) have been put in place, but
note that major peaks are usually tested before large multi-quarter
declines get underway. In other words, if a major peak has just been
put in place then we should expect the initial decline from the
February high to be followed, within the next few months, by a rally
that 'tests' the high.
The catalyst for
Tuesday's sell-off was a plunge in China's stock market in response to
additional steps being taken by Chinese authorities to curb the rampant
credit-fueled speculation that caused the Shanghai Stock Exchange Index
to 'go parabolic' over the past several months. This appears to have
prompted a general downgrading of the 'China growth story' in the minds
of speculators throughout the world, thus leading to a move away from
risk and, perhaps, a partial unwinding of the Yen carry trade. (The Yen
carry trade has been extensively used to finance speculations, so the
exiting of these speculations might have prompted a partial unwinding
of the associated financing arrangements. This is a potentially
self-reinforcing trend in that Yen strength resulting from the
unwinding of some carry trades makes the carry trade less appealing,
causing the unwinding to accelerate. That is, increasing risk aversion
leads to a shift away from the Yen carry trade, which leads to Yen
strength, which prompts a further reduction in the overall extent of
the carry trade, and so on.)
IF the unwinding of the
carry trade picks up steam then the Yen will make large gains over the
coming few months. This is a big 'if', but the Yen's short-term
risk/reward continues to look attractive.
The market sectors and
stocks that have recently done the best were generally the worst
performers on Tuesday. Particularly hard hit were the emerging market
ETFs and the commodity-related stocks -- investments that have been
bid-up on the basis that global growth would remain strong. These
investments were naturally hit hard when fears of a China-inspired
growth slowdown suddenly moved to centre stage.
The financial backdrop
became slightly more 'gold bullish' on Tuesday due to the modest
widening of credit and yield spreads as well as the rapid pricing-in of
a second 0.25% Fed rate cut (prior to Tuesday the Fed Funds Futures
market had been anticipating a single 0.25% rate cut by year-end), but
this didn't prevent gold and gold stocks from selling off along with
growth-oriented investments. This is not unexpected, though, as we've
previously warned that counter-cyclical gold would likely be taken down
along with cyclical investments during the INITIAL phase of a
market-wide sell-off.
If growth expectations
continue to ramp down then the financial backdrop will become
increasingly favourable for gold, so investors should take advantage of
short-term weakness to build-up their exposure to the yellow metal.
TSI's main focus will remain on the small-cap end of the gold share
universe because this is where the most attractive long-term
risk/reward ratios can be found.
It's too early to be
buying gold stocks aggressively because the gold market is just one day
into a correction that will probably last 3-6 weeks, but note that
different stocks will hit appropriate levels for new buying at
different times. The timing of new buying should therefore be
determined on a stock-by-stock basis, not on the basis of what the gold
stock indices happen to be doing. The approach we typically adopt in
situations like this -- and are adopting now -- is to place
below-the-market buy orders for the stocks we want to accumulate.
Additional note:
The stocks of base metal producers/explorers were hammered, but the
base metals themselves were generally unfazed by Tuesday's market
shakeout. This is potentially important because it suggests that there
is little speculative premium in current base metal prices and that the
emerging markets theme is now the focal point of speculation. This
doesn't mean that there is minimal downside risk in the base metals,
but probably does mean that a large price decline will have to be
driven by a significant fall in commercial demand relative to mine
supply rather than by the liquidation of speculative positions.
The Stock Market
Current Market Situation
...there
appears to be a lot more short-term downside risk at this time in the
emerging markets than in the US. ...a sharp decline in emerging market
equities not confirmed by a significant widening of emerging market
credit spreads...will be suspect.
We doubt that Tuesday's stock market plunge will prove to be a 'one-day
wonder' because the failure of leading indices (the NDX and the XBD
mentioned above) to confirm February's new highs in other stock indices
was already sounding a warning that something was wrong. We are
therefore shifting our short-term view on the US stock market from
"neutral" to "bearish". We wouldn't be surprised if the rebound that
began on Wednesday continued for a few more days, but would be very
surprised if the highs of the past two weeks were exceeded anytime
soon.
Although the US stock market is in a secular downward trend while the
stock markets of many "emerging" economies are in secular upward
trends, there appears to be a lot more short-term downside risk at this
time in the emerging markets than in the US. The reason is that over
the past two years the emerging markets have benefited to a far greater
extent than the US market from the liquidity deluge and are thus more
vulnerable to being adversely affected by a liquidity contraction.
Putting it another way: while market participants are moderately
optimistic about the prospects for US equities they are absolutely
euphoric about the prospects for emerging market equities, and have
placed their bets accordingly. This leaves little room for a positive
surprise and a lot of room for the negative variety.
The vulnerability of the emerging markets to a negative surprise was
evident in Tuesday's intra-day decline of more than 10% in the iShares
MCSI Emerging Markets fund (NYSE: EEM). EEM rebounded a little on
Wednesday and could rebound some more over the coming days, but we
think Tuesday's drubbing will prove to have been the proverbial
"warning shot across the bow".
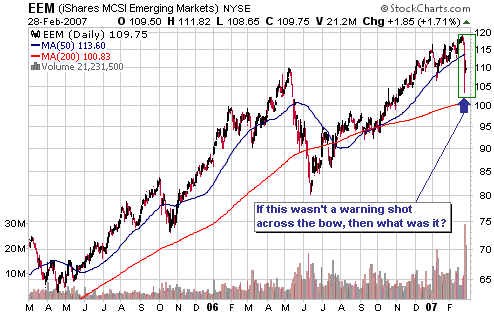
Now, one thing about
emerging market equities is that they routinely make big counter-trend
swings that don't mean anything beyond the very short-term. For
example, EEM lost 27% of its value within the space of only 5 weeks
during May-June of last year and then resumed its upward trend as if
nothing had happened. How, then, could we tell the difference between a
sharp pullback within an on-going upward trend and the first downward
leg in a cyclical bear market?
The best way, we think, is to follow what's happening to emerging
market bonds. A lot of 'dumb money' (the public's money) flows into and
out of emerging market equities, causing big swings that often don't
have longer-term significance. However, the trading of emerging market
bonds tends to be dominated by the 'not-so-dumb money' (investment
banks and hedge funds). Therefore, a sharp decline in emerging market
equities not confirmed by a significant widening of emerging market
credit spreads (spreads between the yields on emerging market bonds and
US Government bonds) will be suspect. For example, we noted at the time
that the failure of emerging market credit spreads to widen by much in
parallel with last year's plunge in emerging market equities was a
significant bullish divergence.
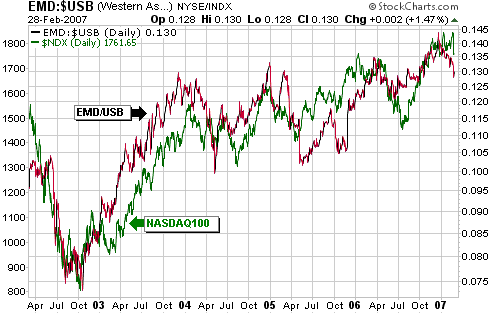
A convenient way of monitoring emerging market credit spreads is via
the EMD/USB ratio (the Emerging Markets Income Fund divided by the US
T-Bond). EMD/USB should fall when credit spreads are widening and rise
when credit spreads are falling. The idea, therefore, is that a major
downward trend reversal in the emerging markets won't be signaled until
there is a sharp decline in EMD/USB.
With reference to the following chart, there has clearly been a
pullback in EMD/USB over the past two months but the pullback is not
YET of sufficient size to signal a trend reversal. If we have just
witnessed the start of a major equity market correction then there
should be a lot more weakness in EMD/USB over the coming month or so.
By the way, the NASDAQ100 Index has been included on the EMD/USB chart
to make the point that the 4-year rally in the US stock market and the
increasing investment demand for emerging market debt are part and
parcel of the same trend.
Gold and
the Dollar
Currency Market Update
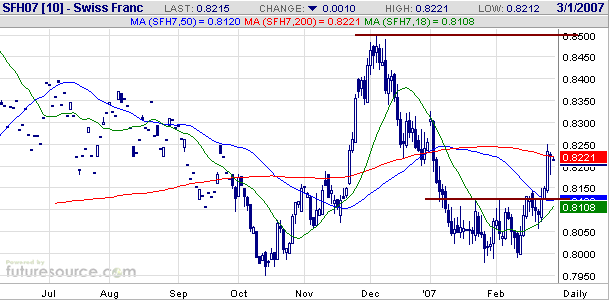
As evidenced by the following daily chart, the March Swiss Franc
futures contract has decisively broken above the top of a 5-week basing
pattern. At some point within the next two months we think the SF will
test its December-2006 high, but we don't think this currency has much
upside potential beyond that.
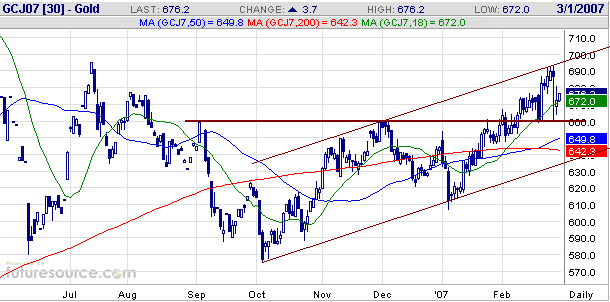
Gold
$660 is proving to be a very important support level for April gold.
Notice, with reference to the following chart, that the one-day plunge
in mid-February halted at $660, as did this week's sharp decline.
If $660 gives way then the channel bottom and the 200-day moving
average, both of which presently reside around $640, would become
near-term objectives.
Our upside target range, as far as the coming two months are concerned,
remains $700-$760 (basis the April contract). The bottom of this range
was almost reached late last week and we seriously considered
downgrading our short-term outlook from "bullish" to "neutral" at that
time; but we decided to maintain our short-term bullish view because
the upside potential still appeared to slightly outweigh the downside
risk. This week's decline has marginally improved the short-term
risk/reward.
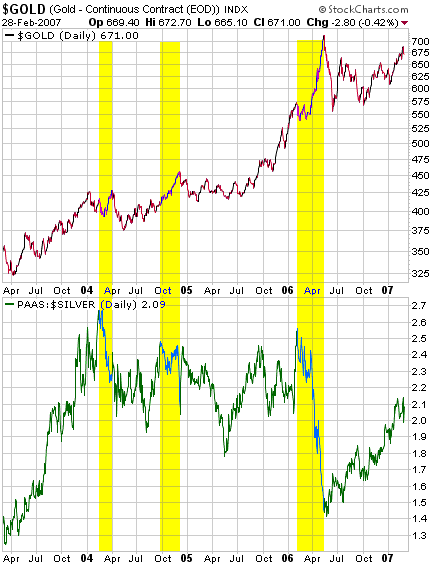
Below is a
chart-based comparison of gold and the PAAS/Silver ratio (the stock
price of Pan American Silver divided by the gold price). The reason
this strange comparison has relevance is that downward reversals in
PAAS/Silver have occurred 1-3 months prior to each of the last three
intermediate-term peaks in the gold price (the shaded areas on the
chart highlight the periods between intermediate-term peaks in
PAAS/Silver and the subsequent intermediate-term peaks in gold). Given
that PAAS/Silver has either just peaked or has not yet peaked, the
chart's message is that we are still at least 1-3 months away from the
next intermediate-term peak in the gold price.
Gold Stocks
In last Sunday's Weekly Market Update we wrote:
"Our guess is that if
short-term peaks are not already in place for gold and the gold stock
indices then they will be put in place within the next week or so.
However, we expect that any pullback over the coming few weeks will be
followed by a move to new multi-month highs."
Due to the severity of Tuesday's decline it is clear that a short-term
peak was put in place on Monday. In price terms it's quite possible
that the bulk of the anticipated pullback is already out of the way,
but we suspect that there will be a few weeks of consolidation and at
least a marginal new low for the move before the next tradable rally
gets underway. Sentiment has undoubtedly taken a hit and it will, we
think, take some time for the market to recover from this hit.
With the gold sector now just two days into a correction that will
probably last a few weeks there should be no urgency to buy, but as
noted in the e-mail alert sent earlier this week it might make sense
for investors desiring to build positions in small-cap gold stocks to
place some below-the-market buy orders at this time. This approach can
pay dividends because the lack of liquidity in the smaller stocks will
sometimes result in quick downward spikes due to inexperienced
traders/investors attempting to get out at any price.
We will do our best to identify buying opportunities as they occur. For
example, later in today's report we mention a gold stock that is
already at a sufficiently depressed level to be a candidate for new
buying; and in the latest Weekly Update we featured a gold stock
(Gryphon Gold) that, due to its lack of movement during the recent
rally, was a candidate for new buying prior to Tuesday's shakeout.
We will also attempt to highlight potential buying opportunities in
advance in those cases where we are able to ascertain logical downside
targets for individual stocks. In general, though, for stocks that
offer good long-term value but became over-extended on a short-term
basis during the recent rally it probably makes sense to anticipate
pullbacks to near the respective 50-day moving averages; that is, it
probably makes sense to place below-the-market buy orders in the
vicinity of this moving average.
Suggested Reading
Over the years we've read plenty of books on investment, but very
few of them have had much impact on us. Some of the ones that have had
an impact are noted below.
One thing that the following books have in common is that they contain
very little specific advice on how to be a better investor. They have,
however, helped to shape the way we view the financial markets and the
business of investing.
1. "Fooled By Randomness -- The Hidden Role of Chance in the Markets and in Life" by Nassim Taleb
2. "The Education of a Speculator" by Victor Niederhoffer
3. "Practical Speculation" by Victor Niederhoffer
4. "Reminiscences of a Stock Operator" by Edwin Lefevre
5. "Against the Gods -- The Remarkable Story of Risk" by Peter Bernstein
If you are interested in reading about economic issues such as inflation, a good source is www.mises.org.
Use the search function at this web site to look for articles written
by Ludwig von Mises, Murray Rothbard and/or Frank Shostak on your
specific topic of interest.
Update
on Stock Selections
(Note: To review the complete list of current TSI stock selections, logon at http://www.speculative-investor.com/new/market_logon.asp
and then click on "Stock Selections" in the menu. When at the Stock
Selections page, click on a stock's symbol to bring-up an archive of our comments on the stock in question)
 Over
the past week we made specific profit-taking suggestions in relation to
three of our stocks (FR, GRS and SBB) when they were near their highs,
and two weeks ago we gave a specific profit-taking target for another
stock (IVW) that was subsequently reached. Over
the past week we made specific profit-taking suggestions in relation to
three of our stocks (FR, GRS and SBB) when they were near their highs,
and two weeks ago we gave a specific profit-taking target for another
stock (IVW) that was subsequently reached.
In the TSI commentaries we identify opportunities to take partial
profits whenever we can, but it's important that holders of junior
resource stocks never become totally dependent on any newsletter for
advice on when to take money off the table. The main reason is that the
decision to take partial profits in a stock should, in most cases, be
based on individual money management considerations. That is, an
individual's decision to take partial profits in a stock for which the
long-term outlook remains bullish will usually be based on
considerations such as that individual's overall market exposure, the
relative weighting of the stock in question within their portfolio (a
large rise in the price of a stock can result in that stock achieving
an excessive weighting within the portfolio), and the effect -- both
financial and psychological -- that a pullback would likely have on
them.
Speculators in small-cap resource stocks need to continuously perform a
sort of balancing act because the initial decline from the top in these
stocks can be dramatic, meaning that technical confirmation of a top
will often come too late to be of practical use. On the other hand,
doing a lot of selling at an early stage can be hazardous to a
speculator's financial health because these types of stocks routinely
make their largest gains during the final few weeks of a sector-wide
rally.
In our own account we almost always take money off the table in stages,
which usually means that the first one or two sales we make prove to be
premature. However, our goal is not to make a once-in-a-lifetime
'killing' by maintaining full exposure to any stock or any market until
the ultimate high is reached (such a goal is the impossible dream of
investment novices and gamblers). Rather, our goal is to generate good
real returns, on both an absolute and relative basis, year after year
after year. The process we go through to achieve this goal involves a)
sticking to those markets or market sectors whose long-term trends are
bullish, b) maintaining an overriding focus on value when selecting
individual stocks, and c) maintaining a sizeable cash reserve that
never falls below 20% of portfolio value and gets adjusted upward in
response to increasing intermediate-term market risk.
Chesapeake Gold (TSXV: CKG). Shares: 29M issued, 43M fully diluted. Recent price: C$6.97
The merger between American Gold Capital (TSXV: AAU) and Chesapeake
Gold (TSXV: CKG) has been completed and AAU has been de-listed. We've
therefore replaced AAU with CKG in the TSI Stocks List. In determining
the original price for CKG in the Stock Selections table we have
assumed that the profit percentage for CKG at the close of trading on
23rd February (the date on which the merger was completed) was the same
as the profit we had on AAU at that time.
We will also add the CKG warrants -- the ones issued to AAU
shareholders as part of the merger -- to the TSI Stocks List as soon as
they begin to trade. At this stage the symbol and listing date for the
warrants are not known.
Lastly, it is not yet known whether the Class A shares will be eligible
to trade on the stock market. If CKG isn't able to arrange a stock
market listing for these shares within the next two months then they
will become slightly more valuable in that they will be convertible
into more CKG shares than would otherwise be the case. However, if they
aren't listed then it obviously won't be possible to trade them and it
won't make sense for us to include them in the TSI Stocks List.
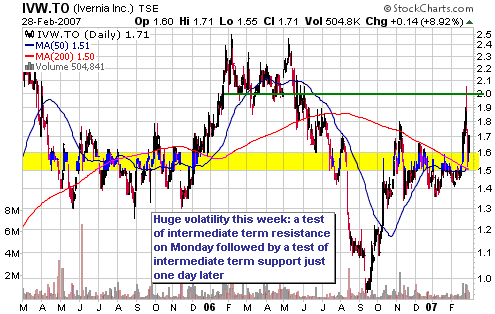
Ivernia Inc. (TSX: IVW). Shares: 134M issued, 143M fully diluted. Recent price: C$1.71
We featured IVW as a buy at C$1.46 in the 12th February Weekly Market
Update on the basis that it looked under-valued and appeared to be
about to breakout to the upside. At that time we also said: "It
would be reasonable, we think, to take partial profits on IVW at around
$2.00 if given the opportunity to do so within the next two months, and
to retain the balance as part of a core industrial metals position."
The stock subsequently moved sideways for a few days before
breaking-out to the upside. It traded as high as C$2.05 on Monday,
providing an opportunity to take partial profits, before pulling back
in response to technically-oriented selling later on Monday and the
general stock market shakeout on Tuesday. It is very unusual for a
stock to drop back to an area where new buying would be appropriate
just one day after reaching a reasonable profit-taking level, but due
to this week's extreme volatility that's exactly what happened to IVW.
Since our last write-up the company released its latest quarterly
results and provided some guidance for 2007. The December results were
very good and the guidance provided by the company regarding this
year's production and costs supports our view that the stock offers
plenty of value near its current price. Production and costs will be
adversely affected during the first half of this year by a low-grade
ore test during the first quarter and the commissioning of a new
pressure filter during the second quarter, but the company still
expects to produce 85,000 tonnes of lead this year -- about 35% more
than last year -- at a cash operating cost of US$0.36/pound. Assuming
an average lead price of US$0.76/pound this would mean that IVW would
have a cash operating margin of US$0.40/pound and would generate
pre-tax cash flow of around US$75M. Using a fairly conservative
valuation of 5-times pre-tax cash flow would then yield a market
capitalisation of US$375M (C$436M), or C$3.11/share based on a share
count of 140M.
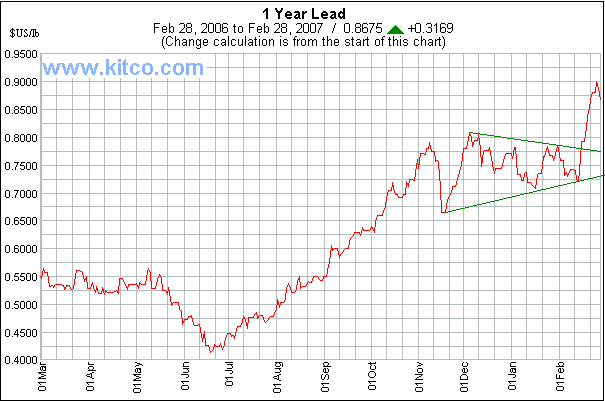
The biggest assumption here is that the lead price will average
US$0.76/pound during 2007. With reference to the following chart, the
current lead price is US$0.87/pound so we are not being particularly
aggressive in our metal price assumption. However, a substantial
slowdown in the rate of global economic growth could certainly push the
average lead price down to a much lower level. We view this as the main
risk, but if you buy the stock in the 1.50s or low-1.60s then you will
have a hefty margin of safety.
Technically, IVW has
good support in the 1.50s and resistance at around C$2.00 (see chart
below). The stock unfortunately rebounded 9% on Wednesday -- we would
have preferred to feature it at Tuesday's closing price of C$1.57
rather than at Wednesday's closing price of C$1.71 -- but could again
become available in the C$1.50s at some point over the next few weeks.
Note that we would no longer view a move up to around C$2.00 as a
short-term profit-taking opportunity because the next time this
resistance is challenged there will be a greater chance of it being
breached.
The Laggards: Richmont Mines (AMEX: RIC) and Nevsun Resources (AMEX: NSU)
RIC has always been a turnaround story for us. It doesn't have the sort
of assets that are ever likely to generate much excitement in the stock
market, but our view was that if it could come close to achieving the
production gains that the company's management was planning then the
market would be forced to price the stock at a much higher level.
It remains an under-valued turnaround story but the pace of the
turnaround has been much slower than we had originally expected/hoped;
and based on the latest information issued by the company there appears
to be no good reason to anticipate a more rapid rate of improvement
over the coming 6 months. We've therefore decided to exit RIC and book
a loss of 22% based on Wednesday's closing price of US$2.59 and our
original entry (12 months ago) at US$3.32.
Note that we aren't particularly concerned about RIC's downside risk.
In fact, because very low expectations are already built into RIC's
price the stock probably has less downside risk than most other gold
stocks of similar size. Our main concern is the lack of upside
potential.
There are limits on the number of stocks we can follow at TSI and there
are other stocks that currently aren't in the TSI List that we think
have better risk/reward ratios than RIC. Exiting RIC now will make it
possible for us to add a new stock, preferably in a few weeks time
following more corrective activity in the sector.
Unlike RIC, NSU certainly has mineral assets with the potential to
excite the stock market. Furthermore, these assets are currently
trading for a lot less than they appear to be worth.
There are always reasons for extreme under-valuation, and in NSU's case
one of the reasons is perceived political risk (Eritrea). However,
we've come to the conclusion that the main factor weighing on the stock
is the market's perception of the company's management.
Years ago when NSU was doing nothing other than drill holes in the
ground the management seemed capable enough, but they began to look
much less capable and lost a lot of credibility once the company
changed from being purely an explorer to being a mine builder/operator.
Unfortunately, management's bad experiences (huge delays and cost
overruns) with the development of the Tabakoto gold mine in Mali
haven't dissuaded it from trying to take the much larger poly-metallic
Bisha project in Eritrea through to production. Clearly, the management
team doesn't understand its own limitations.
Despite the management problem we are going to retain the stock for now
because we think NSU's assets are too good to languish near current
valuations for much longer. In our opinion, either the market will
re-rate the stock or another mining company will make a hostile
takeover bid (hostile to management, that is, but not to shareholders).
In fact, with the stock approaching intermediate-term support (see
chart below) some 'nibbling' might be appropriate at this time.
We wouldn't be surprised to see NSU trade as low at US$1.75 in parallel
with more corrective activity in the gold sector over the next few
weeks, but that's probably the worst case barring a political blow-up
in Eritrea.
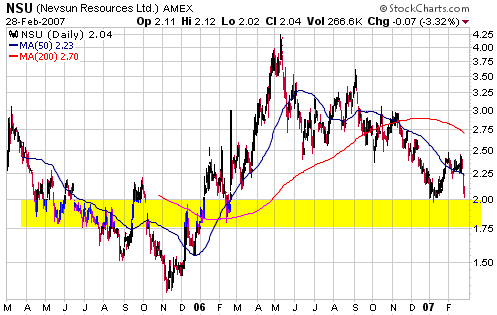
Chart Sources
Charts appearing in today's commentary
are courtesy of:
http://stockcharts.com/index.html
http://www.futuresource.com/
http://www.kitco.com/

|
