|
- Interim Update 28th March 2012
Copyright
Reminder
The commentaries that appear at TSI
may not be distributed, in full or in part, without our written permission.
In particular, please note that the posting of extracts from TSI commentaries
at other web sites or providing links to TSI commentaries at other web
sites (for example, at discussion boards) without our written permission
is prohibited.
We reserve the right to immediately
terminate the subscription of any TSI subscriber who distributes the TSI
commentaries without our written permission.
The central bank
does the inflating, but the government determines the extent of the inflation
"...central banks are ultimately constrained by the will of politicians. And if politicians really want their central bank to do something, the central bank will have no choice but to do it. In recent decades politicians have asked very little of their central banks, who in any case have been happy to run with excessively loose policy. But with the economy, or at least, government balance sheets, now in tatters, politicians' demands are going to grow. And if these demands are not met, central banks will be marginalised then brutalised."
The above was taken from a recent article by Albert Edwards in which the argument was made that Japan's central bank will be forced to monetise a huge volume of government debt. In general terms, the argument is that central banks enjoy the superficial appearance of independence up to the point where the government decides that it NEEDS a lot more inflation to maintain its grip on power. At that point, any semblance of independence goes out the window.
We are in full agreement. In fact, this is a point we have regularly made in TSI commentaries over the past 12 years. The central bank only exists to remove limits on the growth of the government and the commercial banks. It is therefore unrealistic to expect that the government's ability to spend will ever be curtailed for long by the central bank's supposed concern for the purchasing power of money and/or stability of the monetary system. The
elusive US housing turnaround
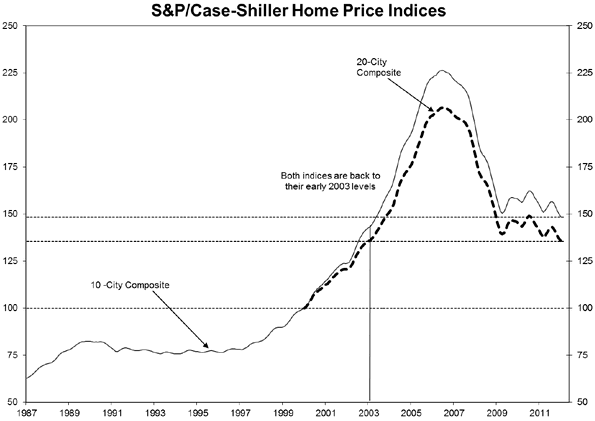
The latest Case-Shiller Home Price Index was reported this week and showed that the average US house price hit a new 9-year low in January. The situation is illustrated on the following chart, which was taken from
Barry Ritholtz's blog.
There is no evidence that the US housing market has bottomed, but with the average price down by about one-third from its 2006 peak and close to the lowest level of the past 10 years, the market probably isn't far from its ultimate bottom in price terms. Especially with the Fed working tirelessly to reduce the purchasing power of the dollar. However, because the market has never been allowed to properly clear it will likely be many years before a new bull market gets underway.
 Copper
Update
The copper price has traded sideways since mid January. It could be consolidating ahead of a move up to the $4.00-$4.50 range.

We won't be surprised if the copper market rallies over the next 1-2 months, but China's economic downturn should prevent it from rallying for much longer than that.
The Stock Market
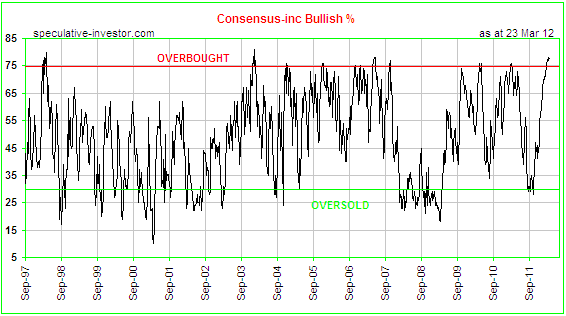
The following chart shows the bullish percentage determined by the Consensus-inc sentiment survey. The Consensus-inc survey is one of the six indicators of stock market sentiment that make up the TSI Index of Bullish Sentiment (TIBS), which is updated weekly at
http://www.speculative-investor.com/new/TIBSnew.htm.
As at the end of last week the Consensus-inc bullish percentage was near its highest level of the past 15 years. Although this is the type of sentiment backdrop that tends to occur prior to the start of a major decline, it doesn't mean that a major decline is necessarily about to begin. Based on the historical record, it means that there is minimal scope to recruit additional traders to the bullish side of the fence (the remaining upside potential is very limited) and that something will probably happen within the next six months to push the bullish percentage down to 30 or lower. For example, whereas the October-2007 extreme high in the Consensus-inc bullish sentiment was followed by a major decline, the extreme high in January of 2004 was followed by a 7-month 'choppy' consolidation that resulted in the average market participant becoming bearish but never pushed the S&P500 Index more than 10% below its January-2004 peak.
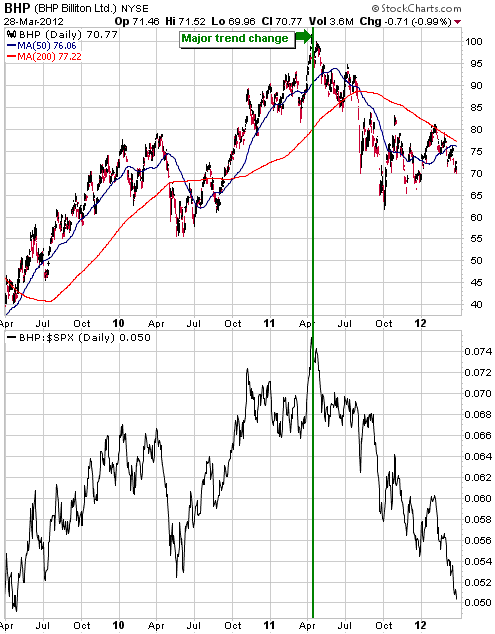
We mentioned a couple of weeks ago that the stocks of most large-cap industrial metal producers appeared to be immersed in cyclical bear markets that got underway during the first four months of last year. The top section of the following daily chart, for example, shows that the stock price of BHP Billiton, the world's largest mining company, is presently a lot closer to its October-2011 low than its April-2011 high.
The bottom section of the following chart brings the bear market more clearly into focus. It shows that relative to the S&P500 Index, BHP just made a new 2-year low and is not far from a 3-year low.
The relative weakness in gold mining stocks (discussed later in today's report) is part of a
broader shift away from mining stocks as reflected in the above chart. We suspect that the mining world's relative weakness will soon come to an end, but we are much less bullish about the intermediate-term prospects for industrial metals and the associated equities than
for gold and the associated equities.
Gold and the Dollar
Gold
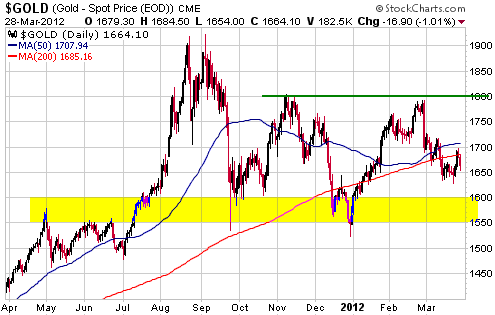
Nothing of significance changed in the gold market over the first three trading days of this week. Gold is probably close to a short-term bottom in terms of both price and time, but there isn't yet any evidence that such a bottom is in place. This leaves open the possibility of a final spike to a new multi-week low before a meaningful rally gets underway.
Silver's situation is similar.
Gold Stocks
The Big Picture
When reviewing the long-term performance of the gold sector in previous TSI commentaries we looked at performance in nominal dollar terms and in gold terms, but as far as we can recall we never looked at performance relative to the broad stock market. This is an omission we are now going to rectify.
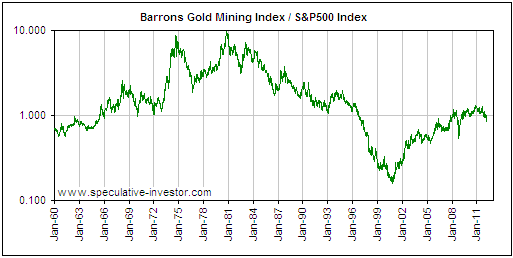
The following weekly chart shows how the Barrons Gold Mining Index (BGMI) performed relative to the broad US stock market (as represented by the S&P500 Index) from 1960 through to this week. Clearly apparent on this chart is the secular bull market in gold-stock relative strength of the 1960s and 1970s, the secular bear market in gold-stock relative strength of the 1980s and 1990s, and the secular bull market in gold-stock relative strength that began in 2000. Also clearly apparent on this chart is that the secular trends contain many counter-trend moves. During the gold secular bull market of the 1960s and 1970s these counter-trend moves were sometimes dramatic and lasted more than two years. During the current secular bull market the counter-trend moves have been far less impressive, but even though they look trivial on the long-term chart they can still feel dramatic in real time.
The next weekly chart zooms in on the current secular bull market in gold-stock relative strength, but note that it uses the XAU rather than the BGMI to represent the gold sector. The switch from the BGMI to the XAU was done for convenience and doesn't make a significant difference to the pattern.
The chart shows that there have been several intermediate-term corrections in gold-stock relative strength over the past 12 years, the most notable being the 18-month correction that began in December of 2003, the 15-month correction that began in May of 2006, and the steep 7-month correction that began in March of 2008. The current correction has lasted 7 months to date and certainly qualifies as the intermediate-term variety.
The chart also shows that the XAU/SPX's weekly RSI hit its lowest levels of the past 12 years in May-2004 and May-2005, and that its current level is close to these prior lows.
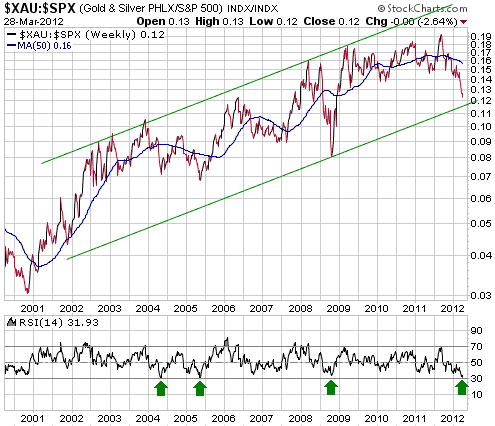
The performance of the XAU/SPX ratio over the past several months looks most similar to its performance during the months leading up to the May-2004 bottom. The May-2004 bottom was followed by a strong multi-month rebound, although it didn't turn out to be the ultimate correction low.
Current Market Situation
The XAU/SPX chart displayed above shows that the gold sector is now almost as 'oversold' relative to the broad stock market as it has been at any time over the past 12 years. This doesn't guarantee that a gold-sector rally will soon begin; it simply means that the gold sector's risk/reward is very favourable. Our goal isn't to accurately predict short-term price direction, which is something that nobody can do with consistency. Our goal is to have the odds in our favour.
This week's price action hasn't provided any new information. In particular, there is no evidence at this time that a short-term bottom is in place.
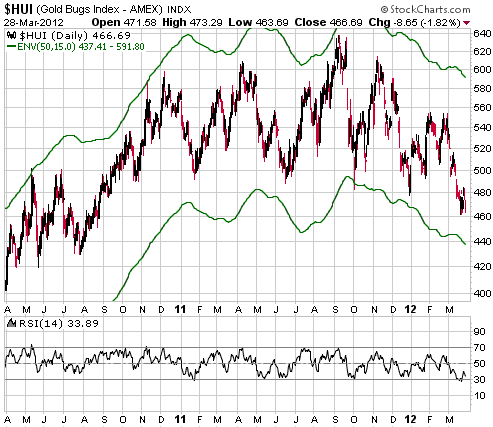
We continue to believe that the bottom of the moving-average (MA) envelope shown on the following daily chart defines the HUI's short-term downside risk. This now means the 430s.
If a decline to near the bottom of the envelope happens over the next few days it will most likely be via an intra-day spike; in other words, it will most likely be quickly reversed in the same way that the decline to the MA envelope bottom was quickly reversed in early October of last year.
Currency Market Update
Due to euro short-covering and falling demand for safe havens, the Dollar Index is more likely to fall than to rise over the next 2 months. However, it probably won't fall far and should be given a boost at some point over the next few weeks by a stock market correction.
We continue to see the potential for a strong US$ rally during the second half of this year in parallel with, and partly in response to, a substantial stock market decline.
Update
on Stock Selections
Notes: 1) To review the complete list of current TSI stock selections, logon at
http://www.speculative-investor.com/new/market_logon.asp
and then click on "Stock Selections" in the menu. When at the Stock
Selections page, click on a stock's symbol to bring-up an archive of
our comments on the stock in question. 2) The Small Stock Watch List is
located at http://www.speculative-investor.com/new/smallstockwatch.html
 Crocodile Gold (TSX: CRK). Shares: 404M issued, 492M fully diluted (including 20M shares to be issued to AUQ). Recent price: C$0.54 Crocodile Gold (TSX: CRK). Shares: 404M issued, 492M fully diluted (including 20M shares to be issued to AUQ). Recent price: C$0.54
In January, Luxor Capital offered to buy up to 85% of CRK at C$0.62/share. We took advantage of this offer and removed CRK from the TSI stock selections list. Our view at the time was that even though CRK appeared to be under-valued at $0.62/share, many other junior gold stocks were at least as under-valued and less risky. (On a side note, Luxor ended up with about 70% of CRK.)
Our decision to exit was borne-out by the 2012 production guidance included in a press release on 26th January. The company's 2012 forecast was for production of 75K-85K ounces, which was only slightly higher than 2011 production despite the planned ramp-up of the new Cosmo mine during the first half of this year. Moreover, the forecast cash cost was very high at $1100-$1300/oz.
The reason we are mentioning CRK now is that its fundamentals have substantially improved thanks to its purchase, for a total price of about $100M, of the Australian mining operations of AuRico Gold (AUQ). AUQ gained ownership of these operations via its October-2011 acquisition of Northgate Minerals.
Taking into account the $1.2B price that AUQ paid for Northgate and the value that would likely have been attributed to Northgate's non-Australian assets, we estimate that AUQ paid about $500M for the mines that it has just agreed to sell to CRK for $105M. These mines are currently producing gold at the rate of about 170K ounces/year, which means that CRK is paying the equivalent of about $620/oz for the production. This is less than one-quarter of what we would consider fair value for gold production in a politically-stable region. Furthermore, only $80M of the $105M purchase price has to be paid now. The remainder is due in installments over the next three years.
The mines purchased by CRK don't have large defined resources, but past performance suggests that there is enough gold in the ground to maintain production for at least 10 years.
The addition of the new assets greatly improves CRK's valuation, increases its upside potential and reduces its risk. We aren't going to return CRK to the TSI List at this time, but we may do so in the future.
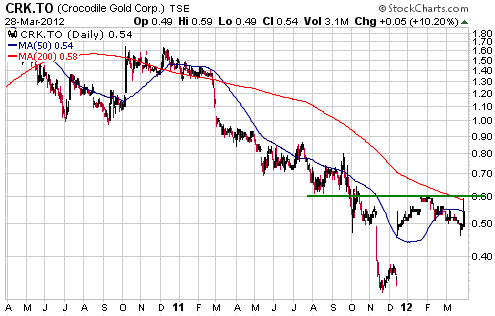
Chart Sources
Charts appearing in today's commentary
are courtesy of:
http://stockcharts.com/index.html

|

