|
- Interim Update 28th April 2010
Copyright
Reminder
The commentaries that appear at TSI
may not be distributed, in full or in part, without our written permission.
In particular, please note that the posting of extracts from TSI commentaries
at other web sites or providing links to TSI commentaries at other web
sites (for example, at discussion boards) without our written permission
is prohibited.
We reserve the right to immediately
terminate the subscription of any TSI subscriber who distributes the TSI
commentaries without our written permission.
The Stock Market
Intermediate-term US stock market outlook
Market tops (and bottoms) are only identifiable with the benefit of
hindsight. In real time, the most we can reasonably do is assess risk
versus potential reward.
The following factors should be taken into account when assessing the US stock market's risk and potential reward:
1. Sentiment
Sentiment indicators such as surveys, put/call ratios and volatility
indices currently reveal a remarkable lack of concern about downside
risk in the market. Sentiment is a contrary indicator (large declines
typically begin after investors have been lulled into believing that
the risk is minimal), meaning that this particular factor is decidedly
BEARISH right now.
2. Valuation
With the exception of the bubble period of 1998-2007, the US stock
market has never been more expensive than it is today. This factor is
therefore BEARISH.
3. Credit Spreads
Credit spreads (spreads between low quality and high quality debt
securities) have generally been contracting since March of 2009, which
is bullish. Our view is that credit spreads have become as narrow as
they are likely to get, but at this stage there is no evidence of a
trend reversal. This factor is therefore still BULLISH, but tenuously
so.
4. Monetary Policy and Conditions
The Fed continues to hold its interest rate target near zero and is
clearly willing to add money to the economy as deemed necessary to
prop-up prices. Also, although TMS's year-over-year growth rate has
tapered over the past few months, it is still above 10%. The monetary
situation is therefore BULLISH.
5. Inflation Expectations
We consider "inflation expectations" to be bullish for the broad stock
market when they are stable at a low positive level or falling from a
high level. This factor is currently BULLISH, because inflation
expectations are stable at a low positive level.
6. The T-Bond Yield
This factor is bullish when the T-Bond yield is trending downward and
bearish when it is trending upward. We think the T-Bond yield will soon
embark on a major upward trend, but we would define the current
situation as NEUTRAL because an upward trend has not yet been
established.
The last and the second-to-last factors are closely related in that
most major T-Bond trends are responses to major changes in inflation
expectations, but it is appropriate to view the T-Bond yield as a
separate factor at this time due to the increasing risk of a direct
debt default -- as opposed to an indirect default via inflation -- by
the US government.
The above factors, when taken together, point to a neutral
intermediate-term outlook for the stock market. However, we are bearish
due to our perception of the market's current position within its
long-term valuation cycle. Specifically, our perception is that a
secular bear market is still in progress, which means that a) we expect
the market to make progressively lower lows in REAL terms until it
becomes under-valued, and b) we see the potential for the next
intermediate-term decline to be much worse than a routine bull-market
correction.
Our bearish view is also supported by the "Presidential Cycle", which
points to an April peak followed by a downward trend to an October low.
Current Market Situation
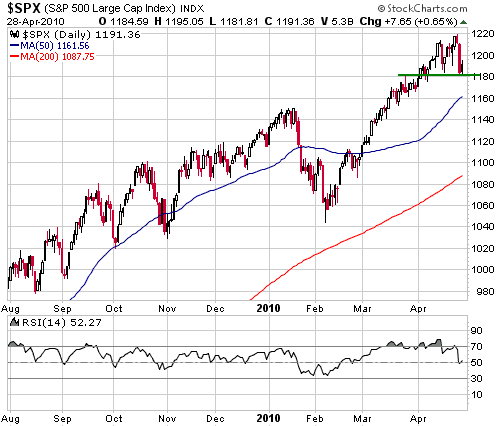
Depending on what happens during US trading on Thursday and Friday,
this could turn out to be a pivotal week. The reason is that if the
S&P500 Index achieves a daily close below 1180 prior to the end of
the week it will complete a key reversal to the downside, thus
providing us with the first price-related evidence of a top. Just to be
clear, up until now we've had a high-risk market environment but no
evidence that the upward trend had ended. A daily close below 1180
would provide that evidence.
Hong Kong's Hang Seng
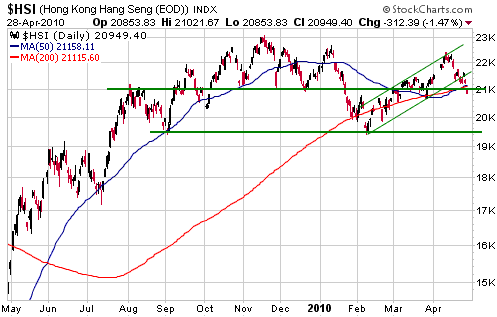
Index (HSI) is in a weaker position than the S&P500 Index in that
it peaked back in November and appears to have completed a
counter-trend rebound earlier this month. A decisive close below 21000
would be the next piece of evidence that Hong Kong's market is rolling
over to the downside.
A daily close below 21000 would create a chart-based target of 19500,
and a daily close below 19500 would suggest a target of 16000.
Gold and
the Dollar
Gold
Gold Versus Currencies
A point we have made numerous times over the years is that gold should
NOT be thought of as the "anti US$"; rather, it should be thought of as
the "anti fiat-currency". The reason is that gold rises in real terms
as the general level of confidence in government-sponsored money
declines. If, for instance, investors begin to lose confidence in the
US$ but not in the euro and the other major fiat currencies, then gold
will probably not fare particularly well in real terms because the
decline in the investment demand for dollars will be offset by a rise
in the investment demand for other fiat currencies. Only a general
decline in monetary confidence can bring about a major advance in the
real gold price.
For an historical example of what we are talking about we cite the
1978-1980 period. The biggest US$ gold price rally of the past 200
years extended from the second half of 1978 until January of 1980, and
it occurred in parallel with modest STRENGTH in the US dollar's foreign
exchange value.
A simple way to monitor how gold is performing in terms of currencies
other than the US$ is via the gold/UDN ratio. UDN is a fund that moves
inversely to the Dollar Index, meaning that UDN rises as the US$
weakens against the euro and other major currencies. Consequently, if
gold did nothing other than rise by enough to offset a decline in the
US dollar's foreign exchange value then the gold/UDN ratio would move
sideways.
The top half of the following chart shows that gold/UDN is in a strong
upward trend and is up by around 73% since the beginning of the
financial crisis in mid-2007. The bottom half of the chart shows that
gold is up by around 78% in US$ terms over the same period. In other
words, almost none of the gains made by gold since mid-2007 can be
explained by the change in the US dollar's foreign exchange value.

Current Market Situation
In the statement issued on Wednesday following its 2-day meeting, the
Fed expressed confidence in the economic recovery and then demonstrated
how confident it really is by reiterating its commitment to keep the
overnight interest rate near zero for an extended period.
It should be understood that maintaining an artificially low short-term
interest rate does not help the overall economy. Rather, it HURTS the
economy by discouraging saving and promoting mal-investment. For
example, the fact that there has been no net addition of real
(non-government) jobs to the US economy over the past 10 years is
largely an indirect result of the Fed's decision to suppress interest
rates during 2001-2005.
The artificially low short-term interest rate does, however, provide
substantial assistance to the banking industry. Banks get access to
free (or almost free) short-term money and then 'invest' this money in
Treasury Bonds, thus earning a no-risk spread and repairing their
balance sheets at the EXPENSE of the overall economy.
The gold market didn't react to the Fed's decision to leave the
"extended period" language in its latest policy statement. This could
mean that the market had already priced-in the continuation of the
Fed's bank support programme, or that Europe's government debt crisis
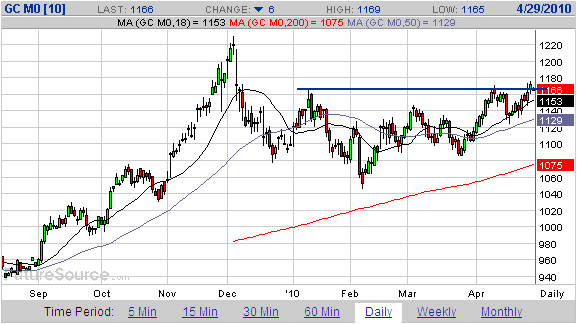
is trumping all other considerations. In any case, the daily chart of
US$ gold futures (see below) continues to evolve in a bullish manner.
The December peak will be the minimum target following a decisive break
above resistance in the low-$1160s, but the most likely target for the
next short-term peak will be $1250-$1300.
Gold Stocks
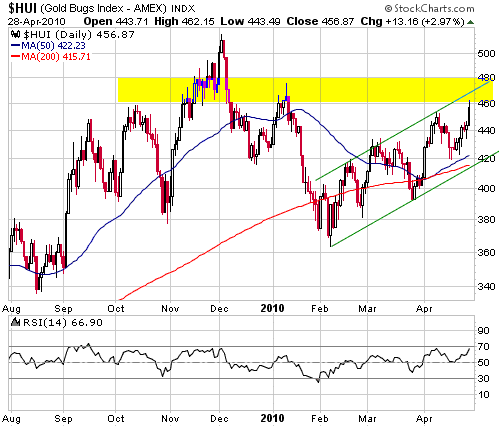
We have mentioned resistance at 470 as a likely target for the HUI's
next short-term peak. As depicted below, resistance actually begins at
460 and extends up to 480.
We are probably
either too bullish on gold bullion or not bullish enough on the HUI,
because it is difficult to imagine that the gold price could move up to
$1250-$1300 while the HUI remains below its December-2009 peak.
Currency Market Update
In our opinion, the relationship between the debt of the European
countries that have been grouped under the derogatory acronym "PIIGS"
and the global government debt market can be likened to the
relationship between US "sub-prime" mortgage debt and the overall US
mortgage market. There were a few false starts to the 2007-2008 crash
in the mortgage market as most people -- including all central bankers
and Treasury officials -- were, for quite a while, willing to believe
that the problem was contained within a relatively small section of the
overall market, but eventually it became apparent that "sub-prime" was
just the tip of the proverbial iceberg. Similarly, and notwithstanding
the profuse assurances of officialdom to the contrary, there is a high
probability that the problems currently being experienced by Greece
will spread and eventually develop into a broad-based government debt
crisis.
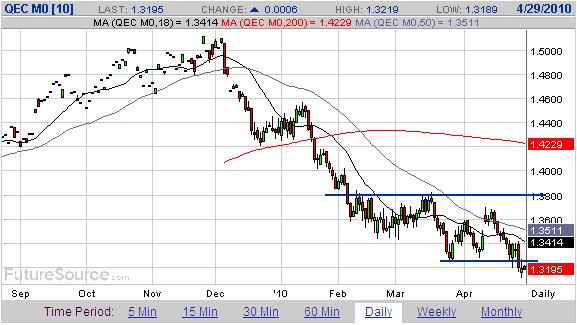
Because the government debt crisis is beginning in Europe, the euro is
likely to be a relatively weak currency for many more months. As noted
in an earlier commentary, we expect that the euro (EUR/USD) will trade
below 1.20 before this year is over.
The euro will not, however, move lower in a straight line. There will
be periods when it seems that the worst is over for PIIGS government
debt and when speculators will take profits on their bearish bets. We
have recently suspected that such a period was about to begin, but
downgrades of Greek and Portuguese government debt on Tuesday set in
motion another wave of speculative short-selling and pushed the euro
below support defined by its late-March low. Refer to the following
daily chart of June euro futures for details.
There is still a decent chance that a short-term euro rebound is about
to begin, but traders of currency futures should have been stopped out
of euro long positions on Tuesday.
Update
on Stock Selections
(Notes: 1) To review the complete list of current TSI stock selections, logon at http://www.speculative-investor.com/new/market_logon.asp
and then click on "Stock Selections" in the menu. When at the Stock
Selections page, click on a stock's symbol to bring-up an archive of
our comments on the stock in question. 2) The Small Stock Watch List is
located at http://www.speculative-investor.com/new/smallstockwatch.html)
 Fortuna Silver (TSX: FVI). Shares: 108M issued, 117M fully diluted. Recent price: C$2.15 Fortuna Silver (TSX: FVI). Shares: 108M issued, 117M fully diluted. Recent price: C$2.15
The stock market reacted very negatively over the first half of this
week to the results of the Pre-Feasibility Study (PFS) for FVI's San
Jose silver/gold project. The PFS showed an after-tax Net Present Value
(NPV) of only $36M at an 8% discount rate using metal prices of $15.12
and $897 for silver and gold. Also, the annual production forecast
contained in the PFS revealed a slower-than-expected ramp-up of the
project.
It seems to us that FVI's management is being very conservative and has
essentially presented a worst-case scenario in the PFS. Of particular
significance, the overall production from San Jose and the rate of
annual production growth are likely to be much greater than revealed by
the PFS due to the eventual conversion of "inferred" resources to
"measured and indicated" status (the PFS only considers the ounces that
are presently defined as "measured and indicated", which means that
almost half the deposit has been omitted from the current assessment).
Also, the 8% discount rate used by FVI is higher than the average rate
used by comparable companies (all else being equal, a higher discount
rate assumption leads to a lower NPV estimate).
The valuation-based target we have in mind for FVI is C$3.50/share,
which is based on the assumption that the company's total annual silver
production across its two projects will increase to about 5M ounces
over the coming three years. This target is far enough above the
current stock price to make FVI a reasonable candidate for new buying.

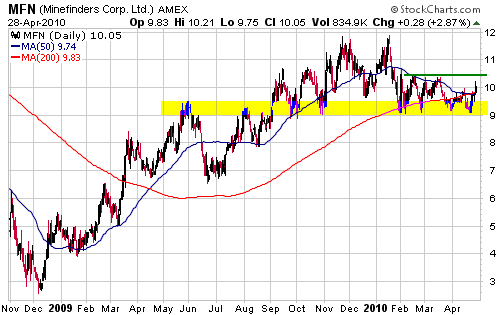
 Minefinders Corp. (AMEX: MFN). Shares: 66M issued, 74M fully diluted. Recent price: US$10.05 Minefinders Corp. (AMEX: MFN). Shares: 66M issued, 74M fully diluted. Recent price: US$10.05
In the 23rd November 2009 Weekly Update we said that MFN, a
Mexico-based gold/silver miner, would be fully valued at
US$12.00-$13.50. We suggested making a partial exit near its price at
the time of US$11.36 and a complete exit if it traded above US$13. The
stock ended up peaking below $13 and subsequently pulled back to
support at US$9.00-$9.50.
If "full valuation" were still at $12.00-$13.50 then we would probably
exit MFN now in order to make way for a stock with greater upside
potential, but our valuation-based target for this stock has risen in
response to the recently-announced results of a study into the
economics of including a mill at the Dolores project. The study showed
that a) annual gold-equivalent (gold plus silver) production would
increase from 180K to 270K ounces by spending about $160M on a mill, b)
the project's NPV (at a 5% discount rate) would rise to around $1.4B at
metal prices of $1100/oz and $17/oz for gold and silver, and c) the
mill could be in production by the second quarter of 2012.
If debt-financed, the mill addition would increase our valuation-based
target from $13/share to $17/share at current metal prices. Also, the
increase in production would make MFN look more attractive to
acquisitive large-cap gold producers.
 Great Basin Gold (AMEX and TSX: GBG). Shares: 333M issued, 438M fully diluted. Recent price: US$1.82 Great Basin Gold (AMEX and TSX: GBG). Shares: 333M issued, 438M fully diluted. Recent price: US$1.82
It has been slow progress for GBG over the past year, but the following
chart shows that it has just nudged above short-term resistance at
US$1.80. This could be an early warning that a stronger advance is
about to begin.
Traders could take a position in GBG near the current price in
anticipation of a move up to $2.50-$2.75, using a daily close below
$1.60 as the initial 'stop' and switching to a 10% trailing stop after
the price closes above $2.00.
 Catalpa
Resource (CAH), Dominion Mining (DOM) and Resolute Mining (RSG), our
three Australia-listed gold producers, are suitable for new buying near
their current prices (A$1.59 for CAH, A$3.01 for DOM, and A$1.21 for
RSG). Catalpa
Resource (CAH), Dominion Mining (DOM) and Resolute Mining (RSG), our
three Australia-listed gold producers, are suitable for new buying near
their current prices (A$1.59 for CAH, A$3.01 for DOM, and A$1.21 for
RSG).
Chart Sources
Charts appearing in today's commentary
are courtesy of:
http://stockcharts.com/index.html
http://www.futuresource.com/

|

