|
- Interim Update 28th June 2006
Copyright
Reminder
The commentaries that appear at TSI
may not be distributed, in full or in part, without our written permission.
In particular, please note that the posting of extracts from TSI commentaries
at other web sites or providing links to TSI commentaries at other web
sites (for example, at discussion boards) without our written permission
is prohibited.
We reserve the right to immediately
terminate the subscription of any TSI subscriber who distributes the TSI
commentaries without our written permission.
Reminder: No Weekly Update on Sunday 2nd July
The next commentary will be the Interim Update on Thursday 6th July.
US$ Drivers and Non-Drivers
In his latest "Outside the Box" letter at http://www.investorsinsight.com/otb.aspx,
John Mauldin presents some interesting analysis from GaveKal. GaveKal
argue that the US$ is going to strengthen, but while we agree with this
conclusion -- at least as far as the next 6 months are concerned -- we
think their reasoning contains major flaws. The flaws are important so
we thought we'd briefly address them in today's commentary.
Almost all the international trade in oil is conducted in US dollars,
which means, according to GaveKal, that a higher price of oil will
create additional demand for dollars and, therefore, that a rising oil
price is bullish for the dollar. This 'logic' is back-to-front,
however, because one of the main reasons for the higher US$ oil price
is WEAKNESS in the US$.
It is true that higher prices will tend to increase the demand for a
currency (if prices are higher then more money will be needed for each
purchase), but this is not a 'chicken or the egg' situation because
prices wouldn't have risen in the first place unless there had been an
increase in the supply of the currency relative to the demand for the
currency. The way it works is that inflation (growth in the supply of
money) causes the purchasing power of a currency to fall, resulting in
an increase in the demand for the currency. (The current price of
anything, including currencies, is, by definition, the price that
brings supply and demand into balance; so an increase in supply will
always lead to a corresponding increase in demand and, most likely, a
lower price). But if this increase in currency demand is followed by a
further increase in currency supply then more purchasing power is lost,
prices rise again and more currency is then needed to complete each
transaction (there's a further increase in the demand for currency).
This process will continue until the currency becomes completely
worthless or until the inflation ends.
The GaveKal argument is, in effect, that a loss in the dollar's value
relative to oil is BULLISH for the dollar, which implies that the
faster the dollar loses its purchasing power the more bullish it will
be. This is, of course, ridiculous.
Another fallacy in the GaveKal piece is contained in the following statement: "Given
that the world needs US$ to trade, the US is sort of forced to run a
current account deficit and export US$ (otherwise, how would Nokia get
the US$ to fund its purchases in Taiwan?). This explains why
improvements in the US current account deficit usually lead to global
economic meltdowns somewhere in the world - all of a sudden, there are
not enough US$ to go around...".
The fact is that the world could make do with almost any quantity of US
dollars; the purchasing power of the US$ would simply adjust based on
the dollar's supply relative to its demand. Obviously, if the global
supply of dollars were to suddenly contract then this could cause big
problems because today's price levels for assets, debt, commodities,
and everything else are based on the current dollar supply. However, if
dollar inflation had been consistently lower over the past 20 years
such that the total supply of dollars was now half its current level
there would be no dollar shortage; instead, each dollar would buy, on
average, twice as much as it currently buys.
We are in full agreement with the notion that a contraction in the US
current account deficit would be accompanied by a global economic
downturn, but implying that the reduction in the current account
deficit was the root cause of the subsequent economic downturn would be
akin to saying that a lack of drugs was the root cause of the sickness
felt by a drug addict who was trying to 'kick the habit'. The financial
system has become addicted to a high level of inflation and the
solution, according to GaveKal and many others, is to continue 'feeding
the habit'.
On a side note, there will be no danger of the gold bull market coming
to an end as long as continuing to 'feed the habit' is widely believed
to be the right economic remedy.
From trade deficits to budget deficits to GDP-growth differences to the
absurd "massive dollar short position" theory, we never cease to be
impressed by the large number of irrelevant factors that are regularly
put forward to explain and forecast currency exchange rates. In our
opinion, the only things that matter over long time periods (periods
exceeding 5 years) are inflation rate differentials. Specifically, if
Currency A is inflated at a faster rate than Currency B over a long
period, causing it to lose its purchasing power at a faster rate, then
Currency A will be in a long-term downward trend relative to Currency
B. End of story.
Over shorter time periods (periods of 6 months to 2 years) the only
things that matter are real interest rates and interest rate spreads,
where the real interest rate is calculated by subtracting the EXPECTED
rate of currency depreciation from the nominal interest rate. Interest
rate differentials suggest that the dollar's exchange rate is going to
be higher in 6 months time than it is today.
The Stock Market
Current Market Situation
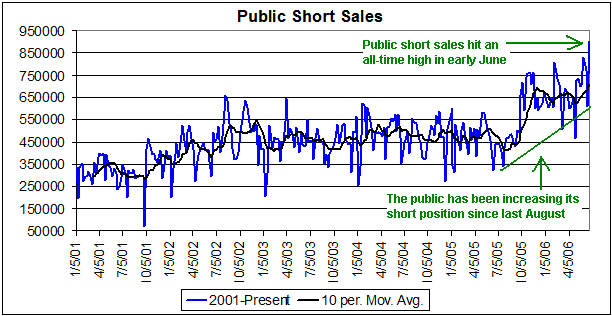
Below is a chart, courtesy of http://www.nasdaqwizard.com/,
showing the total number of NYSE-traded shares sold 'short' by the
public. The NYSE reports short-selling statistics with a 2-3 week lag,
so the last point on the chart shows the situation in early June. At
that time the public was short to the tune of around 900M shares, up
from around 470M at the end of April this year and 350M at the end of
July last year.
The question is: did the public, for probably the first time in
history, correctly anticipate a major stock market decline by
'shorting' quite aggressively during the months leading up to the peak
and substantially increasing its short position during the weeks
immediately following the peak, or will the market rally enough over
the next few months to prompt a change in the public's stance BEFORE a
large decline gets underway?
Our guess is that it
will be the latter. For anyone anticipating a tradable rebound the
concern, though, is that there haven't yet been many positive
divergences in the price action. That is, other than the sort of
negativity that tends to be associated with intermediate-term bottoms
in the stock market there aren't yet any signs that we've reached a
point where the risk/reward is materially skewed in favour of being
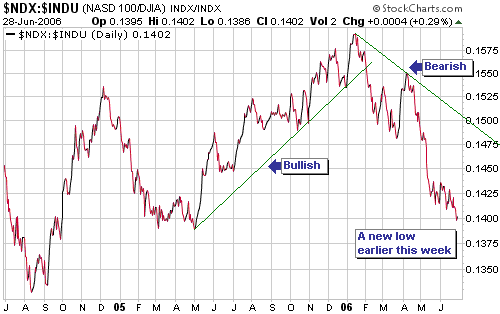
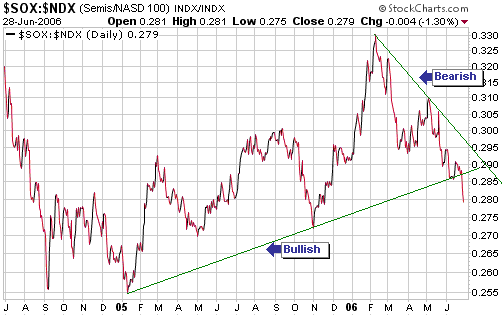
'long'. For example, the following charts show that the NDX/Dow ratio
(the NASDAQ100 Index divided by the Dow Industrials Index) and the
SOX/NDX ratio (the Semiconductor Index divided by the NASDAQ100 Index)
have both just moved to new lows for the year, telling us that demand
is continuing to shift away from investments that are perceived to have
greater risk (the NDX is generally considered to be riskier than the
Dow and the SOX is generally considered to be riskier than the NDX). As
long as investors are becoming increasingly risk averse our
intermediate-term outlook can't be anything other than bearish.
Our intermediate-term outlook therefore remains unequivocally bearish.
However, we continue to think that the most likely scenario involves a
1-3 month rebound prior to the next leg down.
Suggested Action
Since 14th June we've been suggesting that bearish speculations (put
options, etc.) be reduced. Also, in recent commentaries we've said that
our intention was to exit all remaining put option positions in the TSI
Stocks List following a test of the mid-June lows. The S&P500 and
the Dow are yet to test their lows, but this week's decline took the
NDX to within a few points of its 13th June bottom.
It won't be surprising if a full test of the mid-June lows occurs
within the coming week or so with some indices briefly spiking to new
lows while others make higher lows. However, the market is so
'oversold' that it will also not be surprising if a strong rebound
begins immediately. The bottom line is: there aren't yet any signs that
we've reached a point where the risk/reward is materially skewed in
favour of being 'long', but neither does it make sense to bet on the
market making a big downward move over the coming months.
Further to the above, we've decided to immediately exit the remaining
put-option positions in the TSI List. If things go roughly according to
plan we may initiate new bearish positions later this year, but at this
time we like the look of the sidelines.
If the market ignores its current 'oversold' extreme and continues to
decline then an important low will probably be in place before the end
of July. In this case we will miss the opportunity to profit from the
decline, but will look for opportunities to profit from the ensuing
rally.
Gold and
the Dollar
Waiting for the Fed
The Fed is almost certainly going to hike the official short-term
interest rate by 0.25% later today (Thursday 29 June) and confirm that
it remains in 'tightening mode'. This is what we think and, judging by
the current prices of Fed Funds futures contracts, what the market
thinks. However, does it really matter whether the Fed hikes by 0.25%
or by 0.50%? Is an extra 0.25% really going to make that much
difference to the outlooks for inflation and economic growth?
Similarly, later this year when the Bank of Japan finally moves the
official Japanese short-term interest rate from zero to 0.25% or 0.50%
or some other low number is it really going to make any difference to
the Japanese economy or even to the appeal of the Yen carry trade?
In our opinion, an extra 0.25% here or there can't possibly have much
effect on the fundamentals. However, that doesn't mean the financial
markets won't make big moves in reaction to, or in anticipation of,
these baby-step changes in monetary policy. At the present time, for
instance, a number of important markets are in positions where they are
likely to break upward or downward in response to Thursday's
announcement by the Fed. Here are some of the most notable examples:
1. Gold
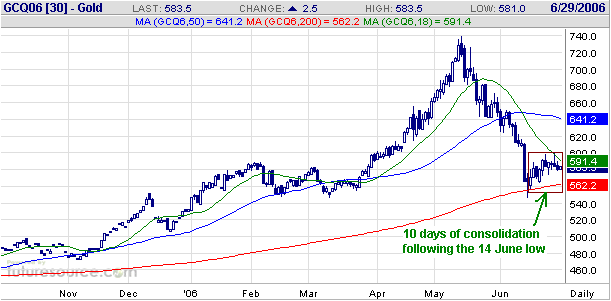
The following daily chart shows that August gold futures have just
completed their 10th day of consolidation. Consolidation patterns
within short-term trends usually don't last more than 8 trading days,
so the fact that gold is now entering its 11th day of upward drift
following the 14th June low suggests, to us, that the probability of an
upside breakout from this pattern is now higher than the probability of
a downside breakout. If gold does break higher (a move above $600 would
constitute an upside breakout) then $640 would become a likely
near-term target.
By the way, silver and copper find themselves in similar positions to gold in the lead-up to the Fed announcement.
From a long- or intermediate-term perspective gold is a very low-risk
buy near Wednesday's closing price of $580 and has been a low-risk buy
over the past two weeks. This is because the downside risk is probably
limited to a test of the former long-term resistance (now support) at
$510. The increased probability of an upside breakout from the recent
consolidation suggests that a relatively low-risk buying opportunity is
also at hand for those with a short-term focus, but we aren't going to
get into the business of providing short-term trading recommendations
for gold. Our approach is to use short-term volatility to build-up
longer-term positions at attractive prices.
2. Bonds
10-year T-Note futures ended Wednesday's trading session at a new
multi-year low, but despite having fallen on 10 of the past 11 trading
days the September 30-year T-Bond futures contract (see chart below)
remains slightly above last month's low. It is therefore in a position
where any significant weakness in the aftermath of today's monetary
policy announcement would result in an important breakdown.
3. The Canadian Dollar
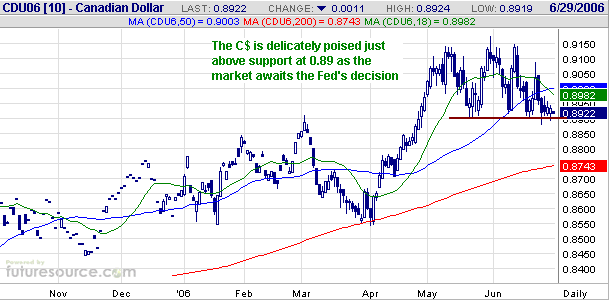
The following chart shows that the September CAD futures contract has
tested support at 0.89 several times over the past month and ended
Wednesday's session just above this support. It is therefore
precariously poised as the markets await the Fed's announcement. Over
the final two trading days of the week, the month and the quarter, the
C$ is either going to break down or it is going to complete another
successful test of support and embark on a rally that will probably
take it to a new high for the year.
By the way, if gold,
industrial metals, the C$ and the stock market rally during the days
following Thursday's Fed rate hike it will be a clear sign that
monetary policy is not yet tight enough and that additional rate hikes
are going to occur regardless of what the Fed happens to say in its
monetary policy statement.
Gold and the Dollar
Inter-market relationships can be unclear in real time because the
markets will sometimes do things that throw us off the track. For this
reason it's sometimes only possible to see the relationships with the
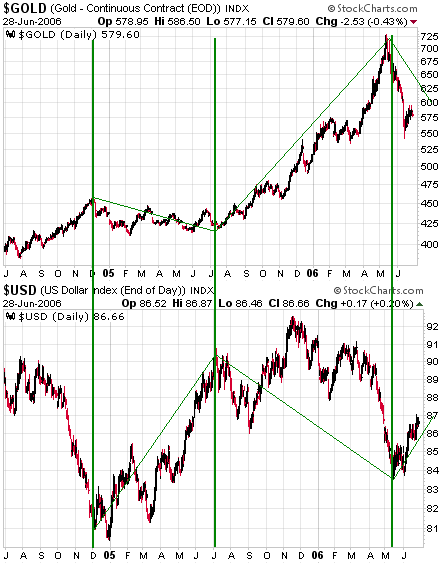
benefit of hindsight. For example, over much of the past year gold
appeared to be rallying alongside the US$, prompting many observers to
conclude that gold had de-coupled from the currency market and,
therefore, that the traditional inverse correlation between gold and
the dollar was no longer applicable. But when we step back and compare
charts of the US$ gold price and the Dollar Index we see that the
traditional relationship remains in place.
Further to the above and with reference to the following chart
comparison, notice that it was really just a 2.5-month divergence
during September-November of last year that created the illusion that
gold was no longer inversely correlated to the US$. This 2.5-month
period provided us with the only significant divergence of the past two
years, but note that there have been many similar divergences over the
past 35 years (over the past 35 years there have been many multi-month
periods during which the gold and currency markets have appeared to
de-couple only to subsequently re-couple).
The one thing that
did appear to change last year was that gold demonstrated an ability to
hold up in the face of US$ strength. Specifically, the US$ was very
strong during the first half of 2005, but rather than trending lower in
response to this dollar strength the gold price moved sideways. We
won't be surprised if something similar (gold oscillating within a
horizontal range while the dollar trends higher) happens over the next
few months.
Gold and Silver Stocks
Current Market Situation
We continue to believe that the correction that began in May will last
until at least November. A correction of this duration would be
consistent with a) the intermediate-term corrections that occurred
during 2001-2003, b) our forecast for a strengthening US$ over the
coming 6 months, and c) our belief that the broad stock market hasn't
yet reached its ultimate correction low. We also continue to believe
that the gold stocks indices have seen their price lows for the
correction. What we are anticipating is, in effect, a multi-month
period of base-building prior to the start of the next
intermediate-term advance.
With regard to the path that will be taken by the gold stock indices as
they complete the corrective process, our best guess was drawn on the
XAU chart included in the latest Weekly Market Update. The projection
drawn on this chart showed an initial rebound peak within the next
couple of weeks followed by a pullback (a potential test of the June
low), a rally to a higher rebound peak (in September), and then by a
sharp decline to re-test the June low.
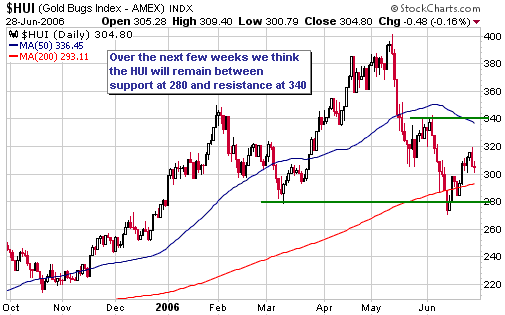
With reference to the following daily chart of the HUI, it's possible
that the initial rebound peak could be near resistance at 340. However,
a lot depends on how the various markets react to today's monetary
policy announcement.
The SA Gold Stocks
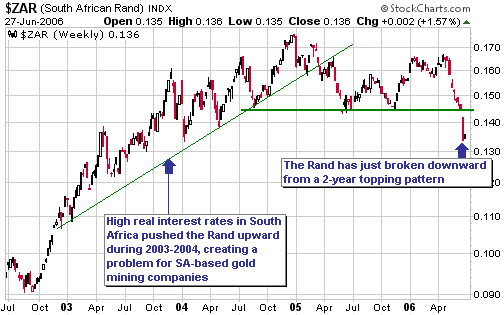
A rally in the South African Rand during 2003-2004 created a strong
headwind for the SA-based gold mining companies. These companies' costs
were increasing at a rapid rate and the currency in which the costs
were denominated was rapidly gaining in value against the US$, a
combination that turned profitable mining operations into loss-making
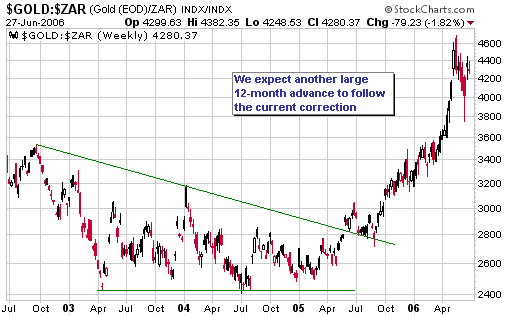
ones. However, the Rand recently broke downward from a 2-year topping
pattern (refer to the following weekly chart for details), meaning that
the headwind has become a tailwind.
Once underway, trends
in the currency market generally continue for years, so it's reasonable
to expect additional weakness in the Rand relative to the US$ over the
coming 12 months. At the same time, there does not appear to be
substantial downside risk in the US$ gold price and the downside that
does occur in the gold market is likely to be accompanied by
broad-based strength in the US$ (weakness in the Rand). Therefore, as
far as the coming year is concerned there appears to be a lot of upside
potential and minimal downside risk in the Rand gold price.
The SA-based gold
miners should report good financial results for the current quarter
and, further to the above, the results of these companies should
continue to improve over the coming 12 months. Furthermore, a
significant improvement in financial performance does not appear to be
factored into current stock prices. We therefore think that investors
should use pullbacks in the gold sector to accumulate the stocks of
Harmony Gold (NYSE: HMY), Gold Fields Ltd (NYSE: GFI) and, for those
prepared to take-on more risk in exchange for the potential to earn a
much greater return, DRDGold (NASDAQ: DROOY).
Update
on Stock Selections
(Note: To review the complete list of current TSI stock selections, logon at http://www.speculative-investor.com/new/market_logon.asp
and then click on "Stock Selections" in the menu. When at the Stock
Selections page, click on a stock's symbol to bring-up an archive of our comments on the stock in question)
 Junior exploration plays Junior exploration plays
The major mining stocks will often make their price bottoms amidst
high-volume liquidations, but more often than not the smallest mining
stocks make their bottoms during periods when trading volumes are so
low that they barely trade at all. When the small exploration-stage
mining stocks are bottoming what we typically see is a total lack of
interest on the buy-side of the market such that each small parcel that
is put up for sale pushes the price a bit lower.
The bottoming process for the smallest mining stocks will generally
entail several months of aimless drifting, and with trading volumes
having recently collapsed it is clear that this process is now
underway. Some stocks will buck the trend due to company-specific news,
but there's a good chance that opportunities to realise profits will be
few and far between. This is the perfect time for planting because the
general lack of interest creates terrific bargains; just don't expect
to be doing any harvesting for a while.
Today we are going to take a look at two opportunities to buy in-ground
metal and future production potential at bargain-basement levels. The
first of these opportunities is a current member of the TSI Stocks List
while the second is an addition to the List.
The first stock is Apogee Minerals (TSXV: APE). At Wednesday's closing price of C$0.75 APE has a market capitalisation of around US$35M.
APE's market cap is very low considering that:
a) The company is well financed
b) Based on historical data and recent drilling results it is very
likely that the company's 60%-owned Pulacayo-Paca Project hosts a large
and economically viable silver-zinc deposit (a NI 43-101 resource is
scheduled to be completed later this year)
c) Apogee is a silver/zinc/lead producer as well as an explorer (the
company's 100%-owned La Solucion mine is currently producing at the
annual rate of 900K silver-equivalent ounces)
One of the reasons for APE's low valuation is the fact that its
projects are located in Bolivia, but we think the market is
over-estimating the country risk. Our thinking is that the Bolivian
Government would have nothing to gain and a lot to lose by either
expropriating development-stage mining assets or imposing onerous
financial conditions on foreign mining companies.
After experiencing a panic liquidation during the first half of May on
the back of Bolivia-related fears, APE is now into the low-volume
"aimless drifting" bottoming phase described above.

The second stock -- a new addition -- is Sabina Silver (TSXV: SBB).
Sabina was brought to our attention by Danny Deadlock, a friend of ours and proprietor of Microcap.com.
The stocks that Danny follows in his newsletter are generally smaller
and more speculative than the ones we follow at TSI, but occasionally
there's some overlap (occasionally there's a stock that's small enough
for Microcap.com and large enough for TSI). SBB, which has a market cap
of C$47M at Wednesday's closing price of C$1.00, is such a stock.
When Danny first mentioned SBB it seemed, to us, that it was too good
to be true. But when we investigated it ourselves we came away with the
impression that it is even better than it first seemed. Here are the
salient details:
1. The company's main project is the Hackett River poly-metallic
(primarily zinc and silver) project in the Nunavut region of Canada.
SBB owns 100% of the project, although future production would be
subject to a 2% net smelter royalty (to Cominco) and a 10% net profits
royalty (to Etruscan).
2. Hackett River contains a good quality indicated resource of 130M
ounces silver, 3.6B pounds zinc, 280M pounds copper, 500M pounds lead,
and 470K ounces gold.
3. At current metal prices, the above resource equates to US$7.6B of in-ground metal.
4. The deposit is open to expansion and WILL increase as a result of a 17000m drilling program currently underway.
5. A scoping study for Hackett River, incorporating a discounted cash flow analysis, is scheduled to be completed by year-end.
As noted above, SBB's current market cap is C$47M. However, the company
has around C$27M of cash and liquid investments (C$15M of cash + 4M
shares of Wolfden Resources) so its enterprise value is only C$20M
(US$18M). Therefore, what we have here is a company with an enterprise
value of only US$18M that controls US$7.6B of in-ground metal (in the
"indicated" category) in a relatively low-risk part of the world. Even
if SBB were only being valued at 1% of the value of Hackett River's
in-ground metal it would have an enterprise value of US$76M.
Technically, the stock has considerable support in the C$0.80-C$1.00
range (see chart below) and given its incredible value we'd be
extremely surprised if this support were breached.
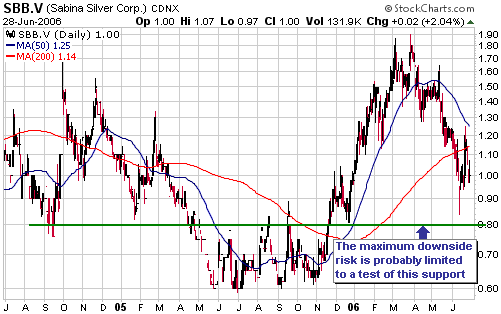
The bottom line: we think SBB has an excellent risk/reward within 10% or so of Wednesday's closing price.
Chart Sources
Charts appearing in today's commentary
are courtesy of:
http://stockcharts.com/index.html
http://www.futuresource.com/

|

