![]()
![]()
![]()
![]()
- Interim Update 28th June 2017
Copyright
Reminder
The commentaries that appear at TSI
may not be distributed, in full or in part, without our written permission.
In particular, please note that the posting of extracts from TSI commentaries
at other web sites or providing links to TSI commentaries at other web
sites (for example, at discussion boards) without our written permission
is prohibited.
We reserve the right to immediately
terminate the subscription of any TSI subscriber who distributes the TSI
commentaries without our written permission.
Long-term wealth
destruction machines
The stocks of gold and
silver-mining companies can be good investments for periods of up to a few
years, but investors should understand that under the current monetary
system these companies are almost guaranteed to destroy wealth over the
long term. The main reason is that gold and silver mining companies are
affected in a similar-but-magnified way by the boom-bust swings that
adversely affect the entire economy. We've covered this issue in the past,
but it's important enough to revisit from time to time.
In the same
way that the mal-investment fostered by the Fed's monetary inflation has
caused the US economy to effectively stagnate over the past 17 years, the
bad investment decisions fostered by the periodic floods of money towards
gold mining have made the industry inefficient. That is, just as the
economic busts that follow the central-bank-promoted economic booms tend
to wipe out all the gains made during the booms, the gold-mining industry
experiences a boom-bust cycle of its own with even worse results. The
difference is that the booms in gold mining roughly coincide with the
busts in the broad economy.
The crux of the matter is that when the
financial/banking system appears to be in trouble or it is widely feared
that central banks are playing fast and loose with the official money, the
stock and bond markets are perceived to be less attractive and
gold-related investments are perceived to be more attractive. However, the
gold sector to the stock and bond markets is like an ant to an elephant,
so the aforementioned shift in investment demand results in far more money
making its way towards the gold-mining industry than can be used
efficiently. Geology exacerbates the difficulty of putting the money to
work efficiently, in that gold mines typically aren't as scalable as, for
example, base-metal mines or oil-sands operations.
First Majestic
Silver (FR.TO) and Yamana Gold (AUY) are two of the countless examples of
long-term wealth destruction within the gold/silver sector. These
companies have experienced strong growth and have been enormously
profitable at times over the past 12 years, but over the entire period
they have both generated large cumulative losses despite the metals they
produce having roughly tripled in price.
FR managed to generate a
cumulative loss over this 12-year period of about US$53M, which is
obviously not good. However, FR's lousy overall performance pales in
comparison to the wealth destruction accomplished by AUY.
AUY has
achieved a cumulative loss of more than US$3B since 2004. To put this in
perspective, the market cap of the company is currently about US$2.5B,
meaning that over the course of a period in which the gold price gained
more than 200% this gold producer accumulated losses that are more than
the current market value of the entire company. That's part of why AUY
shares do not offer good value right now despite being priced no higher
than they were in 2004.
Gold itself is not made less valuable by the monetary-inflation-caused
inefficiencies and widespread wastage that periodically beset the
gold-mining industry, which explains why gold bullion has been making
higher highs and higher lows relative to the average gold-mining stock
since the late-1960s. The following weekly chart shows the gory details.
In particular, the chart shows that gold-mining stocks, as represented by
the Barrons Gold Mining Index (BGMI) up to 1996 and the HUI thereafter,
have been in a downward trend relative to gold bullion for almost 50
years. There's no good reason to expect this downward trend to end while
the current monetary system remains in place.
There is a lot of money to be made from investing in gold stocks --
even the spectacular wealth destroyers such as AUY -- at the appropriate
times. However, it's important for investors to understand that regardless
of how cheap the stocks are relative to gold bullion at the time of
purchase, eventually they are going to be even cheaper. Opportunities to
realise large profits should therefore always be taken and gold-mining
stocks should never be thought of as heirlooms to be passed on to the next
generation.
The Stock Market
The US
A downtick in NYSE Margin Debt
It's way too soon to know if this is significant, but it's worth
mentioning that NYSE Margin Debt dropped a little in May (the figure for
May was published this week).
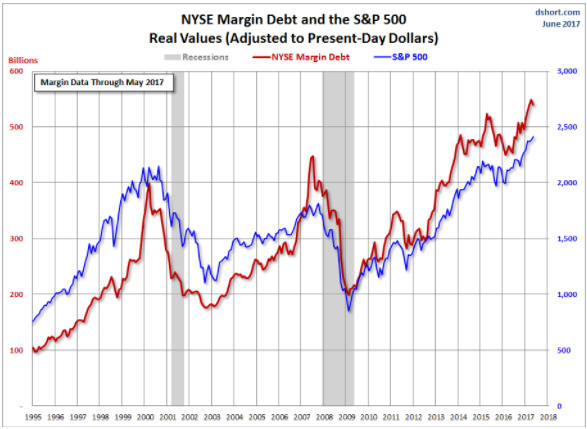
Chart source:
Advisor Perspectives
The monthly margin-debt figure is of
interest to us because it is the most direct indication of stock-market
leverage and because regardless of how expensive the market is there will
not be a major top as long as leverage is increasing.
Current Market Situation
The price
action during the first two days of this week looked bearish for the
NASDAQ100 Index (NDX), with the index initially rising and then abruptly
reversing course. However, short-term support at 5650 held and there was
an upward reversal on Wednesday.
With this Friday being the end of
the month and the quarter, short-term bearish traders should allow for
some additional strength in the NDX over the final two days of the week in
response to 'window dressing' by funds that have big positions in the
handful of stocks that have dominated the NDX and the entire market since
the beginning of the year. However, the potential for a quick and sizable
decline will remain as long as the end-of-quarter window-dressing doesn't
enable the NDX to close above its early-June peak.
The ProShares UltraShort QQQ (QID) is still a reasonable short-term
speculation provided that a) it is bought when the NDX is below, but
within a few percent of, its early-June peak, and b) a daily-closing
loss-limiting stop is placed slightly above the early-June peak.
Interestingly, the recent signs of weakness in the NDX have been
accompanied by signs of strength in the steel sector of the US stock
market. Refer to the following daily chart of SLX (the VanEck Steel ETF)
for details.
The recent strength in the steel sector appears to be at least partly
caused by non-subtle hints from the Trump Administration that it will soon
implement further measures to protect this industry from international
competition. The measures would probably include new tariffs and/or import
quotas, resulting in higher prices for steel in the US and greater profits
for US steel producers.
All measures undertaken by governments to
limit trade or to make trade more costly are counter-productive and
therefore stupid (assuming that a stronger economy is the goal), but
additional measures to protect US steel producers would be stupid almost
beyond belief. This is because the steel-producing sector of the US
economy is tiny relative to the steel-using sector of the US economy. For
example, steel-using businesses (autos, construction, etc.) employ
10-times more people than steel-producing businesses. For another example,
the value added by the US steel industry is about 0.2% of GDP whereas the
value added by companies that use steel in manufacturing processes is 5.8%
of GDP.
Anyhow, regardless of the fundamental reasons (if any)
behind it, SLX's recent reversal of fortune could be part of a 'changing
of the guard' that will result in commodity-related equities generally
performing much better than the likes of the "TFAANGs" during the second
half of this year.
Europe
The EURO STOXX 50
Index (STOX5E) has spiked down to and rebounded from the 3500 level twice
over the past 10 trading days. This support level (3500) must be breached
to signal that something more than a routine short-term correction is
occurring.
Gold and the Dollar
Gold
The
200-day MA (near $1240) was reaffirmed as short-term support for the US$
gold price on Monday 26th June when the price spiked below this MA
intraday and then rebounded to end the day above it. Therefore, it would
continue to make sense for bullish traders to use a daily close below the
200-day MA as a stop. Short-term resistance begins with the 50-day MA in
the high-$1250s, so oscillations between $1240 and the high-$1250s can be
viewed as irrelevant 'noise'.

While an important June-July low for the US$-denominated gold price is
no longer likely, there is a good chance of an important June-July low for
the euro-denominated gold price (gold/euro).
As illustrated by the
following daily chart, gold/euro broke below lateral support during the
first half of this week and ended the 28th June session at a new low for
the year. Moreover, the 28th June close was only 18 euros above the
December-2016 bottom, meaning that gold/euro is currently within 18 euros
of a 12-month low.
The weakness in gold/euro is mainly due to what
we perceive to be unsustainable strength in the euro. A July reversal is
likely.
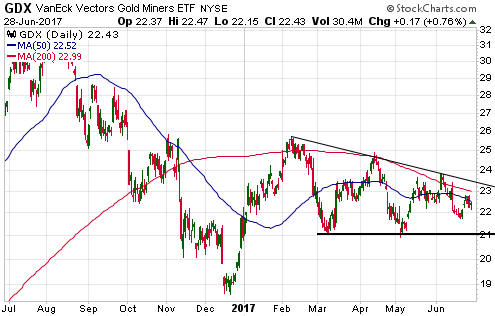
Gold Stocks
Current
Market Situation
The gold-mining indices and ETFs
consolidated over the first three days of this week. The consolidation was
minor and didn't affect the short-term bullish potential suggested by last
week's price action.
As mentioned in the latest Weekly Update,
nimble traders could buy GDX or GOEX for multi-week trades and set initial
daily-closing stops slightly below last week's lows ($21.59 for GDX and
$21.75 for GOEX). The stops are very important because if these ETFs close
below last week's lows then they could go a lot lower before making
short-term bottoms.
The Currency Market
The euro broke out to a
new high for the year on Tuesday and followed through to the upside on
Wednesday. The catalyst was a hint from ECB chief Draghi that the ECB's
"inflation"-promoting actions had been sufficiently successful to enable
the tapering of its bond-buying within the next few months. However, the
preceding inability of the Dollar Index (DX) to break above resistance at
97.5 (the DX is effectively the reciprocal of the euro) warned that an
upside breakout in the euro and a corresponding downside breakout in the
DX was possibly in store.
There are four reasons to suspect that
this week's breakouts in the euro and the DX will turn out to be
trend-ending moves. They are:
1) As illustrated by the following
chart, the euro is now close to a range of intermediate-term resistance.
2) The DX's weakness has not yet been confirmed by the gold market.
Specifically, with other gold-price drivers evenly balanced we would
expect the bullion market and the gold-mining sector of the stock market
to be much stronger IF the DX had commenced a major downward trend.
3) The DX has just fallen to its 150-week MA, which is similar to what
it did in 1999 prior to the start of a substantial rally. Refer to the
following weekly chart for details.
4) The euro's Commitments of Traders (COT) situation is bearish.
That being said, from a risk/reward perspective this is not a good
time to make a sizable bet on the DX and against the euro. There are two
reasons: First, although it is not the most likely scenario there is a
realistic chance that the DX has made a major top and will accelerate to
the downside over the next few months. Second, until there is a short-term
reversal it will not be clear where a risk-limiting stop should be placed.
If there is a reversal over the days ahead then we will consider
adding a DX-bullish/euro-bearish trading position via the ProShares
UltraShort Euro ETF (EUO).
Updates on Stock Selections
Notes: 1) To review the complete list of current TSI stock selections, logon at
http://www.speculative-investor.com/new/market_logon.asp
and then click on "Stock Selections" in the menu. When at the Stock
Selections page, click on a stock's symbol to bring-up an archive of
our comments on the stock in question. 2) The Small Stock Watch List is
located at http://www.speculative-investor.com/new/smallstockwatch.html
![]() US
Gold Corp. officially changes its name to US Gold Corp.
US
Gold Corp. officially changes its name to US Gold Corp.
We
recently added US Gold Corp. to the TSI Small Stocks Watch List. At the
time it was called Dataram and was trading on the NASDAQ under the symbol
DRAM, but it is now officially called US Gold Corp. and trades on the
NASDAQ under the symbol USAU. There are only 12.7M shares outstanding.
The symbol change became effective on 26th June and on that day there
was a high-volume decline in the stock from around US$3.00 to the
US$2.30s. We don't know why. The stock then quickly returned to around
US$3.00, which could mean that the spike down to the $2.30s established a
sustainable low.
USAU's current value is underpinned by the Copper
King gold-copper project in Wyoming. This project has a roughly 1M-oz gold
resource and a PEA that suggests economic viability at the current gold
price. However, a large (multi-hundred-percent) rise in the stock price
probably depends on exploration success at the Keystone gold project in
Nevada. To get this type of rise in the stock price the exploration team
won't have to generate results confirming that Keystone hosts an
economically-viable deposit, but it will have to generate results that
suggest the potential for such a deposit.
Drill targets are in the
process of being defined and exploration drilling is expected to begin
during the final quarter of this year.
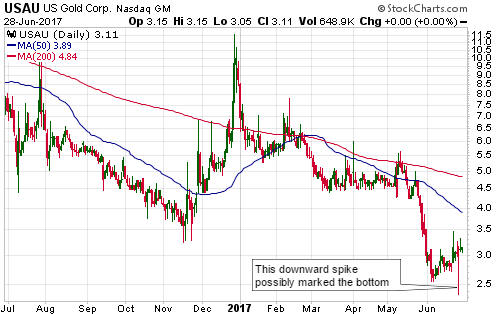
Chart Sources
Charts appearing in today's commentary
are courtesy of:
http://stockcharts.com/index.html
![]()