![]()
![]()
![]()
![]()
- Interim Update 28th October 2020
Copyright
Reminder
The commentaries that appear at TSI
may not be distributed, in full or in part, without our written permission.
In particular, please note that the posting of extracts from TSI commentaries
at other web sites or providing links to TSI commentaries at other web
sites (for example, at discussion boards) without our written permission
is prohibited.
We reserve the right to immediately
terminate the subscription of any TSI subscriber who distributes the TSI
commentaries without our written permission.
Too much bond
bearishness
It's likely that central banks
will keep their collective boot on rates at the short end of the curve for
at least another year, but due to increasing fear of inflation we expect
that there will be irresistible upward pressure on yields at the long end
of the curve in 2021. Right here and now, however, this line of thinking
appears to be too popular. We say that because the total speculative
net-short position in T-Bond futures is at a 13-year high and close to an
all-time high.
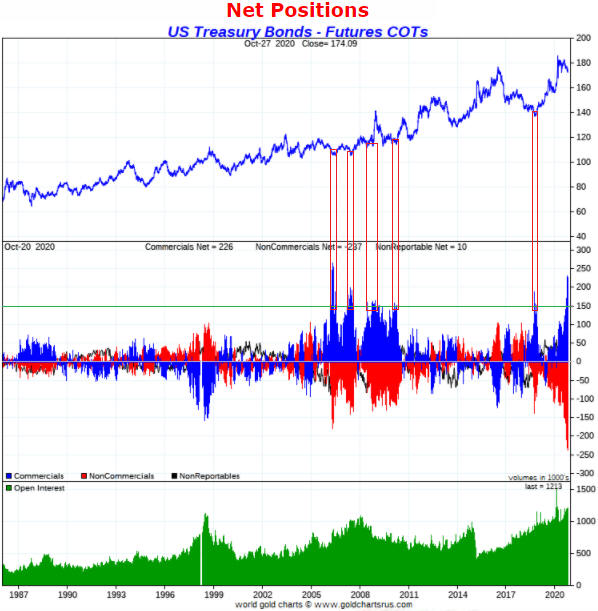
The middle section of the following weekly chart
illustrates the current lopsided sentiment in the T-Bond futures market.
The blue bars indicate the commercial position, which is the inverse of
the total speculator position. The near record-high commercial net-long
position equates to a near record-high speculator net-short position.
By drawing lines on the chart we have attempted to make the point that
there has never been significant weakness in the T-Bond price during the
months immediately after the commercial net-long position in T-Bond
futures has risen above 150K contracts (it was 226K contracts last week).
The historical sample size is small and it certainly could be different
this time, but clearly the current sentiment situation is far from ideal
for a bearish T-Bond speculation.
The upshot is that one of the
best trades over the next few years could be a bet on higher yields (lower
prices) for long-dated government bonds, but that is not a trade that
appeals to us right now.
Additional
thoughts on Bitcoin
In the latest Weekly Update we
wrote that due to the integration of bitcoin into the payment systems
operated by major on-line financial services companies and the evidence
that "forking" (replicating the bitcoin network) does not significantly
affect bitcoin's market value, bitcoin has a real shot at becoming a
popular medium of exchange. We also wrote that the more popular bitcoin
became as a medium of exchange, the greater would be the risk of a
government ban. Here are three other aspects of the bitcoin story that we
think are worth knowing.
First, most of our readers would be aware
that a record of all bitcoin transactions is maintained on a distributed
digital ledger called a "blockchain". The blockchain was the first
successful attempt to create a distributed, permissionless, de-centralised
ledger/database, but it probably won't be the last. This is a long-term
threat to any blockchain-based currency.
Second, the bitcoin
network consumes a lot of electricity. This is by design, since the
intention was to make the creation of a new bitcoin more like the
production of a gold ounce and less like the creation of a modern national
currency unit. Due to the resources (power) consumed in creating new
bitcoins and maintaining the integrity of the network, it could be argued
that using bitcoin is less 'green' than using the digital currency of a
central bank. In other words, helping the environment could be added to
fighting crime and terrorism to 'justify' a government decision to ban
bitcoin.
Third, it's almost certain that governments, via their
central banks, will issue their own digital currencies (cryptocurrencies)
within the next few years. For example, the US Federal Reserve possibly
will issue something along the lines of "Fedcoin".
We addressed this topic three years ago in a
post at the TSI Blog.
As mentioned in the above-linked blog
post, the driving force behind a state-sponsored cryptocurrency would be
the maximisation of tax revenue, in that the replacement of physical cash
with a digital system that enabled every transaction to be
monitored/recorded would eliminate a popular means of doing business below
the government radar. Fighting crime/terrorism, helping the environment,
promoting economic growth and reducing the health risk posed by the
person-to-person exchange of physical money (an obvious new justification
stemming from this year's events) would be nothing more than pretexts.
The introduction of state-sponsored cryptocurrencies such as "Fedcoin"
probably would increase the public's demand for decentralised
cryptocurrencies such as bitcoin, but governments and central banks don't
want competition for the money they issue/control. From their perspective,
there would be no point creating "Fedcoin" or something similar only to
have many economic transactions go unmonitored due to the use of bitcoin.
Therefore, the risk of the government banning bitcoin will ramp up after
the central bank issues its own digital currency.
The Stock Market
A week ago, we wrote: "We
suspect that it [the SPX] will maintain a downward bias between now and
the early-November US election unless there is good news on the 'stimulus'
and/or vaccine fronts."
There was no good news on the stimulus
or vaccine fronts. In fact, the COVID-related news has been all bad over
the past several days, with the number of daily new cases hitting new
highs in the US and skyrocketing in many European countries. Therefore,
the downward bias has been maintained.
The SPX has broken below its
50-day MA and probably is setting its sights on the 200-day MA near 3100.
We expect that any attempt to rebound from significantly north of that
level within the next couple of days will fail, because the market is not
'oversold' and because right now there are too many "known unknowns" for
buyers to have much conviction.
The new/larger waves of COVID cases have caused governments in Europe
to panic and impose lockdowns, which is a much bigger problem than the
virus itself. The lockdown strategy was ill-conceived to begin with and
failed the first time around, but political leaders often feel the need to
do something even if that something is counterproductive.
Over the
past few days the governments of France and Germany announced new national
lockdowns. This will have very negative economic consequences in the
short-term and the long-term.
In response to the lockdowns that
have been announced and in fear of what's to come, the SPDR EURO STOXX 50
ETF (FEZ) plunged over the first three days of this week and is now well
below its 200-day MA. This is illustrated by the top section of the
following chart, while the bottom section of the chart shows that the
FEZ/SPY ratio has dropped to near its low for the year. The decline in the
FEZ/SPY ratio is bearish for the euro.
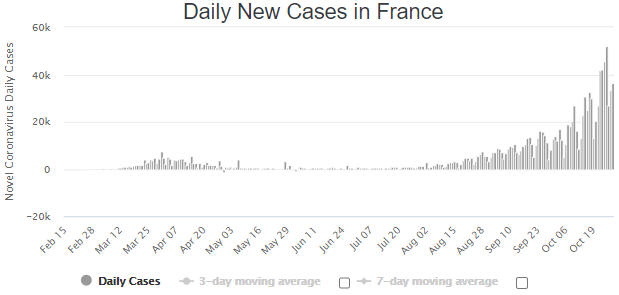
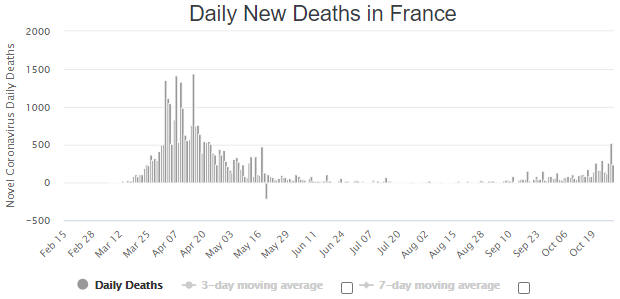
Getting less attention than it deserves is the plunge in the COVID
mortality rate. We are referring to the fact that the much larger wave of
daily new cases has been accompanied, to date, by a much smaller wave of
daily new deaths. France is a good example.
As mentioned above, the SPX probably is on its way to around 3100.
That's about 5% below the 28th October close. Be aware, though, that it
could fall further depending on next week's election outcome and the
extent to which governments panic regarding the increase in COVID cases.
Our plan is to wait for either an 'oversold' extreme or evidence of a
turnaround before doing any significant new buying.
Gold and the Dollar
Gold and Silver
In the latest Weekly Update, we wrote:
"The market looks
poised for a correction-ending plunge to $1800 or lower. This is the most
likely near-term scenario and if it happens it should create a good
opportunity to buy in preparation for the rally to new highs that we
expect to begin before year-end."
The price action over the
first three days of this week was consistent with the market
interpretation outlined above. The gold price appears to be rolling over
into what could be the correction-ending decline.
We continue to
think that the low-$1800s is the most likely place for a correction low,
but there is a risk that a general financial-market liquidation and
concomitant surge in the US$ could push the gold price down as far as
$1700.
Silver's short-term position is similar to gold's. Silver could trade
as low as US$19.00, although there is support near $21.00 and $20.00 that
could act as a floor.

Gold Stocks
The HUI plunged 7% on Wednesday
28th October to a new multi-month low.
Since the beginning of the gold mining correction in early-August our
view has been that a) the 200-day MA (for the HUI and GDX) was the most
likely place for a correction low, and b) October was the most likely
month for a correction low. The HUI's 200-day MA has risen to the 280s and
is now within reach. If it is tested within the final two days of this
week (the final two trading days of October) then we still could get an
October low, but if a rebound begins from near the current level (that is,
without a preceding downward spike to the 280s) then the odds will favour
an extension of the correction into November.
Note that the 280s
(for the HUI) is the most likely place for a correction low, because this
price area contains the 200-day MA and an important lateral support level
defined by the 2016 high. However, there is downside risk to lateral
support near 260.
The relative strength that was being exhibited by
the gold mining sector a couple of weeks ago has disappeared. This is
evidenced by the following daily chart, which shows that the HUI/gold
ratio plunged to a 4-month low on Wednesday 28th October. The chart also
shows that the HUI/gold ratio has closed below its 150-day MA for the
first time since early-April.
As mentioned in the latest Weekly
Update, the HUI/gold ratio climbing back above its 40-day MA (the blue
line on the chart) would be evidence that the correction is over.
The Currency Market
The Dollar Index (DX) has
done very little over the past three months. It stopped trending downward
in late-July, but it has spent almost the entire time since then within a
2-point horizontal range. It broke upward from this range during the third
week of September only to reverse course within a few days.
Over the past three months we've had 96-98 in mind as a target for
what we think is a countertrend rally within a cyclical decline. This
target remains plausible and could be reached in quick time if there is
some panic in the financial markets.
Note that during a panic
investors and speculators sell whatever they can, not necessarily what
they would prefer to sell. This can result in relatively high-quality
assets being dumped in a scramble for cash (usually US dollars). The
relatively high-quality assets then recover quickly after the panic
subsides.
Updates on Stock Selections
Notes: To review the complete list of current TSI stock selections, logon at
http://www.speculative-investor.com/new/market_logon.asp
and then click on "Stock Selections" in the menu. When at the Stock
Selections page, click on a stock's symbol to bring-up an archive of
our comments on the stock in question.
![]() Energy
Transfer LP (NYSE: ET) slashes its distribution
Energy
Transfer LP (NYSE: ET) slashes its distribution
Energy
Transfer (ET) is a Master Limited Partnership (MLP) that builds and
operates O&G pipelines and storage facilities in the US. In the 15th
October Weekly Update we compared it to TSI stock Enable Midstream (ENBL),
and wrote:
"As is the case with ENBL, the current
attractiveness of ET has a lot to do with its distribution yield. A week
ago we mentioned that ENBL's distribution yield was almost 17%. After a
subsequent 10% rebound in ENBL's unit price, the yield is now about 15%.
ET's current yield (US$0.305/quarter, or US$1.22 annualised) is almost
23%, which is extraordinary.
The main reason that ET yields a lot
more than ENBL is that ENBL has already 'bitten the bullet' and slashed
its distribution amount for risk management purposes, whereas ET's
quarterly distribution amount is the same now as it was a year ago.
Clearly, the stock market is anticipating a reduction in ET's quarterly
distribution.
If ET manages to get through the current period of
economic weakness without cutting its distribution then the unit price
should return to its early-2020 level of US$11-$12 before the middle of
next year, but in the more likely event that the distribution amount is
reduced by about 30% then the unit price still could make it back to the
June-2020 high near US$9.00 within the next 9 months."
As
expected, ET has cut its quarterly distribution, but by 50% rather than
the 30% mentioned above. This has dropped its yield to below that of ENBL
(at Wednesday's closing prices ENBL was yielding 14.5% and ET was yielding
11.6%). We suspect that the distribution was cut by more than necessary
for risk management purposes.
Our views are unchanged. We still
think that ET stands a good chance of returning to the June-2020 high near
US$9.00 within the next 9 months and we still prefer the gas-focussed ENBL
to the larger and more diversified ET, although both have attractive
intermediate-term risk/reward ratios near current prices.
Chart Sources
Charts appearing in today's commentary
are courtesy of:
https://stockcharts.com/
http://www.goldchartsrus.com/
![]()