|
- Interim Update 28th November 2012
Copyright
Reminder
The commentaries that appear at TSI
may not be distributed, in full or in part, without our written permission.
In particular, please note that the posting of extracts from TSI commentaries
at other web sites or providing links to TSI commentaries at other web
sites (for example, at discussion boards) without our written permission
is prohibited.
We reserve the right to immediately
terminate the subscription of any TSI subscriber who distributes the TSI
commentaries without our written permission.
Monetary
Inflation Update
When it comes to publishing money-supply data, the ECB is always
2-3 weeks behind the Fed. With Europe's shorter working hours, this
is probably not going to change. When it comes to depreciating money
by juicing its supply, the ECB is usually years behind the Fed. In
this endeavour, though, the ECB is steadily making inroads into the
Fed's lead.
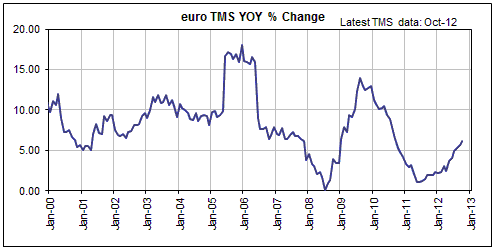
The following chart shows the year-over-year growth rate of
euro-zone True Money Supply (TMS). The growth rate bottomed at
around 1% in mid-2011, at which time there was a very real prospect
of deflation. However, it then began trending upward and was at 6.1%
in October of 2012. There is no longer a realistic chance of the
euro-zone experiencing deflation anytime soon. In fact, further
acceleration in the rate of monetary inflation is the most likely
outcome over the next several months.
With the rate of US$ inflation having drifted lower and the rate of
euro inflation having drifted higher over the past 12 months, the
rate of growth in what we call G2 money supply (US TMS plus
euro-zone TMS) has essentially gone sideways. The year-over-year
change in G2 TMS is illustrated below.
Due to the Fed's QE3 program and the ECB's increasingly easy
monetary policy the G2 monetary inflation rate is more likely to
rise than to fall over the months ahead.
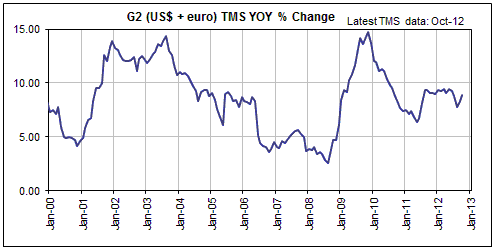
From a practical speculation standpoint, the year-over-year growth
rate of G2 TMS has been the best monetary indicator over the past 12
years. This indicator's current message is that there is almost no
chance of deflation or even a serious deflation scare within the
next 6 months.
The Stock Market
Most stock indices dropped a little on Monday and Tuesday of
this week. On Wednesday the decline was starting to build some momentum, but an
upward reversal then occurred. It seems that the path of least resistance is now
to the upside.
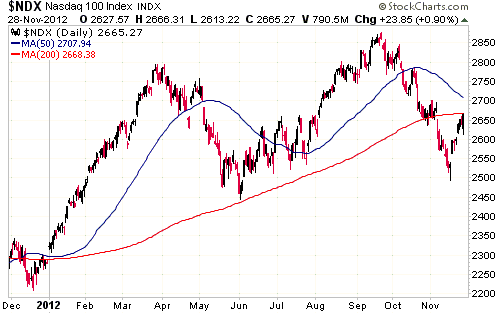
After leading to the downside from early-September through to early-November,
the NASDAQ100 Index (NDX) is now leading to the upside. The current upside
leadership is primarily a function of the preceding downside leadership, in that
the relative strength shown by the NDX and its most important component (AAPL)
over the past two weeks is largely due to how 'oversold' they had become.
As illustrated below, the NDX has quickly rebounded to its 200-day moving
average. This effectively means that the 'easy lifting' has been done, but
doesn't mean that the rebound from the November low is complete.
Our guess (we could say our detailed analysis of all relevant factors, but guess
is more accurate) is that the stock indices will maintain an upward bias for 2-4
more weeks, with a couple of intervening multi-day pullbacks.
Gold and the Dollar
Gold and Silver
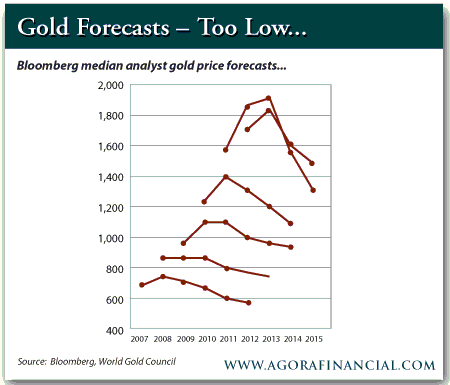
Chronically low long-term gold price forecasts
The chart displayed below was taken from a recent
article at The Daily Reckoning and shows the median gold price forecasts of
analysts monitored by Bloomberg. It shows that from 2007 onwards the average
forecast has been for the gold price to be flat or higher over the coming 1-2
years and to then decline sharply such that the price is much lower after 4-5
years. For example, in 2007 the average forecast was for the gold price to trade
at $650-$700 during the current year, move up to $750-$800 during 2008, and then
decline to below $600 by 2012. They have always expected the price to be lower
in 4 years than it is today. Despite being consistently wrong, they still expect
the price to be lower in 4 years than it is today.
This is absolutely not the sort of sentiment that would likely be evident if
gold's long-term bull market were near its end. There's a high probability,
verging on a certainty, that near the end of gold's bull market the average
analyst will be forecasting an upward price-trend extending many years into the
future.
On a different matter, the article linked above contains some serious errors.
One notable error is the assertion that China and India account for 47% of the
demand for gold. To make this assertion you have to make the mistake of applying
a traditional commodity-type analysis to the gold market.
With all commodities except gold the so-called stocks-to-flow ratio is
relatively low, meaning that the amount of the commodity held in inventory
(warehouses, storage containers, vaults, etc.) is low compared to the amount
consumed in commercial processes. It is almost always less than one year and is
often just a few weeks. This means that when doing a supply-demand analysis for
any commodity except gold it will generally make sense to compare the current
year's consumption to the current year's new production. With gold, however, the
existing aboveground supply is more than 75-times greater than annual mine
production. This means that if the entire gold mining industry were to shut down
for a year it would not make a significant difference to total gold supply. It
also means that it makes no sense to compare the amount of gold sold in a
country in a year with the world's new mine supply and to use the result of this
comparison as an indicator of that country's contribution to global gold demand.
A related error is to downplay the actions of the Fed. The US$ gold price is
mostly determined by the general perception of what's happening and what's
likely to happen to the US$, which, in turn, is mostly determined by the actions
of the Fed. For example, a negative real interest rate constitutes a powerful
bullish force in the gold market, but real interest rates in the US could not be
negative in the absence of the Fed.
Gold is a global market and what happens to gold demand in one part of the world
can have an effect on how gold is priced in another part of the world, but gold
is never going to make large and sustainable gains relative to a sound currency.
If, for example, the US$ were suddenly transformed into a sound currency due to
the Fed making a credible promise not to further inflate the US$ supply, we have
no doubt that the US$ gold price would decline to a much lower level regardless
of what was happening in China and India. In this hypothetical situation the
gold price would decline in US$ terms, but it wouldn't necessarily decline in
terms of any other currency.
The main reason to be bullish on the US$ gold price is that the economics
ignoramuses at the upper echelons of the Fed truly believe that they can help
the US economy by conjuring money out of nothing. The weaker the economy becomes
the more money they will create, and the more money they create the weaker the
economy will become.
Current Market Situation
There were sharp intra-day declines in the gold and silver markets on Wednesday
28th November, but by the end of the US trading session the losses had been
materially reduced. This was especially so in the silver market, with the
nearest silver futures contract trading as low as $32.90 early in the day before
recouping the bulk of its loss and ending the session at $33.78.
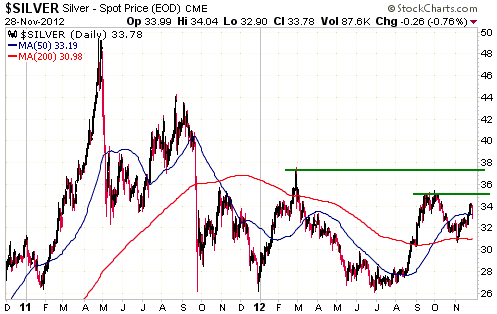
The following daily chart shows that silver has resistance at around $35 and
then at around $37. There's a good chance that silver will test the lower of
these resistance levels and a realistic possibility that silver will test the
higher of these resistance levels within the next few weeks.
Gold Stocks
The HUI fell sharply during the early going on Wednesday 28th November, but then
recovered to end the day with a small gain. This price action is bullish, but as
warned in the past the price action during any single trading day usually
doesn't provide reliable information about what the future holds in store.
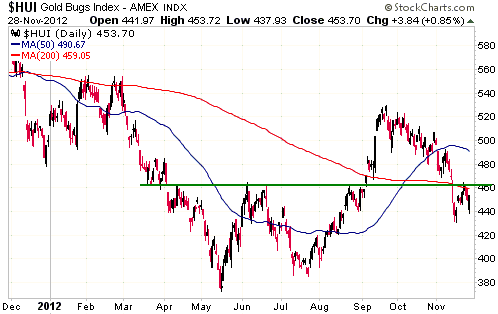
The best reason to be optimistic about the gold sector's likely short-term
performance is that the HUI reached an 'oversold' extreme during the week before
last. This increases the probability that the sharp decline during the early
part of Wednesday's trading session will turn out to be a successful test of the
recent low.
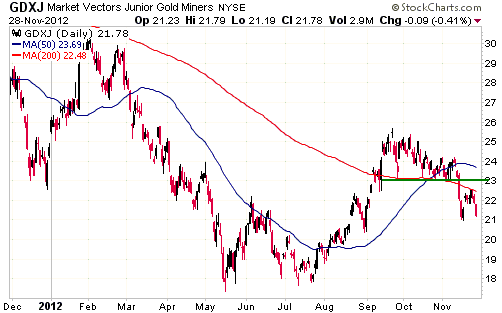
GLDX, an ETF that holds junior gold mining stocks, continues to look good for a
3-5 month trade. The same applies to GDXJ, an ETF that also holds junior gold
mining stocks. The difference between these two ETFs is that GLDX concentrates
on companies that are at the exploration stage, whereas GDXJ's main holdings
tend to be larger and less speculative. This difference is likely to result in
GDXJ doing better during the first 1-2 months and GLDX doing better during the
second half of the next 4-6 month gold-sector rally.
Currency Market Update
As part of the "extend and pretend" (E&P) program being run by the EZ's
political and monetary leadership, a new deal to prolong the financial agony of
Greece's government and banking industry was announced early this week. As
reported in the article posted
HERE:
"Lenders have agreed three steps to help Greece:
1) Cutting the interest rate on official loans, extend their maturity by 15
years to 30 years, and granting Athens a 10-year interest repayment deferral.
2) To return €11bn of profits accrued through the European Central Bank's
purchase of distressed Greek government bonds
3) To conduct a debt-buyback scheme.
Greece will receive its aid tranche in stages, starting with €34.2bn next month.
Much of the money will be used to recapitalise its banks.
That means the chatter about Athens running out of money should finally dampen
down. However, this deal is only "tentative" - the IMF won't hand over its share
of the money until the debt buyback has been conducted."
Details of the debt buyback scheme are expected within the next week.
The next big step in the E&P program is a formal request for a bailout from
Spain's government. The financial world is likely to cheer the formal bailout
request when it eventually comes because it will lead to tens of billions of
additional euros being 'mobilised'.
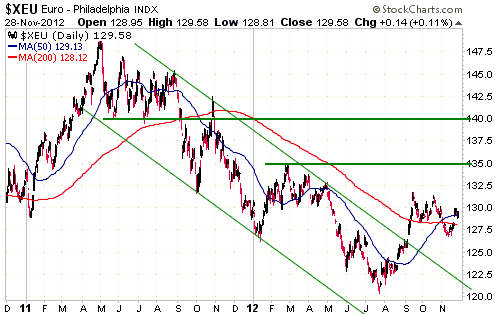
We have been anticipating more short-term gains for the euro based largely on
sentiment considerations, but the news of the day is starting to align with a
short-term bullish outcome for this currency.
The following daily chart shows that the euro has resistance at 1.35 and then at
1.40. Our guess is that the lower of these resistance levels will be tested by
January.
Update
on Stock Selections
Notes: 1) To review the complete list of current TSI stock selections, logon at
http://www.speculative-investor.com/new/market_logon.asp
and then click on "Stock Selections" in the menu. When at the Stock
Selections page, click on a stock's symbol to bring-up an archive of
our comments on the stock in question. 2) The Small Stock Watch List is
located at http://www.speculative-investor.com/new/smallstockwatch.html
 Financing
status of exploration/development-stage gold miners Financing
status of exploration/development-stage gold miners
The "Gold and Silver" section of the TSI Stock Selections list contains current
producers and exploration/development-stage companies. The latter are at least a
year and in most cases more than two years away from having any production.
With the exception of Jaguar Mining (JAG), which is a special case that we've
covered separately, the current producers are cash-flow positive and therefore
self-financing. The exploration/development-stage companies, however, will burn
through cash every month until they a) are purchased by a larger mining company
or b) build a mine that generates cash or c) fade away to nothing. These
companies rely on being able to periodically obtain fresh injections of money
from 'investors', which means that they can be greatly affected by the general
willingness of people to throw money at speculative ventures.
Right now the general willingness of people to throw money at speculative
ventures is at a low ebb, and although the situation could (probably will, in
our opinion) be very different 6 months from now there is presently no evidence
that an easier financing environment is about to emerge. Consequently, anyone
who speculates in the stocks of exploration/development-stage mining companies
must pay close attention to the amount of cash on the balance sheet, the cash
burn rate, and the ability to raise additional cash at a reasonable cost.
In the following table we have given the TSI exploration/development-stage gold
miners a financial health rating of 1 through 5, where "1" indicates most
healthy and "5" indicates least healthy. To be more specific, here's how our
financial health rating should be interpreted:
1: Financing will probably never be a significant obstacle.
2: Additional financing will not be required within the next 12 months and will
probably be available at a reasonable cost thereafter.
3: Additional financing will not be needed within the next 6 months but probably
will be needed within the next 12 months.
4: Additional financing will not be needed within the next 3 months but probably
will be needed within the next 6 months.
5: There is an urgent need for additional financing.
None of the companies are rated "5" at this time, but the bottom two will likely
shift from "4" to "5" in Feb-Mar of next year if a financing deal isn't done in
the interim.
|
Company Name |
Symbol |
Price on 28-Nov ($) |
Total Shares (M) |
Working Capital ($M) |
LT Debt ($M) |
Financial Health Rating |
comment |
|
Keegan Resources |
KGN |
4.02 |
90 |
215 |
0 |
1 |
KGN is almost fully funded through to production. |
|
Pretium Resources |
PVG.TO |
13.70 |
101 |
70 |
0 |
1 |
PVG might have to do another financing in 2013, but will likely have no
trouble raising additional money when required. Previous financings have
been well timed. |
|
Sabina Gold & Silver |
SBB.TO |
2.85 |
174 |
118 |
0 |
1 |
At its current rate of spending SBB is fully funded for the next 18
months and will likely have no trouble raising additional funds as
required. Also, at some point SBB will probably receive a large
injection of cash due to the sale of its Hackett River silver stream. |
|
Pilot Gold |
PLG.TO |
1.92 |
95 |
40 |
0 |
2 |
Fully funded through next 12 months and will likely have no trouble
raising additional funds when required. |
|
Batero Gold |
BAT.V |
0.45 |
95 |
20 |
0 |
3 |
We are assuming that the CMH investment is completed as planned. |
|
Golden Predator |
GPD.TO |
0.28 |
160 |
12 |
10 |
3 |
LT debt shown here is the initial drawdown from the $35M Red Kite credit
facility. $25M balance will be drawn down to fund the work program over
the next 12 months. |
|
International Tower Hill Mines |
THM |
2.16 |
100 |
35 |
0 |
3 |
THM appears to be funded through to Q3-2013, but will probably do a
$10M-$20M equity financing during the first half of 2013 if a good
opportunity arises. |
|
Volta Resources |
VTR.TO |
0.53 |
155 |
20 |
0 |
3 |
VTR appears to be funded through to Q3-2013, but will probably do a
$10M-$20M equity financing during the first half of 2013 if a good
opportunity arises. |
|
Carpathian Gold |
CPN.TO |
0.28 |
557 |
110 |
90 |
3 |
We are assuming that the $90M project loan is finalised as planned. Note
that CPN has a large non-cash derivative liability (which isn't shown
here) due to forward sales. |
|
Clifton Star Resources |
CFO.V |
0.90 |
40 |
8 |
50 |
4 |
LT debt shown here is the total remaining payment to the project
vendors. Next payment is $10M due in Dec-2014. Health rating will
improve from 4 to 3 if Osisko $22.5M loan is obtained. |
|
Rio Novo Gold |
RN.TO |
0.18 |
113 |
9 |
0 |
4 |
RN doesn't have an urgent need for additional money. However, it is
facing a large financing obstacle because it needs to raise $150M to
construct a new mine, but at its current stock price even a $10M equity
financing would substantially dilute the stakes of existing
shareholders. |
|
Sandspring Resources |
SSP.V |
0.42 |
138 |
8 |
0 |
4 |
At its current rate of spending SSP will have to raise more money by
March of 2013, but near its current stock price it couldn't raise much
money without severely diluting the stakes of existing shareholders. The
best solution for SSP would be a financing deal with a larger company
similar to the one recently put together by Batero. |
Due to the unusually difficult conditions that now prevail, those who speculate
in exploration/development-stage gold mining stocks should place more than the
usual amount of emphasis on financial health (balance sheet strength and the
ability to obtain additional financing at a reasonable cost as needed). That
doesn't necessarily mean that companies with a poor health rating should be
ignored, as there could be good reasons to take the financing risk. Just be
aware of the risk when making a decision to buy/hold.
Chart Sources
Charts appearing in today's commentary
are courtesy of:
http://stockcharts.com/index.html

|
