|
- Interim Update 28th December 2011
Copyright
Reminder
The commentaries that appear at TSI
may not be distributed, in full or in part, without our written permission.
In particular, please note that the posting of extracts from TSI commentaries
at other web sites or providing links to TSI commentaries at other web
sites (for example, at discussion boards) without our written permission
is prohibited.
We reserve the right to immediately
terminate the subscription of any TSI subscriber who distributes the TSI
commentaries without our written permission.
TSI schedule reminder
As previously advised, there will be no Weekly Update on Sunday 1st January. We'll return to our normal commentary-posting schedule thereafter.
Happy New Year! Interesting
(and revealing) quotes
"This current bear market rally is comparable to the tragic fooler bear rally that followed the 1929 crash. But in extent, this bear market rally (I'm talking about the one that followed the 2009 low) was even greater than the 1929-1930 rally. And just as 1929-1930 fooled many investors, who re-entered the market thinking that they would recoup their 1929 losses, this giant 2009-2011 rally sucked in thousands of hopefuls back into the stock market again.
The great bear market rally is now about over, following a very long period of deceptive distribution. I am warning all my subscribers again that we are back in the grip of a vicious and ruthless bear. The bear has been held back for almost two years, due to the so-called quantitative easing of an anxious and ignorant Fed. There's no bear angrier than a frustrated bear. As a result, I believe we're going to see a brutal stock market that will shock the Fed and the bulls and the public -- and all who insist on remaining in this bear market."
- Richard Russell, December 2011
"We've been in a primary bull market and we're still in one. The costly and brutal decline form [sic] the 2007 high to the 2009 low was, in fact, an almost unprecedented correction in an ongoing bull market. The stock market panic-collapse was a direct result of the crash of the housing bubble. I mistakenly took the vicious decline of 2007 to 2009 as a turn in the tide and a bear market. ... As of now, the bull market is still in force. Therefore, any forthcoming correction should serve as a buying opportunity."
- Richard Russell, April 2011
Oh what a difference 8 months can make!The Stock Market
The Presidential Cycle (PC)
In 2010 (the second year of the current PC) the US stock market followed the PC Model until August, when it diverged bullishly from the Model due to the Fed's promise of more "Quantitative Easing". In 2011 (the third year of the current PC) the market was much weaker than predicted by the Model.
The following chart, which was taken from Mike Burk's 24th December report, shows the S&P500's average performance during the 4th year of all Presidential Cycles from 1928 through to 2008. The Model predicts that 2012 will have a 'choppy' first half and a very strong second half. The question before us is: should we heed this model when deciding what to do in 2012?
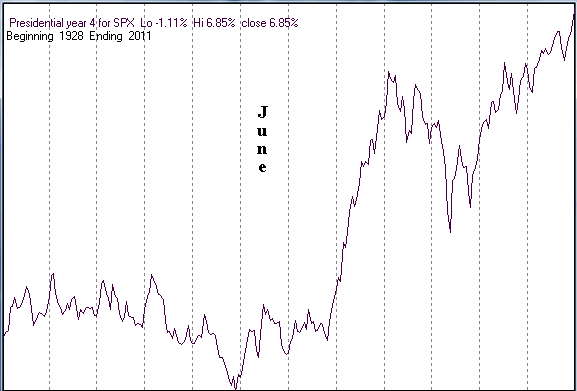
The answer is: no. The fundamental basis for the PC Model no longer exists. The Model was often a useful guide in the distant past because the President would attempt to get restrictive policies out of the way during the first half of his 4-year term and implement stimulative policies -- to create the illusion of prosperity during the quarters leading up to the next election -- during his term's second half. Nowadays, however, there is non-stop 'stimulus' and the rate at which stimulus is administered tends to be ramped up and down on an ad hoc basis in reaction to events that policy-makers never see coming.
The ad hoc acceleration/deceleration of monetary and/or fiscal stimulus is why the stock market diverged bullishly from the PC Model in 2010 and bearishly from the PC Model in 2011. Specifically, the unplanned "QE2" program caused the market to turn higher prematurely (well in advance of the PC Model) in 2010, and the removal of artificial support caused the market to under-perform the PC Model throughout the bulk of 2011.
Also worth noting is that the fourth year was a huge outlier in two of the past three Presidential Cycles (we are referring to the years 2000 and 2008). Anyone who bought aggressively in mid-2000 or mid-2008 in anticipation of the strong second-half rally predicted by the PC Model would have been financially clobbered.
Current Market Situation
The odds favour some additional upside over the weeks ahead, but considering the downside risk the remaining upside potential is not sufficient to justify a "bullish" short-term outlook. We remain short-term "neutral" and intermediate-term "bearish".
Gold and the Dollar
Gold and Silver
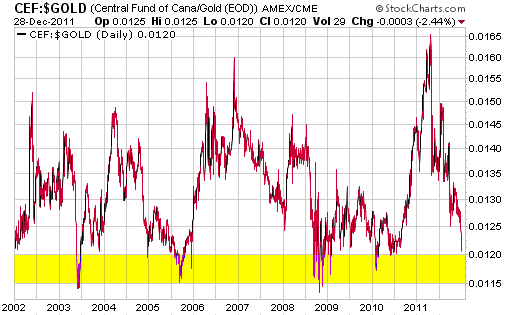
Please refer to the discussion of the CEF/gold ratio (the unit price of Central Fund of Canada divided by the US$ gold price) and the chart comparison of the silver price and the CEF/gold ratio included in the 16th November 2011 Interim Update. This is how the discussion concluded:
"...there is too much variation in CEF/gold's peaks for the ratio to be a good indicator of intermediate-term selling opportunities, but enough consistency in CEF/gold's troughs for the ratio to be used to signal intermediate-term buying opportunities. As evidence, we present the following chart comparison of silver and the CEF/gold ratio. Notice that over the past 10 years CEF/gold has dropped into the 0.0115-0.0120 range on seven separate occasions and that each of these occasions coincided with a good intermediate-term buying opportunity in the silver market."
"The intermediate-term correction that began earlier this year hasn't yet pushed CEF/gold into the 'buy zone' [the 0.0115-0.0120 range] ... and there's no guarantee that it will, but the historical record tells us that the odds are in favour of CEF/gold dropping into this zone prior to the start of the next intermediate-term advance. The main point is that if CEF/gold does fall into this zone it will mean that a relatively low-risk buying opportunity is at hand for both gold and silver."
The following chart shows that the recent market action has taken CEF/gold to near the top of the 'buy zone'.
We've previously written that a decline by silver to near the bottom of its intermediate-term trading channel (the channel drawn on the following chart) would create a good buying opportunity. Silver is now within $1 of its channel bottom.
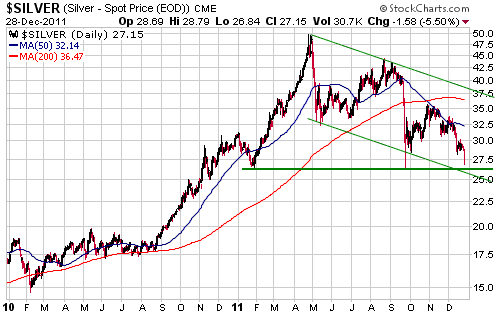
The two charts displayed above indicate that a relatively low-risk buying opportunity has arrived for both gold and silver. The opportunity could get better over the next couple of weeks, with gold perhaps falling back to the low-$1500s, but it probably isn't going to get a lot better.
Don't try to pick price bottoms and tops. Just scale in when the risk/reward is favourable and scale out when it is unfavourable. And ignore the cheerleaders (the commentators who believe that it's always a good time for buying and never a good time for selling).
Gold and Platinum
The price of platinum reached a major peak of around $2300/oz in the early part of 2008. The final spectacular surge to this peak was driven by the combination of the popular (but wrongheaded) notion that the Fed was about to immediately inflate the US$ into oblivion and a supply shock stemming from a power shortage in South Africa. Close to the price peak Market Vane reported that 95% of traders were bullish on platinum. Such high bullish percentages usually only occur when a market is in the process of making a price top that will hold for at least a couple of years.
The price of platinum subsequently tumbled as the supply problem proved to be short-lived, the US$ strengthened and the industrial demand for the metal collapsed in response to global economic weakness. By the final quarter of 2008 the platinum price was around $800/oz and Market Vane were reporting that only 16% of traders were bullish. In other words, almost all the traders who were eager to own platinum above $2000/oz in February of 2008 didn't want anything to do with it at $800/oz only 8 months later.
By August of 2011 the platinum market had rebounded to $2000/oz (within about 15% of its 2008 peak) on the back of massive monetary inflation, a moderate recovery in industrial production and a natural reaction to the 2008 'overshoot'. It has since pulled back to around $1400/oz, which is near the middle of its 6-year price range.
We don't know if platinum is cheap or expensive at around $1400/oz. Sentiment is constructive (Market Vane shows that only about 40% of traders are currently bullish), but if we are right to believe that much of the world is either in recession or about to enter recession then the industrial demand for platinum could decline markedly over the next 12 months. Also, although the platinum price has dropped back to the middle of its 6-year range, the upper section of the following weekly chart shows that it is still near the top of its 30-year range.
The main reason that our interest in platinum has recently been piqued is illustrated by the lower section of the following chart, which shows the platinum/gold ratio. Relative to gold, platinum is cheaper than it has been at any time since 1985 and is within 20% of its all-time low.
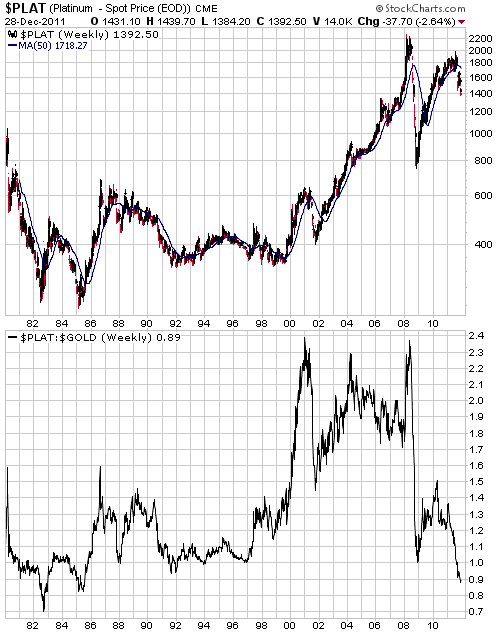
In less than 4 years the platinum/gold ratio has gone from one generational extreme to the opposite generational extreme, but we aren't interested in betting that platinum will strengthen relative to gold over the months/quarters ahead. The reason is that platinum's low stocks-to-flow ratio (the amount of aboveground platinum relative to the amount of the metal consumed in commercial processes) means that it is poorly suited for a monetary role. Gold, on the other hand, is extremely well suited for a monetary role. This difference between platinum and gold could eventually lead to gold trading at a much greater premium to platinum.
We would, however, be interested in owning platinum at the right price, most likely via the Physical Platinum ETF (NYSE: PPLT). There's a distinct possibility that platinum will get significantly cheaper relative to gold, but this would more likely happen as a result of a large rise in the gold price than substantial weakness in the platinum price. After all, even though platinum is ill suited to be money, a surge in the gold price on the back of increasing monetary demand for the metal would almost certainly bring about an increase in the speculative demand for platinum.
The right price is around $1200, or about $200 above long-term support at $1000.
Gold Stocks
Stocks versus Bullion
This is a topic we've dealt with countless times in the past. However, it recently occurred to us that although we've used the performance of gold stocks relative to gold bullion during the 60s-70s bull market in our explanations and forecasts over the past 10 years, we've never shown a chart that simply compared the stocks/gold ratio during the prior bull market with the same ratio during the current bull market. We are now going to remedy this omission.
Before we get to the chart we'll note that even though the gold price was fixed prior to 1971, we know from the performance of the gold mining sector that the long-term bull market in gold-related investments began around 1964. That's why we refer to the long-term gold bull market of the 60s-70s as opposed to the long-term bull market of the 70s.
The top section of the following weekly chart shows the BGMI/gold ratio (the Barrons Gold Mining Index relative to gold bullion) over the 17-year period from the January-1964 through to January-1981. The bottom section of the chart shows the same ratio over the 17-year period beginning January-2000. Be aware that the vertical scales on the two chart sections are different.
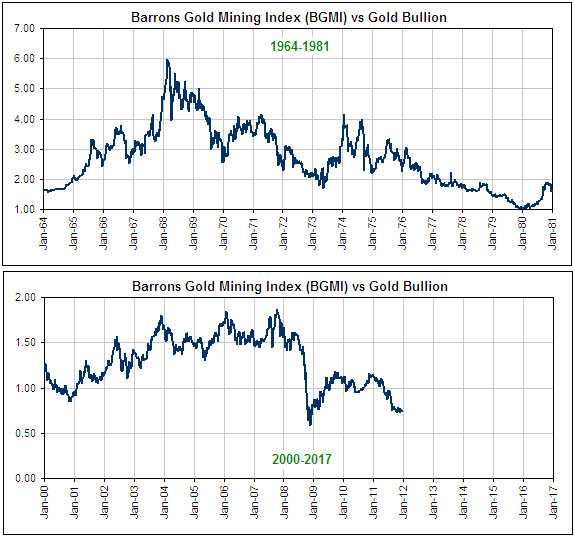
BGMI/gold's twists and turns during the current gold bull market don't line up neatly with those of the earlier bull market. There's no good reason to expect that they would, given that there are major differences between the current fundamental backdrop and that of 1964-1981. One of these major differences is that the gold price was fixed at $35/ounce during the first leg of the earlier bull market and was later 'set free'. This caused BGMI/gold to have a much wider range during the earlier bull market, with all the upside initially concentrated in the stocks and the bullion subsequently making a big catch-up move.
BGMI/gold's overall performance to date during the current gold bull market does, however, line up with its overall performance during the earlier episode. We note, in particular, that when gold bullion was topping in January of 1980 the BGMI/gold ratio was lower than it was at the 1964 start of the bull market. In other words, far from providing upside leverage to the bullion price, gold stocks, as a group, lost ground relative to the bullion over the course of the long-term gold bull market of the 60s-70s. Gold stocks, as a group, have also lost ground relative to the bullion over the first 11 years of the current long-term gold bull market.
As we've said in the past, it is simply not true that the average gold stock offers long-term leverage to upside in the bullion price. During some years the stocks will outperform the bullion, with the best chance of relative strength in the stocks arising after the stocks have been driven to very low valuations. During other years, the bullion will outperform the stocks. During periods of 10 years or longer, the stocks are unlikely to do any better than hold their own against the bullion.
Current Market Situation
From the 21st December Interim Update:
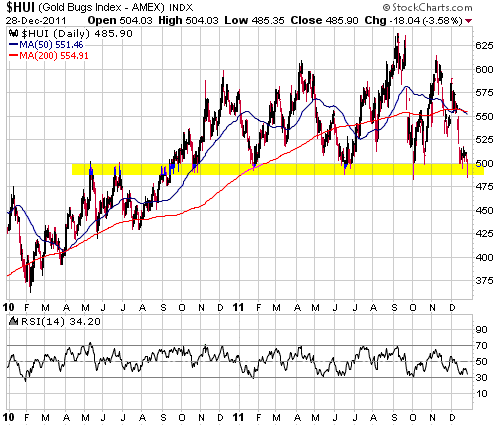
"The HUI dropped to the middle of its 490-500 support range on Monday and then rebounded. There is no evidence that a price low is in place, but we continue to believe that a near-term break below 490-500 would be followed by a decline to no lower than 470.
470 probably defines the additional downside potential assuming that 490 is breached within the next couple of weeks. This is because gold stocks, as a group, are almost as 'oversold' as they ever get at intermediate-term price lows. However, the downside potential would be significantly greater if the HUI were to rebound over the next few weeks and then take out support. In other words, if the HUI is going to breach support it would be better for the bulls if it did so now rather than later."
The HUI closed at 485 on Wednesday, so the breach of support has happened. The fact that it happened sooner (with the gold sector near an 'oversold' extreme) rather than later suggests to us that the additional short-term downside potential is only a few percent. Our short-term HUI outlook has therefore shifted from "neutral" to "bullish".
Currency Market Update
On 21st December, we wrote:
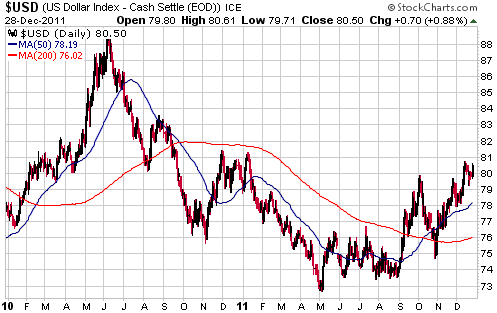
"Sentiment indicators continue to suggest that the euro is close to a multi-month bottom in terms of time, but the price action continues to suggest that a meaningful turning point is not yet at hand.
If the euro's recent low is taken out, the most likely level for a bottom would be support at around 126."
The euro took out its recent low on Wednesday. It is now in a similar position to the HUI in that it has breached support while already near an 'oversold' extreme, meaning that there probably isn't a lot of scope for additional short-term weakness.
Support at 126 stands a good chance of limiting the short-term decline, especially if it is tested within the next two weeks.
A decline by the euro to around 126 would likely coincide with a rise in the Dollar Index to around 83. We doubt that the Dollar Index will do significantly better than that in the short-term, but we remain intermediate-term bullish in anticipation of the dollar moving to much higher levels relative to most of the other major currencies over the year ahead. This intermediate-term bullish view is largely predicated on our view that a global bear market in equities will extend through 2012.
Update
on Stock Selections
Notes: 1) To review the complete list of current TSI stock selections, logon at
http://www.speculative-investor.com/new/market_logon.asp
and then click on "Stock Selections" in the menu. When at the Stock
Selections page, click on a stock's symbol to bring-up an archive of
our comments on the stock in question. 2) The Small Stock Watch List is
located at http://www.speculative-investor.com/new/smallstockwatch.html
 Dragon Mining (ASX: DRA). Shares: 74M issued, 75M fully diluted. Recent price: A$1.19 Dragon Mining (ASX: DRA). Shares: 74M issued, 75M fully diluted. Recent price: A$1.19
DRA hasn't managed to buck the trend that has forced the prices of most gold and silver stocks sharply lower over the past month. At its current price of A$1.19, DRA is a profitable junior gold producer with in-house growth potential and a solid balance sheet operating in a politically secure region (Finland and Sweden) that is being valued by the market at well below its annual sales revenue.
The stock is clearly a good candidate for new buying.
Chart Sources
Charts appearing in today's commentary
are courtesy of:
http://stockcharts.com/index.html

|

