![]()
![]()
![]()
![]()
- Interim Update 28th December 2016
Copyright
Reminder
The commentaries that appear at TSI
may not be distributed, in full or in part, without our written permission.
In particular, please note that the posting of extracts from TSI commentaries
at other web sites or providing links to TSI commentaries at other web
sites (for example, at discussion boards) without our written permission
is prohibited.
We reserve the right to immediately
terminate the subscription of any TSI subscriber who distributes the TSI
commentaries without our written permission.
TSI Schedule Update
There has been a change of
plans. We previously advised that there would be no Weekly Update during
the coming weekend, but it turns out that we will be able to do a report.
It will be briefer than usual, but a Weekly Market Update will be posted
at around the usual time on Sunday.
Iron-Ore
Iron-ore has been one of the
best-performing commodities in 2016. As illustrated below, the price has
more than doubled since the beginning of the year.
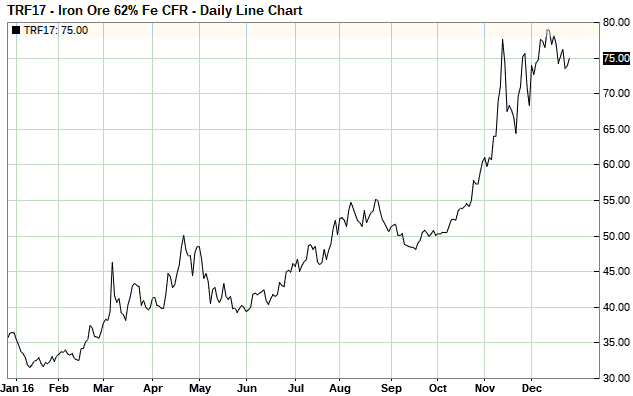
The strength of the rebound in the iron-ore price over the past 12
months appears to be inconsistent with supply-demand considerations, given
that global economic growth has been lackluster and there is abundant
supply of this commodity. However, there is nothing strange about the
apparent conflict between iron-ore's price action and the commercial
supply-demand situation. As we noted in early-March after the first leg of
the iron-ore rally:
"Analysts from Goldman Sachs, along with
numerous others, have warned that the rallies in iron-ore and other
commodities are unsustainable and doomed to be followed by declines to new
bear-market lows. Regardless of whether or not this conclusion turns out
to be correct, the analysis is wrong because it is based on supply-demand
fundamentals. Commodity supply-demand fundamentals are ALWAYS very bullish
at major price tops and very bearish at major price bottoms, so commodity
analysts that base their forecasts on the supply-demand fundamentals are
guaranteed to be wrong at major turning points.
That doesn't mean
that a major turning point has happened; it means that you cannot possibly
tell if a major turning point has happened by assessing the supply-demand
fundamentals.
Our view is that a sustained turn to the upside could
have begun. At this stage it's a realistic possibility that will have to
be confirmed by additional evidence."
We didn't expect
iron-ore to perform as well as it did during 2016, but we don't view the
performance as a conundrum. The price rally was fueled at times by Chinese
speculation/gambling, but the best explanation for this year's strength is
the dramatic price weakness of the preceding few years. Iron-ore traded at
$190/tonne in 2011, so while the price is now high compared to where it
was at the beginning of this year it is still about 60% lower than it was
a few years ago.
As far as we can tell, there is no good reason to
be long-term bullish on iron-ore. However, if the price recovery extends
into 2017 then some development-stage projects that were a long way 'out
of the money' a year ago will start to look economically viable and the
companies that own these projects will experience large upward re-ratings
in the stock market. One such company is Adriana Resources (ADI.V), which
was recently added to the TSI List.
ADI owns 40% of the Lac Otelnuk
Iron Ore Project ("LOM Project") located in Nunavik, Quebec. Based on a
Feasibility Study completed in April-2015, this project could become
viable if iron-ore makes a sustained move above $110/tonne.
ADI is
being merged with Sprott Resource Corp. (SCP.TO) to form Sprott Resource
Holdings. This means that the exposure to iron-ore will be substantially
diluted, but this is what we want. We don't want to own a company that
needs a much higher iron-ore price to become a lot more valuable, but it
is good to own a diversified resource company that contains some iron-ore
optionality. That's especially so when the cost of getting the optionality
is zero (ADI is trading at cash value, which means that the market is
currently assigning zero value to its iron-ore project).
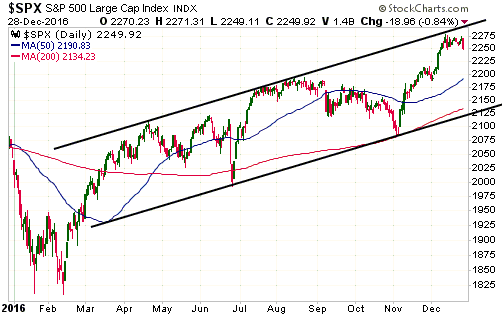
The Stock Market
The S&P500 Index (SPX) hit its
channel top during the second week of December and has since traded
sideways. The 0.8% decline on Wednesday 28th December could be the start
of a short-term correction, but it's too soon to draw any conclusions.
We suspect that if a short-term correction hasn't already begun then
it will begin within the next several days following a rise to a marginal
new high. This would be similar to what happened in August, when the SPX
moved slightly above its July peak and re-tested its channel top before
embarking on a 2-3 month decline.
Assuming that the SPX has already
reached a short-term peak or will make only a marginal new high before
peaking on a short-term basis, the channel bottom is a reasonable target
for a correction low. The channel bottom is currently near 2130, or about
5% below Wednesday's closing price.
Gold and the Dollar
Gold
Can the gold price bottom with bearish
fundamentals?
The answer to the above question is yes.
Short-term trends in the financial markets often have more to do with
sentiment than fundamental developments, so a short-term rally could
certainly occur without the fundamental backdrop becoming any less
gold-bearish than it is today. In fact, a $70-$130 rebound in the gold
price is likely within the next three months. Furthermore, it is possible
for the gold price to bottom on an intermediate-term or even a long-term
basis in the face of bearish fundamentals. What's not possible is for gold
to experience a major, multi-year advance in the face of a gold-bearish
fundamental backdrop.
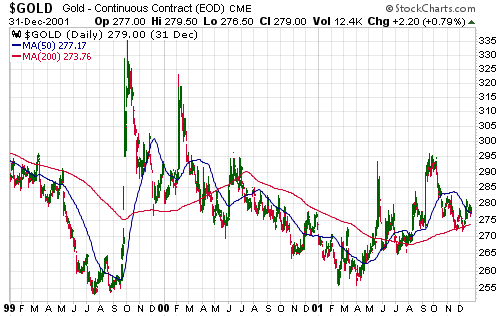
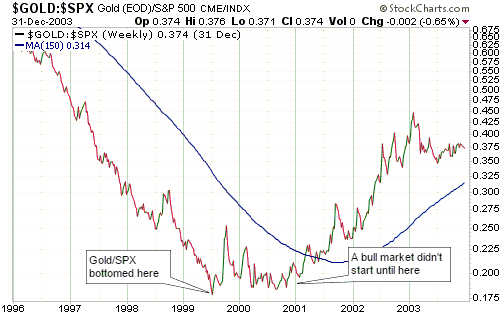
Gold's performance during 1999-2001 is a good
example of what we mean by the last two sentences of the above paragraph.
Gold bottomed in US$ terms and relative to financial assets as represented
by the S&P500 Index (SPX) in the face of bearish fundamentals during the
third quarter of 1999, but a major rally (a cyclical gold bull market)
didn't begin until the fundamental backdrop turned definitively
gold-bullish in early-2001. Refer to the following charts for the gory
details.
In other words, even if the fundamental backdrop doesn't shift in
gold's favour there are likely to be tradable gold rallies during 2017 and
gold will possibly remain above its December-2015 bottom. It's just that
the type of price action that could reasonably be categorised as a bull
market will not happen until gold's true fundamentals turn bullish.
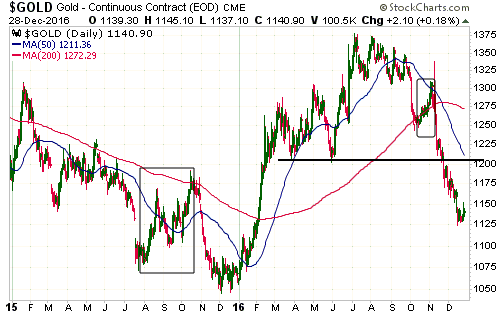
Current Market Situation
We
have been expecting a short-term rally in the gold market, but the
expected rally has proved elusive to date. All that's happened so far is a
very small bounce from the mid-December low.
To be more specific
about what we are anticipating, we are looking for something of similar
magnitude to either the 1-month rebound that occurred in October of this
year or the 3-month rebound that occurred in July-October of last year
(the boxed areas on the following daily chart). Whether we get a
relatively minor 1-month rebound or a larger 2-3-month rebound will be
determined by the ability to breach resistance in the low-$1200s. This
resistance will likely cap a minor rebound, but if it is breached it will
mean that a rise to the vicinity of the 200-day MA (the red line on the
chart) is probably in store.
Apart from being a reaction to the
'oversold' extreme, the coming gold rebound will probably be driven by a
rebound in the T-Bond (the Treasury market is even more 'oversold' than
the gold market) and a correction in the Dollar Index.
Gold Stocks
The bounce over the past few days
in the gold-mining sector was more vigorous than the bounce in the gold
price. However, the HUI hasn't yet signaled a short-term trend reversal.
Trend-defining resistance for the HUI is falling and is now at
185-190. We would therefore take consecutive daily closes above 190 as
confirmation of an upward reversal in the HUI's short-term trend.
One plausible possibility is that the HUI has completed the left shoulder
and almost completed the head of a short-term a "head and shoulders"
bottom. If so, a rise to 185-190 will be followed by a pullback to 170-175
and then a rise to at least 200.
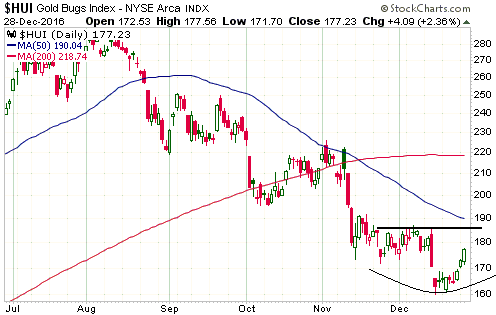
We expect that the HUI will at least rebound to its 200-day MA during
the first quarter of 2017, but first it needs to clearly signal a reversal
by closing above 190.
The Currency Market
The Dollar Index has traded sideways since reaching some sort of peak on
15th December (the day after the Fed's widely-anticipated rate hike). We
think that it has made or is close to making a 1-2 month top, but the
price action hasn't yet validated our thinking. We could be right and the
sideways movement of the past two weeks could be part of a short-term
topping pattern, but there is also a realistic chance of a surge to new
highs.
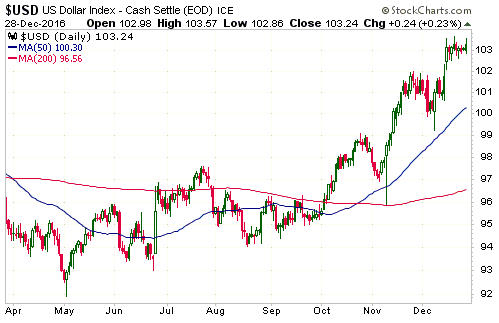
Many of the recent short-term market trends are linked. In particular,
upward trends in the US$, the stock market and the oil market are linked
to downward trends in the gold and T-Bond markets. All of these trends
have shown tentative signs of reversing, but at this stage no trend
changes have been clearly signaled.
Updates on Stock Selections
Notes: 1) To review the complete list of current TSI stock selections, logon at
http://www.speculative-investor.com/new/market_logon.asp
and then click on "Stock Selections" in the menu. When at the Stock
Selections page, click on a stock's symbol to bring-up an archive of
our comments on the stock in question. 2) The Small Stock Watch List is
located at http://www.speculative-investor.com/new/smallstockwatch.html
![]() Tax-Loss
Candidates
Tax-Loss
Candidates
Tax-loss candidates are small-cap stocks that
appear to have been pressured downward during December (the final month of
the tax year in the US and Canada) by the selling of retail investors
wanting to book tax losses before year-end. The downward price pressure
stemming from tax-related selling can create good opportunities to make
short-term and long-term buys in stocks that have become extremely weak
for a reason that has nothing to do with the value and prospects of the
underlying company.
Buying stocks near year-end that have been
beaten down by tax-related selling can work well as a 2-4 week trade
because prices will often rebound strongly during the first half of
January. However, the stocks that are most affected by tax-loss selling
have low liquidity, so quickly moving in and out of the best tax-loss
candidates is usually only possible with small positions. We therefore
tend to view the downward pressure caused by tax-loss selling as an
opportunity to add to intermediate- or long-term positions in our favoured
stocks rather than as an opportunity to scalp a quick profit.
Here
are five stocks, listed in alphabetical order, that appear to have been
victims of tax-loss selling and have the potential to rebound strongly in
January. Three of these stocks have unfortunately already bounced by more
than 20% from their December lows and in doing so have probably removed
about half of the potential short-term upside, but pullbacks over the
final two trading days of this week could set the stage for strength over
the ensuing two weeks.
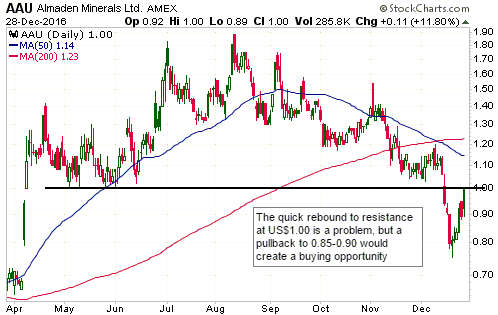
1) Almaden Minerals (AAU, AMM.TO) -- an
exploration-stage gold stock and a member of the TSI Stocks List. AAU
plunged during the first half of December due to a ramp-up in selling
pressure that was not based on any company-specific issues that we are
aware of.
AAU's performance over the next two months should be
helped by the announcement of positive PFS results for its Tuligtic
gold-silver project in Mexico.
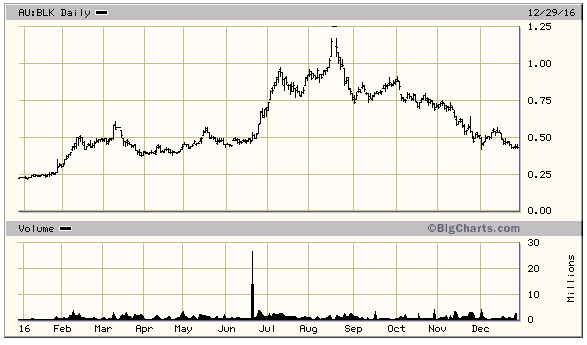
2) Blackham Resources (BLK.AX) -- a junior gold producer and a member
of the TSI Stocks List. Due to being listed in Australia BLK wouldn't
normally be significantly affected by tax-loss selling in Canada and the
US, but an equity financing arranged in August brought North American
investors into the stock. This financing was arranged near the top of the
market so all of the North American buyers of BLK would have ended up with
losses.
Assuming that it will meet its production targets, BLK's
valuation is now extremely low. It is on track to be a 100K-oz/year gold
producer operating in the world's lowest-risk jurisdiction (Western
Australia) and has an enterprise value of only US$90M. Our
intermediate-term valuation-based target is about 150% above the current
stock price.
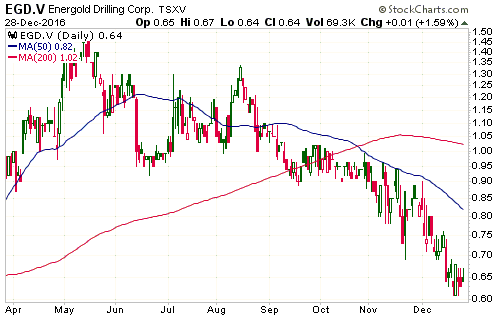
3) Energold Drilling (EGD.V) -- a minerals and O&G drilling services
company and a member of the TSI Stocks List. EGD's stock price has been in
a steady decline over the past two months and there is no evidence that it
has bottomed, but the valuation is now very low and a shift in sentiment
could lead to a sharp rebound within the coming month.
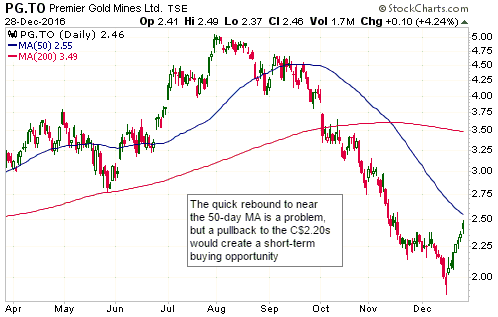
4) Premier Gold (PG.TO) -- a junior gold producer and a member of the
TSI Stocks List. PG is undervalued and made what looks like a trend-ending
downward spike during the first half of December.
PG's performance
over the next two months will potentially be helped by the company's
Q4-2016 cash flow being better than expected by the market.
5) Titanium Transportation Group (TTR.V) -- a Canada-based trucking
and logistics company and NOT a current member of the TSI Stocks List.
We've never previously mentioned TTR, but we have been following the
stock since its IPO in April-2015 and traded it successfully at that time
(we bought at the pre-IPO financing price of C$1.50 and sold for a quick
double). It has never been worth mentioning at TSI because 1) a worsening
environment for trucking and logistics businesses led to TTR missing its
growth forecasts and a relentless decline in its market value, 2) our view
that a US recession wasn't far away meant that we didn't see a good reason
to expect a business turnaround, and 3) until recently it simply didn't
look cheap enough. It now looks cheap enough and the upside breakout in
the Dow Transportation Average indicates that 2017 could be a decent year
for transportation-oriented businesses.
TTR expects to generate
C$120M of revenue and C$14M of EBITDA over the next 12 months. Taking into
account these figures, the company's growth potential and the risk posed
by the company's weak balance sheet (C$40M of net debt), an argument could
be made that TTR is worth about C$2.30/share. This assumes an EBITDA
multiple of 9-times, which is about average for a Canadian
trucking/logistics business. The current stock price is C$1.50.
For
a while it appeared as if an opportunity to buy TTR in the low-C$1 area
would arrive before year-end, but during the first half of December the
stock quickly recovered from below C$1.20 to above C$1.50.
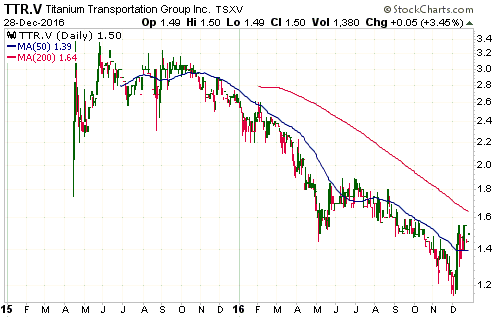
Chart Sources
Charts appearing in today's commentary
are courtesy of:
http://stockcharts.com/index.html
http://www.barchart.com/
http://bigcharts.marketwatch.com/
![]()