![]()
![]()
![]()
![]()
- Interim Update 29th March 2017
Copyright
Reminder
The commentaries that appear at TSI
may not be distributed, in full or in part, without our written permission.
In particular, please note that the posting of extracts from TSI commentaries
at other web sites or providing links to TSI commentaries at other web
sites (for example, at discussion boards) without our written permission
is prohibited.
We reserve the right to immediately
terminate the subscription of any TSI subscriber who distributes the TSI
commentaries without our written permission.
New Charts
As part of our attempts to make
the "Charts and Indicators" section of the TSI web site more interesting
and useful, five new charts have been added. The new charts show the
long-term inflation-adjusted (IA) performances of gold, silver, the Dow
Industrials Index, oil and the GSCI Commodity Index (GNX).
These
charts, which will be updated monthly (around the middle of each month
based on data for the preceding month), are unique to TSI. This is because
they are based on our own method of inflation-adjusting.
The market is
definitely wrong about something
Although the yield on the US
2-year T-Note has been trending upward since the beginning of July last
year, it is at an unrealistically-low level considering what the Fed is
telegraphing. Specifically, based on the present level of the overnight
rate on Federal Funds (the interest rate dictated by the Fed) and what the
Fed has signaled it will do over the coming 15 months, the yield on the
2-year T-Note should be comfortably above 1.50%. However, it is below
1.30%. This means that either the market's expectations are wrong or the
Fed's expectations are wrong. The thing is, the only way the market's low
expectations regarding short-term interest rates could be right is if its
high expectations regarding corporate earnings growth and equity
performance are wrong. That is, the 'market' is definitely wrong about
something important!
Putting it another way, there is no chance
that the Fed will only hike its targeted interest rate twice between now
and mid-next-year, which is roughly what the current yield of the 2-year
T-Note implies, if the stock market continues to trend upward. Instead,
the stock market will have to weaken substantially or at least
persistently over the remainder of this year to bring the Fed into line
with what traders of 2-year T-Notes are now collectively forecasting.
Alternatively, the market for short-term Treasury securities will have
to adjust its interest-rate expectations upward over the next several
months. This is something that it will be forced to do if the current
stock-market optimism proves to be correct.
The financial markets
are interconnected, so changes in interest rates don't just affect the
prices of credit instruments such as 2-year T-Notes. Of particular
relevance, changes in interest rates have dominated the currency market
over the past 12 months and the combination of interest rates and currency
exchange rates always has a big influence on the gold market. Actually,
over the past 18 months the gold price has been strongly correlated with
changes in the 2-year T-Note yield in isolation, which is unusual. This
correlation is illustrated by the following chart on which the 2-year
yield (the black line) is compared with the reciprocal of the gold price.
We used the reciprocal of the gold price to make the intermarket link more
visually clear, but keep in mind that the relationship we are illustrating
is an inverse one -- the gold price falls when the 2-year yield rises,
etc.
The above chart suggests that the gold price will come under
irresistible downward pressure over the next couple of months if the
2-year T-Note yield rises to a new high for the year, which is something
it will likely do if the stock market extends its rally. It also suggests
that the gold price will come under irresistible upward pressure if the
2-year T-Note yield falls below its February low, which is something it
will likely do if the stock market begins to trend downward with
conviction.
The Stock Market
The US
Almost all of the reasons we have listed for being short- and
intermediate-term bearish on the US stock market remain valid, but a
beautifully-constructed thesis is of no positive consequence unless it is
confirmed by the price action within a certain time-frame. The problem at
the moment is that our 'beautifully-constructed thesis' is not being
confirmed by the price action.
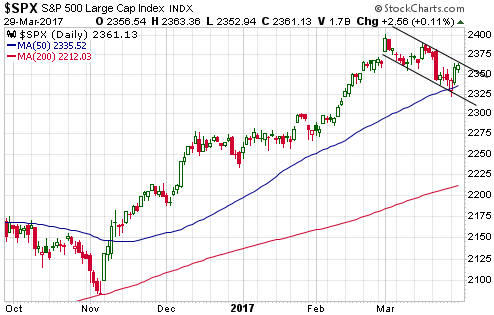
For example, as time goes by the
decline in the S&P500 Index (SPX) from its 1st March peak looks
increasingly like a bullish "flag" pattern -- a routine pullback within an
upward trend.
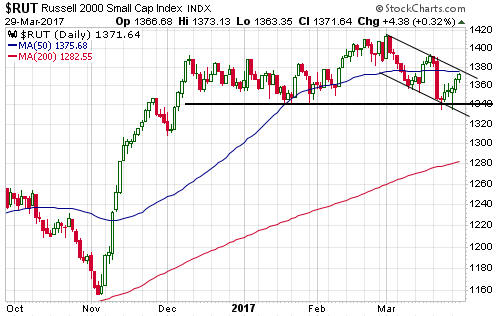
For a second example, the Russell2000 Small Cap Index (RUT) has
managed to hold above trend-defining support at 1340 to date.
For a third example, the Dow Transportation Average (TRAN) rebounded
strongly enough during the first half of this week to suggest that last
week's downside breakout was a false signal. It needs to end this week
below 9000 to avoid negating last week's bearish signal.
Due to the increasing risk that our bearishness is premature (again)
we may decide to exit our short-term bearish speculations before the end
of this week. In fact, we will almost certainly do so unless TRAN moves
back below 9000 before week's end.
If we do exit we will wait for a
new opportunity to enter similar trades, the reason being that the
probability is high that a substantial decline will happen at some time
over the next few months. It's just a matter of not being too far out with
the timing.
On a related matter, it occurs to us that the stock
market is giving the Trump administration an extraordinary amount of
leeway. Despite a series of what should have been confidence-sapping
missteps by the new administration, equity-trader confidence in the Trump
program remains sky-high.
The missteps we are referring to are the
botched immigration ban, the running-down of the Treasury's cash reserve
during the weeks leading up to the reinstatement of the government debt
ceiling, and the failure to pass a bill that replaces "Obamacare". These
demonstrations of incompetence had the potential to create widespread
doubt regarding Team Trump's ability to fulfill the tax-cutting,
infrastructure-spending and de-regulating promises on which the
post-election stock market exuberance was based, but the market still
seems to be assuming that all the 'good stuff' will happen as originally
forecast.
Moreover, it's not like the stock market is insulated
from unexpected negative developments by a low average valuation. Instead,
it is priced for perfection.
We think that speculators betting on
a continuation of the stock market's upward trend are effectively playing
Russian roulette with a 6-shooter gun containing at least 3 bullets.
Perhaps they will get lucky for a short while longer, but they are playing
a very dangerous game.
Gold and the Dollar
Gold
The
US$ gold price returned to its 200-day MA and its February peak during the
first half of this week, but it hasn't yet broken out to the upside and
the additional gold-price firmness received no validation from the
gold-mining sector. We don't expect the gold price to make a sustained
break above its February high anytime soon, but a short-lived spike to a
new high for the year wouldn't surprise us.
We took advantage of the metals' price firmness during the first two
days of this week to add to our gold hedge (via June GLD puts) and
establish a silver hedge (via June SLV puts).
Gold Stocks
Current Market Situation
The
US$ gold price moved up to its February high on Monday 27th March, but
despite this bullion-market strength GDX (the Gold Miners ETF) was unable
to close above its 50-day MA. GDX has now traded at or slightly above its
50-day MA on 6 of the past 10 trading days without managing a single daily
close above it.
The gold sector's recent price action has been challenging with regard
to both trading and commentary-writing. This is because it has not created
any excellent buying or selling opportunities and because the narrow
horizontal price range of the past two weeks has been sleep-inducing.
We continue to expect that the next excellent opportunity will be the
buying kind, possibly as soon as early-May and almost certainly no later
than end-July. Unfortunately, to get an excellent buying opportunity there
will first have to be a clearing-of-the-decks decline.
A daily GDX
close below $22.50 would be a warning that the aforementioned decline had
begun, while a daily close above $23.50 would indicate that a return to
the vicinity of the 200-day MA and the February peak (around $25.00) was
likely to precede a substantial multi-week decline.
In the
meantime, patience is required. When a market is not offering any
clear-cut buying or selling opportunities it's important to do very
little.
Ecuador versus Turkey
In the latest Weekly Update we wrote about Mariana Resources (MARL.V),
a company that owns 30% of one of the world's best undeveloped gold
projects (Hot Maden) in one of the world's highest-risk countries
(Turkey). Today we wanted to quickly compare Turkey with Ecuador. This is
because until recently Ecuador was widely considered to be too risky for
mining investment, but gold-mining investors and speculators have been
getting more optimistic about Ecuador at the same time as they have been
getting more wary about Turkey. Is this reasonable? In other words, has
the mining-investment environment in Ecuador improved to the point where
it is now satisfactory in absolute terms and much better than the
mining-investment environment in Turkey?
The answer is no. We get
the impression that gold-mining investors/speculators are 'turning a blind
eye' to the risks and costs of operating in Ecuador, and even though we
view Turkey's political risk as unacceptably high we would actually prefer
to invest in a mining project in Turkey than to invest in an identical
mining project in Ecuador.
The turnaround in the perception of
Ecuador as regards to mining probably began with the purchase by Lundin
Gold (LUG.TO) of the Fruta del Norte (FDN) gold project a little more than
two years ago. If Fruta del Norte is not the best gold discovery of the
past 15 years it is definitely in the top 5. It is a truly exceptional
deposit, but Kinross Gold (KGC) eventually sold it for peanuts because the
company couldn't come to a reasonable agreement with the Ecuador
government regarding the government's take (taxes, royalties, etc.). LUG
subsequently came to an agreement with the government that enabled the FDN
project to be moved towards a construction decision, and this, combined
with encouraging words from the country's senior politicians, caused a
large positive change in the Western perception of Ecuador as a place to
have a mining business.
We are not qualified to assess the
environmental, community-relations and political risks associated with
getting a mine permitted and built in Ecuador, but we are capable of
looking beyond the hype at the cold, hard numbers. The numbers to which we
are referring are in the FDN project's Feasibility Study (FS).
One
number in particular stands out, which is the 15.7% IRR (Internal Rate of
Return) at a gold price of US$1250/oz. This tells us that the project is
barely economic at $1250/oz. How could that be? How could such a
phenomenal gold deposit have such a low IRR at $1250/oz?
The main
part of the answer is that although LUG was able to negotiate a better
deal with the Ecuador government than the one KGC balked at, the terms are
still onerous for the mining company. Due to the combination of royalties,
taxes and "profit-sharing", the government's take will be high enough to
transform what should have been a very lucrative mining operation into a
mediocre one (at $1250/oz the government's total take over the life of the
mine is expected to be almost US$1B).
On a wider scale, the
problem is that the terms of LUG's agreement with the government will be
applied to all other projects that are progressed to the mine-construction
phase. If these terms are such that one of the world's best gold deposits
is barely economic at $1250/oz, then what are the economics going to be
like for most other projects? The answer is that unless the government
changes the rules* to allow mining companies to keep more of what they
earn, almost all the projects that are currently being explored in Ecuador
will be economically unattractive at $1250/oz regardless of the deposit's
size and quality.
The situation in Turkey is different and arguably
not quite as bad. In Turkey, the current rules that determine the
government's take enable great deposits to have great economics. For
example, at $1250/oz the economics of Mariana's Hot Maden project are
almost 10-times better than the economics of LUG's FDN project. The
problem in Turkey is the uncomfortably high risk that something will
happen 'out of the blue' that wipes out all value for shareholders. That
"something" could be a military coup or a rebellion or an arbitrary
decision by the government to transfer ownership of the project.
The difference, in a nutshell, is that in Turkey it should be possible to
make money from a high-quality deposit unless something disastrous happens
on the political front, whereas in Ecuador it will be almost impossible to
build a profitable mining operation unless there's a substantial change in
the political environment.
*Constructive
rule changes could happen if the pro-business candidate (Lasso) wins
Ecuador's Presidential election run-off on 2nd April, but at this time the
more socialistic candidate (Moreno) has a slight lead in the polls.
The Currency Market
On Monday of this week the
Dollar Index broke below lateral support at 99.25 and almost reached its
200-day MA at 98.5. It then quickly moved back above 99.25, opening up the
possibility that a false downside breakout has marked the end of the
dollar's multi-month correction.
The Dollar Index will have to
break above 102 to confirm that its downward correction is over, so there
is still a lot of work to be done. Also, Monday's low of 98.67 now becomes
an important line in the sand. Closing below this level would definitely
be a problem for our intermediate-term bullish outlook for the Dollar
Index.
Updates on Stock Selections
Notes: 1) To review the complete list of current TSI stock selections, logon at
http://www.speculative-investor.com/new/market_logon.asp
and then click on "Stock Selections" in the menu. When at the Stock
Selections page, click on a stock's symbol to bring-up an archive of
our comments on the stock in question. 2) The Small Stock Watch List is
located at http://www.speculative-investor.com/new/smallstockwatch.html
Chart Sources
Charts appearing in today's commentary
are courtesy of:
http://stockcharts.com/index.html
![]()