|
- Interim Update 29th April 2009
Copyright
Reminder
The commentaries that appear at TSI
may not be distributed, in full or in part, without our written permission.
In particular, please note that the posting of extracts from TSI commentaries
at other web sites or providing links to TSI commentaries at other web
sites (for example, at discussion boards) without our written permission
is prohibited.
We reserve the right to immediately
terminate the subscription of any TSI subscriber who distributes the TSI
commentaries without our written permission.
Fed Fallout
The Fed issued its latest monetary policy statement on Wednesday
afternoon in the US. Interestingly, the gold, currency and bond markets
had ended Tuesday's session almost exactly where they had ended the
17th March trading session (17th March was the day prior to the
previous monetary policy announcement). The Fed's 18th March
announcement prompted some wild market action (large jumps in gold and
bond prices as well as a plunge in the US$), so many market
participants were undoubtedly on tenterhooks as they awaited the
central planning agency's next ruling.
With bonds, gold and the Dollar Index near short-term support levels,
Wednesday's market reaction to the Fed news had the potential to be
significant. It had the potential, in fact, to determine the general
direction of prices over the ensuing few weeks. However, this time
round the Fed announcement contained no surprises -- the 29th April
Statement was very similar to the 18th March Statement, with the only
noteworthy difference being a comment about the slowing rate of
economic contraction -- and the market reaction didn't resolve
anything. The US$ was down and gold was up, but neither moved by enough
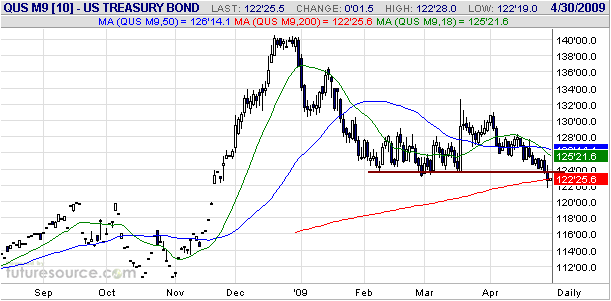
to effect a breakout. The most significant development was the breach
of support by the June T-Bond futures contract (refer to the following
daily chart for details), but even here the evidence is inconclusive
because the 30-year T-Bond's breakdown was not confirmed by the more
heavily traded 10-year T-Note.
"Global Warming" Notes
1. There are natural long-term temperature cycles, including 100-year
and 1000-year cycles. For example, 800 years ago -- many centuries
before humans began to burn fossil fuels in significant quantities --
the Earth's atmosphere was considerably warmer than the highest average
global temperature of the past two decades, whereas in between then and
now there were periods when temperatures were much lower than they are
today. The fact is that global warming periodically occurs, as does
global cooling. Polar bears have obviously been able to adapt to these
temperature cycles.
2. There are shorter-term temperature cycles of around one decade in
length that appear to be influenced to the greatest extent by sunspot
activity. The sizeable decline in the average global temperature over
the past two years, for example, has coincided with a large decline in
sunspot activity (a large rise in the number of "spotless" days).
3. The sunspot-related temperature decline of the past two years has
been "inconvenient" for the Global Warming Alarmists because it has
resulted in the polar ice caps expanding to their average level of the
past 30 years and the global temperature dropping back to 1980s levels,
despite the greater amount of CO2 now in the atmosphere. But as
discussed in item 5 below, the Alarmists have an ace up their
collective sleeve.
4. Some time ago it was discovered that there has been a positive
correlation over the millennia between temperature and the level of CO2
in the atmosphere. Al Gore used this correlation to dramatic effect in
his much-heralded promotion of the Global Warming cause, but additional
data collected since then shows that the CO2 level FOLLOWS the
temperature change, not the other way round. In other words, the
empirical data suggest that if there is a long-term cause-effect
relationship between CO2 and temperature it works the opposite way to
the way in which Gore and Co. claimed.
5. There is evidence that the world has embarked on a cooling cycle,
but not to worry: the term "Global Warming" is in the process of being
replaced by the more general term "Climate Change". Altering the
terminology in this way is smart because the Earth's climate has been
changing since the beginning of time and will continue to do so
REGARDLESS of what mankind does or doesn't do. In other words, the
climate alarmists are ensuring that they will have justification for
imposing their collective will no matter what.
6. Some scientists extrapolated the most recent upward trend in
temperature to yield cataclysmic forecasts. This was akin to someone in
the Northern Hemisphere noticing, in August, that the temperature had
been rising month after month since March and exclaiming: "If this
keeps up we'll all be dead by December!"
7. The claim made by the current US President and other politicians
that the science of Global Warming is beyond dispute is a lie. Many
scientists dispute the idea that human-generated carbon emissions have
a significant effect on global temperature, including the more-than 100
scientists who signed the petition at http://www.cato.org/special/climatechange/ClimateAd_ChicagoTrib_Rev.pdf and the 31,000 scientists who signed the petition mentioned in this Telegraph article.
8. Despite the US Environmental Protection Agency's assertion to the contrary, CO2 is NOT a pollutant.
The Stock Market
Current Market Situation
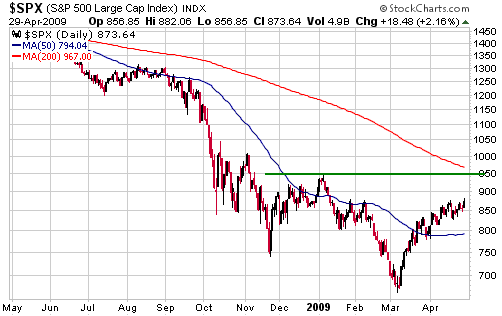
The daily chart of the S&P500 Index displayed below shows that the
index's 200-day moving average is now approaching lateral resistance at
950. We continue to believe that the S&P500's 200-day moving
average defines the market's maximum short-term upside potential.
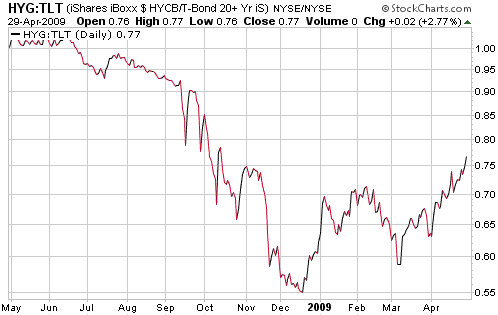
The HYG/TLT ratio
reflects the performance of high-yield bonds relative to the
performance of Treasury Bonds. As evidenced by the following chart,
this ratio has just moved to its highest level in more than 6 months.
This indicates that credit spreads are continuing to narrow and that
confidence is returning to the debt markets.
Unfortunately, the increasing optimism reflected by indicators such as
credit spreads and consumer confidence surveys doesn't tell us anything
about the future because sentiment was likely to become more optimistic
during the first half of this year regardless of the longer-term
outlook. For example, there was also a strong rebound in confidence
during the first half of 1930.
Stock markets around
the world were affected early this week by fear of a possible Swine Flu
pandemic. From our perspective, the threat to the global economy posed
by Swine Flu is so trivial compared to other risks and problems that we
wouldn't bother to mention it except that it is being dramatised by the
media, the World Health Organisation and many governments. It seems
that every few years we 'need' a major health scare to take peoples'
minds off what really matters and to demonstrate the good work that
governments do to ensure our safety.
A dire economic forecast
We thought we were bearish on the US economy, but we are optimists
compared to long-term economic trend forecaster Gerald Celente. Mr
Celente shares some of his views in this interview: http://www.youtube.com/watch?v=Q2qDW34Fr64
Here's a quote that we liked:
"You can't print money
based on nothing. It's not even Economics 101; it's economics for
dummies. That's why gold prices are going up. You're going to look back
in history and think: "my God, how could these people have been so
stupid!""
Uranium Stocks
In the latest Weekly Update we discussed the strange divergence between
the price of natural gas (the commodity) and the prices of natural gas
equities. Specifically, we noted that natgas equities had been rallying
while the natgas price had remained in a relentless decline that had
taken it to 5-year lows, and that this divergent behaviour had pushed
the XNG/natgas ratio (the AMEX Natural Gas Index relative to the natgas
price) way above all previous extremes.
It's a similar story with regard to the relationship between the price
of uranium and the prices of uranium equities in that uranium has been
one of the strongest stock market sectors since last October even
though the price of the underlying commodity remains near a multi-year
low. That being said, the divergence between the price of uranium and
the prices of uranium equities is easier to explain than the divergence
between natural gas and natural gas equities. For one thing, there is
no near-term supply glut weighing down the price of uranium. It is
clear that speculation drove the uranium price way too high during
2006-2007, but the price now appears to be at a level where mine supply
combined with the supply from other sources is barely adequate to
satisfy current demand. For another thing, there are only a handful of
listed companies in the world with significant current uranium
production, so it takes only a small increase in the investment demand
for uranium equities to create a strong sector-wide rally.
As is the case with natural gas equities, we think investors/traders
should look for opportunities to scale back their exposure to uranium
equities into strength over the next few weeks. There is significant
additional short-term upside potential in the uranium sector, but as we
get closer to mid-year the downside risk in all non-gold stocks will
ramp up. However and as is also the case with natural gas equities, we
think it will make sense to retain a core uranium position in line with
the sector's longer-term bullish outlook.
Global Warming, discussed earlier in today's report, is one aspect of
the aforementioned longer-term bullish outlook for uranium and uranium
equities. Global Warming (the man-made variety) is most likely a giant
hoax, but the political ship has set a course that it probably won't
deviate from regardless of the facts. Additionally, whether or not
mankind's burning of fossil fuels is an important cause of "climate
change", all things being equal it would certainly be better to have
less air pollution. And at this time it seems that the most
economically feasible way to achieve a meaningful reduction in GLOBAL
air pollution is to expand the use of nuclear power. The main reasons
why this is so are outlined in a very good article by Peter Huber that
John Mauldin re-produced in his latest "Outside the Box" letter.
Mr. Huber explains that most of the world's pollution is generated by
the 5 billion poor people, which means that for a cleaner-energy
solution to be truly viable it must also be cheap. He also explains
that the expensive clean-energy solutions that are presently
fashionable within the ranks of the 1.2 billion rich people not only
don't have the ability to bring about a material reduction in global
pollution, they will very likely cause pollution levels to INCREASE by
making relatively dirty energy sources even cheaper for the most
inefficient energy consumers. For example, the less coal that gets used
in the US the lower the international coal price will become, leading
to more coal being burned in countries such as China that use energy
less efficiently than the US. Lastly, he points out that governments
put their own economies at a major disadvantage when they force the use
of expensive energy alternatives.
To end this discussion, here are excerpts from the above-linked article:
"The oil-coal economics
come down to this. Per unit of energy delivered, coal costs about
one-fifth as much as oil -- but contains one-third more carbon. High
carbon taxes (or tradable permits, or any other economic equivalent)
sharply narrow the price gap between oil and the one fuel that can
displace it worldwide, here and now. The oil nasties will celebrate the
green war on carbon as enthusiastically as the coal industry celebrated
the green war on uranium 30 years ago.
The other 5 billion are
too poor to deny these economic realities. For them, the price to beat
is 3-cent coal-fired electricity. China and India won't trade 3-cent
coal for 15-cent wind or 30-cent solar. As for us, if we embrace those
economically frivolous alternatives on our own, we will certainly end
up doing more harm than good.
By pouring money into
anything-but-carbon fuels, we will lower demand for carbon, making it
even cheaper for the rest of the world to buy and burn. The rest will
use cheaper energy to accelerate their own economic growth. Jobs will
go where energy is cheap, just as they go where labor is cheap.
Manufacturing and heavy industry require a great deal of energy, and in
a global economy, no competitor can survive while paying substantially
more for an essential input. The carbon police acknowledge the problem
and talk vaguely of using tariffs and such to address it. But carbon is
far too deeply embedded in the global economy, and materials, goods,
and services move and intermingle far too freely, for the customs
agents to track."
..."So the suggestion
that we can lift ourselves out of the economic doldrums by spending
lavishly on exceptionally expensive new sources of energy is absurd.
"Green jobs" means Americans paying other Americans to chase carbon
while the rest of the world builds new power plants and factories. And
the environmental consequences of outsourcing jobs, industries, and
carbon to developing countries are beyond dispute. They use energy far
less efficiently than we do, and they remain almost completely
oblivious to environmental impacts, just as we were in our own first
century of industrialization. A massive transfer of carbon, industry,
and jobs from us to them will raise carbon emissions, not lower them."
Gold and
the Dollar
Gold
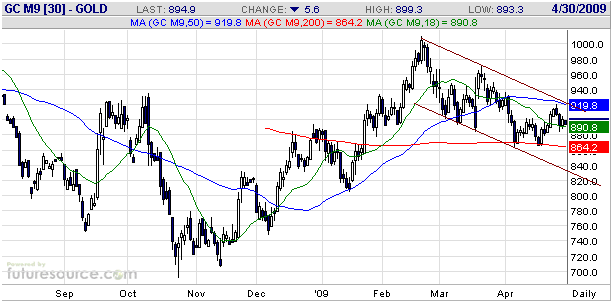
In the latest Weekly Update we wrote: "...if
June gold were to move below $890 on a daily closing basis it would
negate last week's bullish price action. Short-term traders could
therefore consider going 'long' near the current price (or, ideally,
following a pullback over the coming 1-2 days) and placing a closing
stop at around $890. That is, plan to exit short-term positions if June
gold CLOSES below $890."
The gold market pulled back over the first two days of this week, but
June gold held above $890 on a daily closing basis. The gold price then
rose on Wednesday, but all of Wednesday's trading occurred within
Tuesday's trading range. Wednesday was therefore an "inside day", and
inside days rarely provide any useful information.
The upshot is that nothing of consequence happened in the gold market
over the first three days of this week. June gold remains above $890
and below the top of the downward-sloping channel that has defined its
progress since late February.
Gold Stocks
As was thought likely, the rapid advance of last Thursday-Friday was
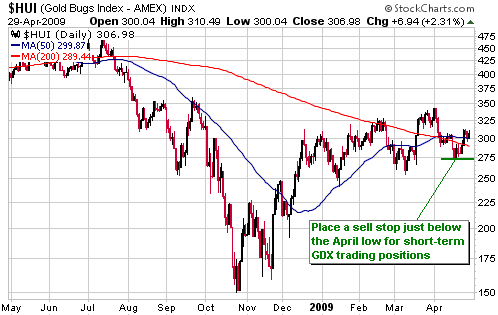
followed by a 1-2 day pullback. This pullback took the HUI down to the
290s, but didn't do any damage to the bullish technical picture.
The HUI would have to close below support defined by its mid-April low
to completely negate the idea that a rally to the channel top or higher
has begun. Traders who are long the gold sector via the gold mining ETF
(GDX) should therefore exit if the HUI closes below this support.
Currency Market Update
The Dollar Index looks like it is on its way back to the low-80s, but
we continue to believe that the dollar's downside risk is fairly small
(no more than a few points) due to the problems of its main fiat
currency counterparts. The situation during 2000-2003 was very
different because at that time the US$ was over-valued relative to the
euro and most other currencies. Now, with the US$ at a much lower level
and with other currencies having depreciated at faster rates the case
for a much lower foreign exchange value for the US$ is weak. The case
for a much lower gold value for the US$ is, however, stronger than ever.
Update
on Stock Selections
(Note: To review the complete list of current TSI stock selections, logon at http://www.speculative-investor.com/new/market_logon.asp
and then click on "Stock Selections" in the menu. When at the Stock
Selections page, click on a stock's symbol to bring-up an archive of our comments on the stock in question)
 Precision Drilling Trust (NYSE: PDS, TSX: PD.UN). Shares: 276M issued, 291M fully diluted. Recent price: US$4.75, C$5.73 Precision Drilling Trust (NYSE: PDS, TSX: PD.UN). Shares: 276M issued, 291M fully diluted. Recent price: US$4.75, C$5.73
The details of PDS's rights offer have been announced. The Canada-based
owners of PDS units as of 1st May will be given rights to buy one new
unit at C$3.00 for every seven units they own (they will actually
receive one right for each PDS unit they own, with seven rights plus
C$3.00 being exchangeable for one new unit). Unit-holders will also be
given the option to apply for units beyond their one-for-seven
allotment, but additional units will only be available for sale if some
unit-holders do not take up their entitlements. The rights offer will
close on 3rd June 2009.
The rights will trade on the TSX under the symbol PD.RT.
Unit-holders based outside Canada will not receive rights to purchase
additional units. Instead, the rights that they would otherwise be
entitled to receive will be sold on the stock market by the
"Subscription Agent" seven days prior to the cessation of rights
trading. The proceeds of the sale will then be mailed to these
unit-holders.
Given that the exercise price of the rights is a long way below the
stock's current market price we suggest that Canadian unit-holders
apply for as many of the new units as they can. For TSI record purposes
we will assume that the rights are sold on the market and will
accordingly adjust the entry prices of our PDS investment and trading
positions.
 Northgate Minerals (AMEX: NXG, TSX: NGX). Shares: 256M issued, 263M fully diluted. Recent price: US$1.46 Northgate Minerals (AMEX: NXG, TSX: NGX). Shares: 256M issued, 263M fully diluted. Recent price: US$1.46
In the latest Weekly Update we said that the gold stocks with the best
short-term risk/reward ratios are the juniors that offer significant
current production, current cash flow, solid balance sheets, and
reasonable stock market liquidity. Northgate Minerals (NXG) meets these
criteria and has a very low valuation to boot. A chart of NXG was shown
in the Weekly Update.
NXG is presently in the TSI Stocks List as a longer-term holding, but
we have decided to also include a short-term trading position in the
stock at Wednesday's closing price of US$1.46. Our initial closing stop
will be US$1.18 (just below the April low), meaning that we will exit
with a loss if the stock CLOSES at US$1.18 or lower. If/when the stock
closes above US$1.55 we will switch to a 15% trailing stop, effective,
again, on a daily closing basis.
 Andina Minerals (TSXV: ADM). Shares: 73M issued, 81M fully diluted. Recent price: C$1.34 Andina Minerals (TSXV: ADM). Shares: 73M issued, 81M fully diluted. Recent price: C$1.34
One of the best times to 'nibble away' at a high potential, but
relatively illiquid, exploration-stage gold stock is after the stock
has spent a lengthy period drifting sideways or lower due to the
absence of news. After a stock has done nothing for a while some small
investors will lose interest and sell, which can create a good
opportunity for other investors to build up positions at very low
valuations.
Andina is a good current example of such a stock. As illustrated by the
following chart, the ADM stock price peaked at around the same time as
the gold price in late February. And, like gold, ADM has since been
wandering lower within the confines of a channel.
Stocks such as ADM do not offer enough liquidity to make good
short-term trading vehicles. They can, however, be suitable vehicles
for patient investors looking for ways to accumulate gold-in-the-ground
at ultra-low prices.
Chart Sources
Charts appearing in today's commentary
are courtesy of:
http://stockcharts.com/index.html
http://www.futuresource.com/

|

