|
- 29 May, 2002
Do central
banks control the gold price?
There is no doubt that central banks
attempt
to control the gold price. They joined forces during the 1960s to maintain
the gold price at the 'official' target level and auctioned gold during
the 1970s in a concerted effort to reduce the market price of gold. Over
the past 20 years the overt interventions of the 1960s and 1970s have been
replaced by covert interventions. For example, over the past decade a huge
volume of central bank gold has come onto the market in the form of gold
loans and swaps. These loans and swaps do not result in reductions to reported
gold reserves and have, therefore, gone largely unnoticed by the mainstream
investment world. Since there is a conspicuous lack of transparency when
it comes to central bank gold lending/swapping, the actual amount of gold
that has reached the market via such means is a contentious issue (reliable
sources put the figure at around 15,000 tonnes whereas unreliable sources
say the figure is only about 4,000 tonnes). Whatever the size of the loans/swaps,
the official reason given for mobilising gold reserves in this way is to
earn income on an otherwise dormant asset. However, since gold interest
rates are generally around 1% this official reason just doesn't 'cut it'.
It makes no sense that central bankers would risk losing their country's
gold reserves in order to make a paltry 1%. There must be another reason
and that reason is almost certainly to apply downward pressure to the gold
price.
We are confident that central banks
have been attempting to manipulate the gold market over the past several
years. We are also confident that they will continue their manipulation
in the future. So, how successful will they be? According to Mitsui gold
analyst Andy Smith, they will be very successful. As we understand it,
Mr Smith doesn't think that central banks will dump their gold onto the
market in a deliberate attempt to hold down the gold price, but he does
expect them to dump a lot of gold onto the market over the next few years
for other reasons. Furthermore, he expects central bank selling (or lending)
to drive the gold price down to multi-decade lows (below $100).
Where Mr Smith goes wrong is where
a lot of people are presently going wrong - he is drawing conclusions on
the basis that the trends of the 2000s will simply be an extension of the
trends of the 1990s.
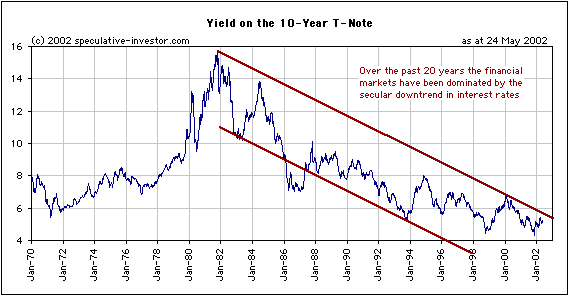
Below is a long-term chart showing
the yield on US 10-year T-Notes. The dominant trend in the financial markets
over the past 20 years has been the relentless move towards lower long-term
interest rates. One consequence of this secular downtrend in interest rates
was a dramatic expansion of price-earnings ratios in the stock market and,
therefore, a secular bull market in stocks. Another consequence was a bull
market in central banking.
An environment in which the visible
signs of inflation are diminishing and in which the primary trend for interest
rates is down dampens the effects of central banking errors. For example,
the Greenspan-led Fed has made one mistake after another over the past
15 years but has, up until now, retained its credibility. Despite some
enormous blunders, Greenspan in particular continues to be held in high
regard because the most visible barometers of central banking performance
- long-term interest rates and the gold price - have kept signaling that
everything was under control.
It is important to emphasise that central
banks did not create the secular downtrend in interest rates, they
were beneficiaries of it. By 1979-1981 mass psychology and market
prices had swung so far in one direction that a prolonged move in the opposite
direction had become inevitable. Soaring market interest rates and gold
prices - the result of an almost total collapse in confidence in the US$
- forced Paul Volcker (the Fed chief at the time) to hike official interest
rates to extraordinary heights. This was sufficient to set the new trend
in motion.
Our contention is that by 1999-2001
mass psychology and the markets had once again reached an extreme and that
another major (secular) shift had become inevitable. This time around it
might have been Greenspan's extraordinary rate-cutting that provided
the final push that set the new trend in motion. The trends of the 1990s
cannot therefore be extrapolated into the 2000s. Bonds have peaked, gold
has bottomed, and confidence in central banks (primarily the Fed) is now
on the decline. Rather than covering-up central banking mistakes, the new
trend will exacerbate them. The central banks can attempt to sell-off their
remaining gold reserves, but beyond the very short-term the market won't
reward them for doing so. As was the case during the late-1970s, the selling
of gold will be seen as a sign of weakness and those currencies with the
greatest gold backing will start to command an investment premium.
Andy Smith talks about the gold price
being driven below $100/ounce by the massive selling of gold by central
banks, but central bank selling can never be a reason to be long-term
bearish on gold. Central bank selling appeared to be a millstone
around the gold market's neck during the 1990s because the bankers' desire
to limit the upside in the gold price was in tune with the primary trend
in the market. Attempts to limit the gold price will continue in the future
but they cannot be successful if we are correct that the primary trend
for interest rates has turned upward. A consequence of the new trend is
that each gold sale will weaken the currency of the country doing the selling.
Therefore, the more gold a country sells the higher the gold price will
eventually move in terms of that country's currency. It must be this way
because rational speculators and investors throughout the world will try
to position themselves in synch with the major trend and, thanks to decades
of inflation, they have vastly more dollars, euros, yen, etc. than the
central banks have gold.
Overview
From the latest Weekly Update: "...we
expect the biggest moves in several markets - stocks (down), gold (up)
and the Dollar (down) - to occur during the September-December timeframe.
However, the way the story is unfolding at the moment the biggest risk
to our forecasts is that these moves will happen earlier than previously
expected. As such, although counter-trend moves are likely in the short-term
we will probably not attempt to trade these counter-trends (at least, not
as far as our TSI commentaries are concerned). Rather, we will keep our
eyes firmly fixed on the big picture."
As each day goes by the odds improve
that we are going to see a major stock market low, gold price high and
dollar low earlier than originally expected. Based on a number of technical
indicators we should have seen counter-trend moves this week (higher for
the S&P500, higher for the Dollar and lower for gold), but these have
clearly not materialised. Gold has now closed higher in New York on 9 of
the past 10 trading days (an incredible run) so a pullback should still
be expected, but the current short-term trends appear to be very strong.
As such, the above-mentioned counter-trend moves will probably only last
2-3 days.
There were three main reasons why we
expected the biggest moves in the gold, stock and currency markets to occur
during the September-December period. Firstly, in order for the NASDAQ's
decline following its 10th March 2000 peak to roughly match the total length
of the Dow's decline following its 1929 peak and the Nikkei's decline following
its 1989 peak, it would have to bottom between October of 2002 and January
of 2003. Secondly, over the past 6 years major bottoms in the S&P500/XAU
ratio have regularly occurred during the September-October period. Thirdly,
the gold, stock and currency markets are clearly inter-related so we considered
it highly probable that an extreme in one market would coincide with extremes
in the other markets. When we put our analyses of the individual markets
together the October-December period stood out as being the most likely
time for an extreme in all three markets.
We can, however, use historical precedent
to make the case that the markets could reach extremes between late-June
and mid-August. The reason is that the first major low following a secular
peak has often occurred during this time window. Examples are:
a) The Dow bottomed in late-June/early-July
1932
b) Gold bottomed in late-June/early-July
1982
c) The Dow bottomed in early-August
1982
d) The Nikkei bottomed in mid-August
1992
The bottom line is that things are
getting very interesting and we could well see blow-off moves in stocks,
gold and the US$ during the next 10 weeks.
The US
Stock Market
Bull or Bear?
In previous commentaries we've shown
charts of the S&P600 Index (an index of small-cap stocks) and have
highlighted the broadening top formation that has developed over the past
2 years. Below is another look at this index.
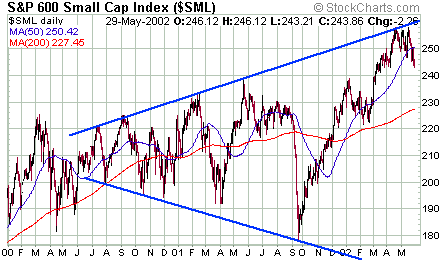
Small cap stocks have clearly been
in a bull market over the past 2 years with the S&P600 Index reaching
an all-time high as recently as last month. Mid-cap stocks, in general,
haven't been as strong as the small caps, but the S&P400 Mid Cap Index
also hit an all-time high last month. In other words, mid-cap stocks have
also been in a bull market.
Since we know that the senior stock
indices (the S&P500, the Dow Industrials and the NASDAQ100) have done
poorly over the past 2 years while small and mid cap stocks have been in
bull markets it is reasonable to assume that large-cap stocks must have
experienced a 2-year bear market. It might be reasonable to make such an
assumption, but the following chart shows that it wouldn't be entirely
correct to do so. The chart, provided courtesy of http://www.decisionpoint.com/,
compares the standard S&P500 Index (the S&P500 is a capitalisation-weighted
index) with the unweighted S&P500 Index (the same stocks but with every
stock given equal weight in the index). Notice that while the S&P500
peaked in March of 2000 the unweighted S&P500 peaked in May of 2001
and came close to matching that peak in March of this year. It would be
difficult to argue that the unweighted S&P500 has been in a bear market.
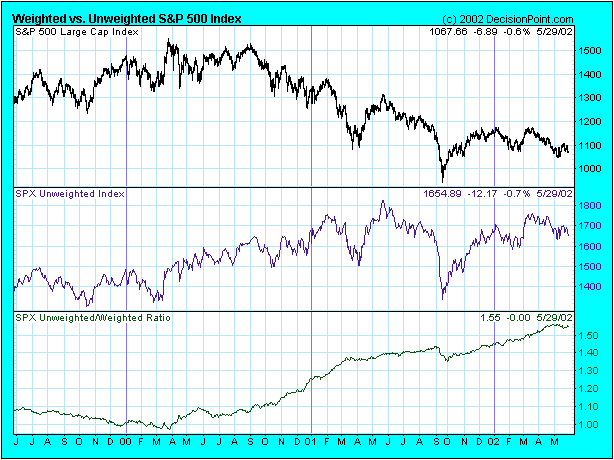
So, it appears that there has been
a vicious bear market concentrated within a relatively small number of
stocks while the vast majority of stocks have either moved higher or traded
sideways. This small group of stocks has, however, exerted enough influence
on the senior stock indices to cloud the issue as to whether or not the
overall stock market is in 'bear mode' or 'bull mode'.
Our view is that outside of the tech
and internet sectors, a bear market has not started...yet. What we have
most likely been witnessing over the past 2 years are the final throes
of the 1990s' bull market.
Current Market Situation
We came into this week expecting the
market to put together some sort of counter-trend rebound, but up until
now there has been no sign of any strength whatsoever. Put/call ratios
have been quite high, but option volumes have been very low. Rather than
indicating fear the high put/call ratios are therefore more an indication
of a lack of optimism.
We still think a counter-trend rebound
is likely over the next few days, but rather than taking the S&P500
into the 1110-1120 range as per our previous expectation we suspect that
any rally at this time will fail at, or below, the 50-day moving average
(currently at 1105). If a rally does materialise we would use it to good
effect by buying some more put options.
Gold and
the Dollar
Gold and currency trends
Earlier in today's commentary we talked
about the secular trend in interest rates and how this trend had influenced
the way that central banks were perceived. Long-term interest rates have
not yet broken out to the upside (the primary trend is still down), but
when we zoom in on the trends in the gold and currency markets over the
past 7 years we can see that important changes are underway. These changes
are consistent with our view on interest rates.
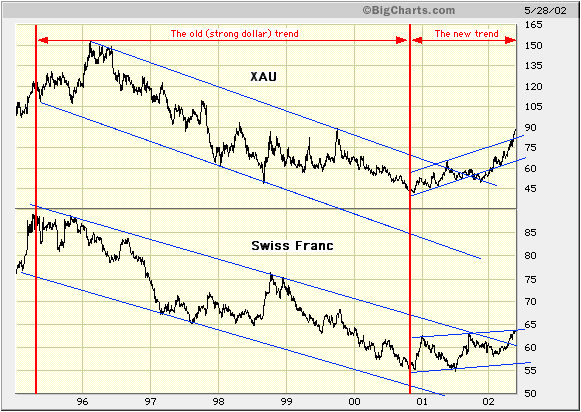
Below is a chart comparing the XAU
with the Swiss Franc since the beginning of 1995. The Dollar embarked on
a bull market in 1995 (indicated on this chart by the Swiss Franc's post-1995
downtrend) that ended during the final quarter of 2000. The SF has gradually
moved higher against the Dollar since October of 2000 and recently broke-out
from the downward-sloping channel in which it had traveled since 1995.
Not surprisingly, gold stocks (as represented by the XAU) trended strongly
lower with the SF during the 1995-2000 period and turned higher with the
SF during the final quarter of 2000.
The XAU's upside breakout from its
post-1995 downtrend has been far more decisive than the SF's breakout.
This is indicative, we think, of a growing distrust in all fiat
currencies and central banks (not just the US$ and the Fed).
Current Market Situation
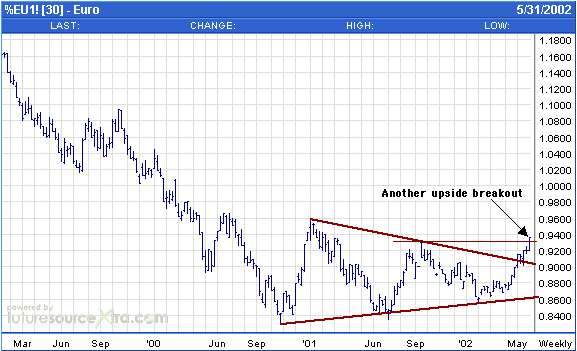
Below is a weekly chart of the euro.
Yesterday (Wednesday) the euro futures closed above last September's peak
and the Dollar Index futures closed below last September's bottom. Things
are starting to move quickly. A Dollar rebound over the next few days is
likely, but as noted under "Overview" it now looks as though the Dollar
is going to accelerate lower a few months earlier than originally anticipated.
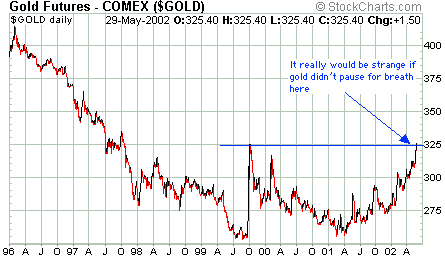
The gold price has hit major resistance
at $325. This resistance might be "major" but it is unlikely to contain
the gold price for long if the US$ keeps falling. Once through 325 there
is no significant resistance until we get to the 370-400 range, although
we doubt that the price will immediately move that high because a break
above 325 is likely to prompt some form of official intervention. Central
bank intervention won't have a prolonged negative effect on the gold price,
but the CBs certainly have enough clout to influence the market in the
short-term. This is particularly the case with speculators being heavily
net-long gold futures and sentiment towards gold being more bullish than
it has been in many years.
Update
on Stock Selections
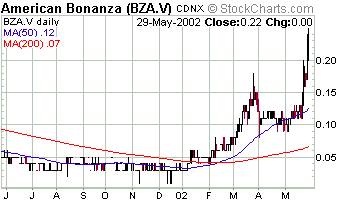
In Market Alert E-mail #85 we suggested
that anyone who felt under-exposed to gold could look at buying a small
Canadian gold stock called American Bonanza (CDNX: BZA). At the time of
our alert the stock was trading at C$0.18 (it closed at 0.22 yesterday).
Including the shares issued in a just-completed
private placement BZA has a market cap of around C$20M. Its main asset
is the Copperstone project in Arizona which contains a 1.2M ounce gold
resource. At BZA's current price investors are therefore paying about US$10/ounce
for this gold in the ground. From a technical perspective the stock could
pullback to 0.15-0.17, but there is certainly no assurance that it will
see those levels again.
Also in the above-mentioned e-mail
we suggested buying Apex Silver January-2003 $17.50 call options. We will
use Tuesday's average price of US$2.30 for record purposes.
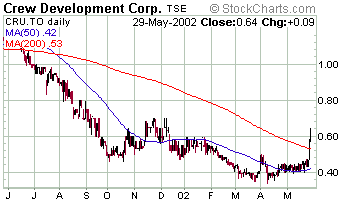
In Market Alert E-mail #86 we mentioned
that Crew Development Corp (CRU.TO) was another company worth buying near
its current price (C$0.55), although we said we would only add it to the
Portfolio if it traded down to C$0.53. CRU has moved above its 200-DMA
for the first time since last June and looks strong from both technical
and fundamental perspectives.

|
