|
- Interim Update 29th June 2005
Copyright
Reminder
The commentaries that appear at TSI
may not be distributed, in full or in part, without our written permission.
In particular, please note that the posting of extracts from TSI commentaries
at other web sites or providing links to TSI commentaries at other web
sites (for example, at discussion boards) without our written permission
is prohibited.
We reserve the right to immediately
terminate the subscription of any TSI subscriber who distributes the TSI
commentaries without our written permission.
Confidence Remains High
The cornerstone of our
outlook is that confidence is presently close to a peak and is set to
slide over the coming 1-2 years, resulting in a shift away from those
investments that are generally considered to be risky (relatively
speaking) or to be geared towards strong economic growth. If we are
right then the sorts of things we should begin to see over the next
several months are strength in gold relative to cyclical commodities,
strength in gold stocks relative to the stocks of industrial metal
producers, strength in US Government debt relative to the debt of
emerging market governments, widening credit spreads in general, and
weakening stock markets with those sectors that benefit the most from a
strengthening economy being the worst performers. These things should
become evident during the second half of this year, although they
probably won't become blatantly obvious until next year.
That's what we expect to happen, but at this stage there aren't many
cracks in the bullish veneer. For example and as illustrated by the
below chart, the NEM/PD ratio (the stock price of gold producer Newmont
Mining divided by the stock price of copper producer Phelps Dodge)
trends in the opposite direction to the US stock market; that is, NEM
out-performs PD when confidence in financial assets is falling and
under-performs when confidence is rising. With NEM/PD languishing near
a 2-year low it is clear that this particular indicator has not yet
signaled a trend change.
Now, we have not expected NEM to show significant relative strength
until the second half of this year so the fact that there hasn't yet
been a trend reversal in NEM/PD is not a reason for us to doubt the
validity of our intermediate-term view. The chart's message is simply
that confidence remains at an elevated level. This, by the way, is one
of the main reasons we don't think the recent rebound in the gold price
represents the early part of a major multi-year advance.
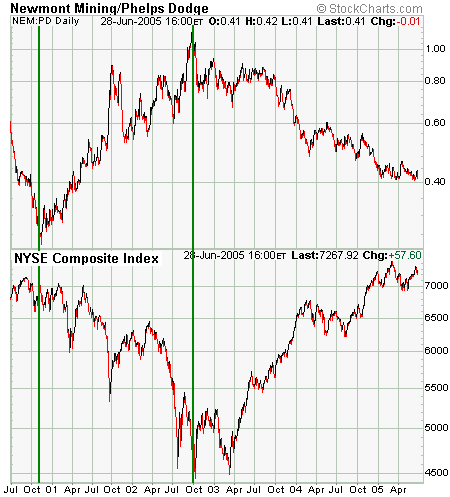
The above chart
illustrates how our views on a number of different markets are linked.
In particular, it shows that our expectations for strength to emerge in
gold and gold stocks relative to base metals and base metal stocks is
tied to our bearish intermediate-term view on the broad stock market.
In other words, if the stock market were to defy our expectations and
continue to trend higher over the coming 1-2 years then it is likely
that other markets would also move counter to our current expectations.
Specifically, it is likely that the NEM/PD ratio would continue to
trend lower, copper and oil would continue to do better than gold,
emerging markets would continue to benefit from large capital in-flows,
credit would remain readily available at cheap rates, and the
semiconductor stocks would be amongst the best performers in the market.
The consumer has NEVER been the primary engine of inflation
...the
idea that the Fed would be powerless to prevent deflation if consumers
were to cut back on their borrowing or, heaven forbid, if consumers
were to reduce their collective level of indebtedness, is absurd. This
is because the Fed's ability to monetise assets and debt is limited
only by the need to maintain some confidence in the currency.
Many of the arguments we've read in favour of an imminent deflationary
outcome hinge on the belief that US consumers are rapidly approaching
the point where they will be 'tapped out' (unable or unwilling to
borrow more money into existence), partly because household debt levels
are already so high and partly because the combination of rising
unemployment and falling/stagnant incomes will prompt people to become
more frugal. This, so the argument goes, will lead to a contraction in
the total quantity of money and credit (deflation).
The thing is, if you begin with an incorrect premise and then apply
perfect logic then you are guaranteed to arrive at an incorrect
conclusion. And when it comes to the inflation/deflation debate, the
premise that the consumer is the primary engine of inflation is
incorrect.
In the US there has been inflation and nothing but inflation since
official gold convertibility was eliminated in 1933. Through economic
expansions, economic contractions, periods of high unemployment,
periods of low unemployment, periods of high consumer
spending/borrowing, periods of low consumer spending/borrowing,
financial crises, war times, peace times, natural disasters and
man-made disasters, there has been inflation. The reason is that the
central bank, not the consumer, is the primary engine of inflation.
Of course, during normal times consumers do a lot of the heavy lifting
when it comes to inflating the money supply. Over the past few years,
for example, the single most important contributor to money-supply
growth has been mortgage financing/re-financing by US households, while
the Fed's direct contribution to the total supply of money has been
very small. This doesn't mean, though, that the Fed is incapable of
directly causing the money supply to expand; it simply means that it
hasn't yet become necessary for the Fed to boost the money supply
directly*.
As an aside, a few years ago the world was treated to a display of what
Greenspan and Co. are capable of doing when they set their minds to the
task of directly injecting money into the economy. Within the space of
a few days following the September-2001 terrorist attacks the Fed was
able to engineer a $170B increase in M2; not too shabby when you
consider that they had almost no time to plan this inflation.
In our opinion, the idea that the Fed would be powerless to prevent
deflation if consumers were to cut back on their borrowing or, heaven
forbid, if consumers were to reduce their collective level of
indebtedness, is absurd. This is because the Fed's ability to monetise
assets and debt is limited only by the need to maintain some confidence
in the currency. To be specific, the Fed will be able to inject as much
money as it wants into the economy as long as inflation fears aren't
spiraling out of control (as indicated by bond yields rocketing
skyward). Therefore, let's get to the point where INflation fears are
spiraling out of control before we start worrying about the possibility
of DEflation.
*Articles such as the one at http://www.gold-eagle.com/editorials_05/mchugh061905.html
paint an erroneous picture of the money-creation process. The fact is
that the Fed is not directly responsible for any of the growth in M3
since the beginning of this year. Rather, growth in private- and
public-sector indebtedness -- increased mortgage-related borrowing and
government deficit-spending, for instance -- have caused whatever
money-supply growth there has been. Furthermore, measures of money
supply often fluctuate quite wildly on a month-to-month basis so it
makes no sense at all to draw conclusions by annualising the most
recent figures. The fact is that the year-over-year growth rates of M2
and M3 are presently near 10-year lows.
The Relationship Between Bonds and Oil
...the
fact that oil has just made a new high suggests that the next pullback
in the bond market will be followed by a rally to a new high for the
year.
In the 25th May Interim Update we wrote:
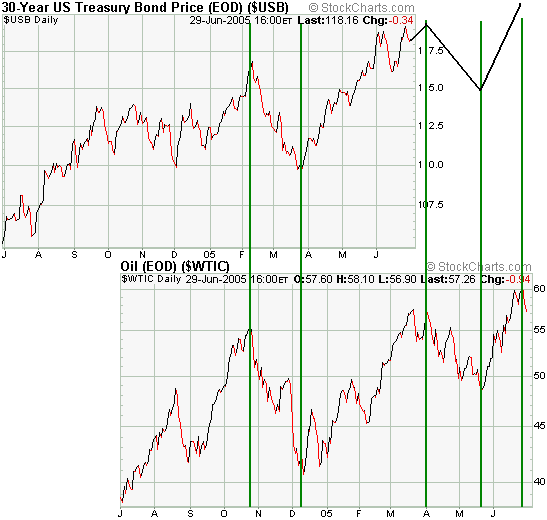
"Over the past 4 years there has been a consistent lead-lag relationship between the US bond market and the oil price...
...The relationship,
which is illustrated on the below chart comparison of the T-Bond price
and the oil price, can be described as follows: significant turning
points in the oil market lead equivalent turning points in the bond
market by 3-4 months.
This lead-lag
relationship between oil and bonds has predicted every important
turning point in bonds over the past 4 years with the exception of the
downward reversal in the bond market that occurred during the first
half of 2004. Furthermore, there have been no important turning points
in the oil market over the past 4 years that were not followed, 3-4
months later, by a similar turning point in the bond market.
If the relationship
continues to work then the bond market will remain surprisingly strong
until the first half of July, after which there will be a sizeable
correction. We have difficulty imagining bonds remaining elevated for
an additional 6 weeks or so, but perhaps another sharp decline in the
stock market will do the trick. In any case, the oil-bonds relationship
will become particularly interesting IF the oil price continues to
trend lower over the next couple of months and the bond price is still
near its highs as we head into July."
Since we wrote the above the oil price has moved to a new high, thus
altering the message of the bonds-oil relationship. As illustrated on
the below chart, the rather strange lead-lag relationship between bonds
and oil that has worked quite well over the past 4 years indicates that
a pullback in the bond market will probably commence by mid July.
However, the fact that oil has just made a new high suggests that the
next pullback in the bond market will be followed by a rally to a new
high for the year. It also suggests that October is the most likely
time for a bond market peak IF oil has either just peaked or reaches
its ultimate high within the next few weeks.
The US
Stock Market
Current Market Situation
In the latest Weekly Update we said the stock market appeared to have
unfinished business on the upside, but that we didn't have any idea
whether this upside would occur over the next few weeks or following a
sharp multi-week decline. Our views on other markets -- the likelihood
of some additional short-term strength in gold stocks, for example --
pointed towards additional short-term gains in the broad stock market,
but the weekly trend reversal in the NDX/Dow ratio that occurred in May
pointed towards one more sharp decline prior to the start of a tradable
rally.
Unfortunately, the market action over the past three days has done nothing to clarify the short-term outlook.
Although we don't have an opinion on what the market will do over the
next few weeks, we do have a pretty good idea on how we will react
under different conditions. We will, for instance, likely view a
breakout by the S&P500 to a new high for the year as an opportunity
to initiate or add to bearish positions while we will probably view a
plunge below 10,000 by the Dow Industrials as an opportunity to reduce
bearish positions (assuming, of course, that the new low for the Dow
was not confirmed by a new low for the NDX).
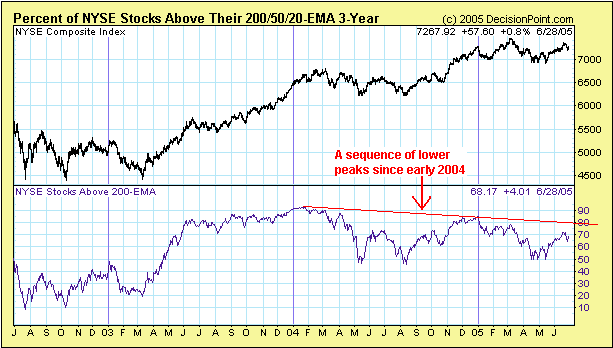
The below chart reveals a weakening in the US stock market's
'internals' over the past 18 months in that it shows a sequence of
lower lows in the percentage of NYSE stocks above their 200-day moving
averages. In other words, it shows that a smaller number of stocks have
participated in each successive rally since the beginning of last year.
The market's weakening internals don't give us any clues about what is
likely to happen over the next few months, but they are consistent with
our intermediate-term bearish view.
Gold and
the Dollar
Gold in A$ terms
...a
breakout above long-term resistance doesn't, in itself, tell you a lot
about what the price will do over the ensuing 12 months.
In an attempt to explain what might follow the recent upside breakout
in the euro gold price we showed, in the 20th June Weekly Update, three
examples of upside breakouts from long-term basing patterns. Two of
these breakouts (oil last year and US$ gold in 2002) were followed by
sharp multi-month rallies and then pullbacks to 'test' the breakouts,
while the third (the Yen gold price during 2003-2004) was followed by a
lengthy period of uneventful range trading.
The weekly chart of the Australian Dollar gold price shown below
provides us with a fourth example of performance following an upside
breakout from a long-term base. Notice that the 'major' upside breakout
in gold/A$ at the end of 2002 occurred very close to an
intermediate-term peak and that anyone who bought gold/A$ in response
to this breakout experienced a 20% draw-down over the ensuing 6 months.
Furthermore, gold/A$ is still about 10% below its late-2002 breakout
level.
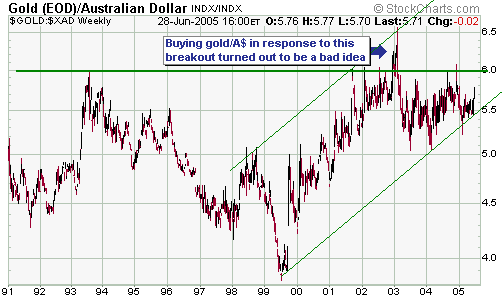
Our purpose in
showing the above example and the three examples in the 20th June
commentary is to make the point that a breakout above long-term
resistance doesn't, in itself, tell you a lot about what the price will
do over the ensuing 12 months. It is important to understand why gold
is destined to move considerably higher against all the fiat currencies
over the coming years, but the best way to use this understanding is to
buy following drops to support; not following breakouts above obvious
resistance.
By the way, we are very bullish on the A$ gold price and expect that it will be at a new high (above $650) within 12 months.
Gold Stocks
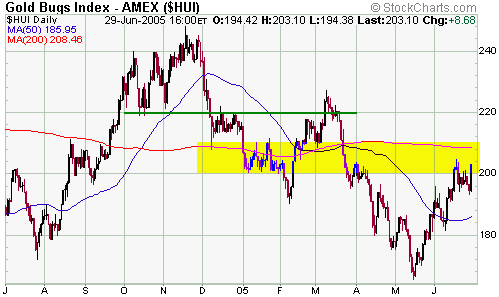
Gold stocks were very strong on Wednesday, both in absolute terms and
relative to the metal. The implication is that the AMEX Gold BUGS Index
(HUI), a daily chart of which is included below, will see additional
gains before a short-term peak is put in place. However, yesterday's
action doesn't really give us any information as far as how much higher
the price will go and how much longer the rally will last. For example,
a similar one-day surge occurred on the 8th of March -- the day prior
to an important peak and the start of a large 2-month decline.
Our guess is that the rally will continue for another 1-2 weeks with
the HUI moving up to near the top of the 200-210 resistance range, but
a lot will probably depend on what happens in the broad stock market.
Strength in the broad stock market over the next two weeks, for
instance, would be supportive of additional gains in the gold sector.
In the Weekly Update we'll review the main reason we remain intermediate-term bearish on the gold sector.
Current Market Situation
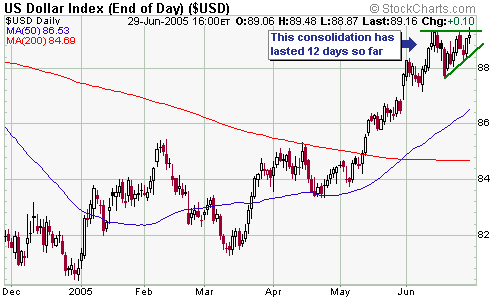
The below daily chart of the Dollar Index shows that the currency
market has been consolidating over the past 12 trading days. This chart
pattern, viewed in isolation, suggests that the dollar is preparing to
resume its advance. However, the bullish performances of gold and gold
stocks indicate that a pullback by the Dollar Index to near its 50-day
moving average -- in similar fashion to what happened in April -- might
be on the cards.
Further to the above, our short-term currency market view can be
summarised as follows: We remain confident that the Dollar Index will
trade up to the low-90s and that the euro will trade down to 1.18
within the next two months, but would allow for some additional
consolidation over the next two weeks.
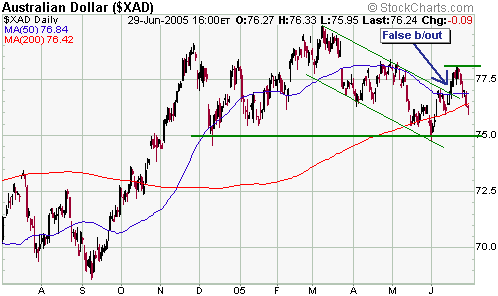
Below is a daily chart of the Australian Dollar.
The A$ broke above the top of a downward-sloping channel during the
first half of June, ushering in the possibility that it would test or
perhaps even marginally exceed its March high before resuming its
decline. However, this breakout now appears to have been a 'head fake'.
We are very bearish on the A$ as far as the coming 12 months are
concerned, but would be surprised if this currency became seriously
weak prior to serious weakness occurring in the stock and commodity
markets. In the mean time we suspect that it will remain between
support at 75 and its mid June rebound peak (just above 78).
Below is a daily
chart of August gold futures. The weakness during early trading on
Wednesday proved to be a successful test of the 18-day moving average
(the green line on the chart) and this, combined with Wednesday's
substantial strength in the major gold stocks, indicates that gold is
probably going to exceed last week's high in the near future. A move up
to the 455-465 range remains a distinct near-term possibility.
Update
on Stock Selections
 As
mentioned in the 20th June Weekly Update, we will add the Newmont
Mining January-2006 $35 put options to the TSI Stocks List if they
trade at US$0.90. In order for the options to drop down to this price
(they closed at $1.15 on Wednesday) NEM will probably have to move up
to around $41. As
mentioned in the 20th June Weekly Update, we will add the Newmont
Mining January-2006 $35 put options to the TSI Stocks List if they
trade at US$0.90. In order for the options to drop down to this price
(they closed at $1.15 on Wednesday) NEM will probably have to move up
to around $41.
Chart Sources
Charts appearing in today's commentary
are courtesy of:
http://stockcharts.com/index.html
http://www.futuresource.com/
http://www.decisionpoint.com/

|

