|
- Interim Update 29th June 2011
Copyright
Reminder
The commentaries that appear at TSI
may not be distributed, in full or in part, without our written permission.
In particular, please note that the posting of extracts from TSI commentaries
at other web sites or providing links to TSI commentaries at other web
sites (for example, at discussion boards) without our written permission
is prohibited.
We reserve the right to immediately
terminate the subscription of any TSI subscriber who distributes the TSI
commentaries without our written permission.
Bearish on China
In
TSI commentaries over the past couple of years we've devoted a fair
amount of space to China's economic negatives and almost no space to
China's economic positives. There are two reasons for this. First, the
negatives outweigh the positives by a wide margin. Second, many of the
financial commentators who have been able to correctly identify and
diagnose the flaws in the US economy have been strangely unable to
apply the same logic to China. This is especially so for the ones who
believe the "commodity supercycle" story. We therefore feel duty-bound
to balance the commentary that consistently turns a blind eye to the
major economic problems brewing in China.
Our view is that China is now in the late stages of one of the world's
greatest-ever credit-fueled booms -- a boom that will inevitably be
followed by one of the greatest-ever busts. Given the extraordinary
degree of control that China's central government has over the
country's banking system and the dominant role that government-directed
investment plays in the economy, it's possible that China's boom will
linger for another year or even longer. As per the nature of bubbles,
it has already gone on for longer than most rational observers would
have expected. But while this may be a good a reason not to 'short' the
China growth story, it isn't a good reason to bet on its continuation.
A recent piece at Washington's Blog
does a reasonable job of covering China's economic negatives. For
example, it touches on the country's credit bubble -- the most obvious
symptom of which is the real estate construction boom -- and mentions a
few other reasons to be bearish, including:
1. Corruption and phony bookkeeping are rife in China at the corporate
and government levels. At the corporate level, the types of fraudulent
activities that have been uncovered at some US-listed Chinese companies
are apparently commonplace within China. At the government level,
China's central bank has admitted that from the mid-1990s through to
2008 thousands of Chinese officials stole a combined total of around
$120B (http://www.bbc.co.uk/news/world-asia-pacific-13813688) and then
fled the country. Also at the government level, the bogus economic
statistics put out by US officialdom look plausible in comparison with
the economic statistics reported by the government of China.
2. As is the case in the US and Europe, insolvent Chinese banks are
being propped up by central bank support. This support ultimately comes
at the expense of the rest of the economy.
3. Local governments throughout China have borrowed and spent
aggressively to create the illusion of real growth. Consequently, many
provinces are now in financial trouble and some are likely in worse
shape than Greece. Unfortunately, they will be bailed out by the
central government -- at the likely cost of a bigger inflation problem.
The above-linked blog discussion also cites a lack of growth in
consumer spending as a reason to be concerned about China's economic
prospects, but on this we disagree. Increased consumer spending is an
effect of economic growth, not a cause of it. China doesn't need more
consumer spending; it needs investment guided by legitimate price
signals (price signals that are undistorted by inflation and government
intervention).
Lastly, the article linked HERE,
which was published back in March of last year, contains Edward
Chancellor's list of the ten main characteristics of the speculative
manias that lead to financial crises. All of these ten characteristics
apply to China today. This doesn't mean that a China financial crisis
is imminent. After all, these characteristics have applied since early
2007. It does, however, suggest that a crisis is inevitable.
The Stock Market
At
the end of last week we were anticipating a rebound in the senior US
stock indices to near their 50-day moving averages, but were allowing
for the possibility that they would spike slightly below their recent
lows before embarking on such rebounds. The rebounds have since begun,
with no preceding spikes to new lows.
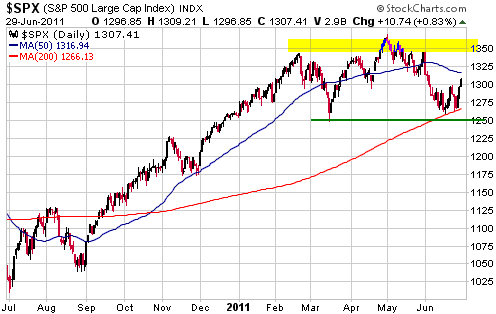
The following daily chart shows that the S&P500 Index is already
quite close to its 50-day moving average. Note, though, that this
moving average constitutes a reasonable MINIMUM target for a
counter-trend rebound. It doesn't represent the market's upside
potential.
It is not uncommon for intermediate-term and major peaks in the US
stock market to be fully tested prior to substantial declines getting
underway. For example, the October-2007 peak in the S&P500 Index
was actually a test of the July-2007 peak. Therefore, even if we are
right to assume that a peak of at least intermediate-term importance
was put in place at the beginning of May this year, it would not be out
of the ordinary for the market to move back to the vicinity of this
peak within the next several weeks.
We aren't forecasting a return to the May peak; we are simply pointing
out that there is a realistic possibility of it happening. It was in
recognition of this possibility that we upgraded our short-term stock
market outlook from "bearish" to "neutral" about two weeks ago.
Gold and
the Dollar
Gold, Silver and Platinum
The US$ gold price broke below support late last week, which opened up
the possibility that it would decline fast enough to reach its 200-day
moving average (in the low-$1400s) within the ensuing three weeks. On
the other side of the coin, there were positive divergences late last
week in the form of resilience in the gold-stock indices and the
silver/gold ratio. At this stage it looks like the positive divergences
were significant.
As far as the next few weeks are concerned, gold's downside potential
is probably limited by support in the $1460s and its upside potential
is probably limited by resistance at $1530-$1550.
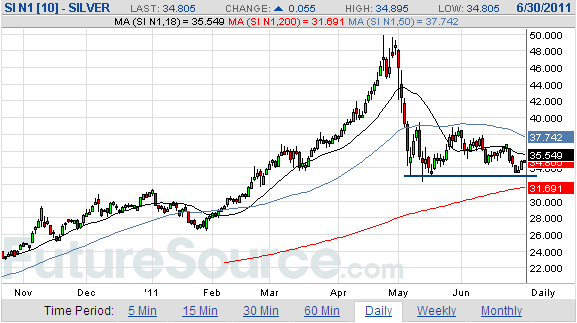
Silver began this week in a precarious position -- about $1 above
important support defined by its May low. It tested this support on
Monday and has since rebounded.
It isn't a fluke that this week's rebound in the silver market from
just above important support coincided with a rebound in the stock
market from just above an equally important support level. The silver
market is generally helped by stock market strength and hurt by stock
market weakness, which means that the most dangerous time for the
silver market will be when the stock market begins to trend downward in
earnest. This is the most likely time for the next leg down in silver's
intermediate-term correction.
Silver was still in a precarious position at the close of trading on
Wednesday, but with the stock market now showing signs of having
commenced a multi-week rebound the odds are in favour of silver
remaining in consolidation mode (the mode it has been in since the
early-May short-term bottom) for at least a few more weeks.
If support at $33 holds for now (the most likely outcome) then the
silver price will probably make its way back to near the top of its
$33-$39 consolidation range. However, a daily close below $33 would
suggest that the nearest silver futures contract was on its way to the
high-$20s.
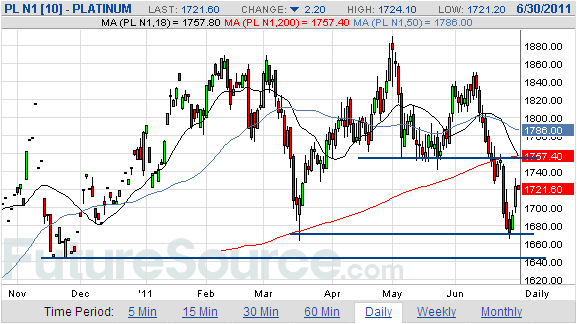
Over the past 14
months platinum has been by far the weakest of the three main precious
metals. Consequently, it could prove useful as an early warning
indicator over the months ahead.
The following daily chart shows that platinum has just begun to rebound
after testing support defined by its March low. A daily close below
this week's low would breach this support and warn of impending
short-term trouble in the gold and silver markets, but as long as
platinum is managing to hold above support we probably won't get
anything more than routine downward fluctuations in the gold and silver
markets.
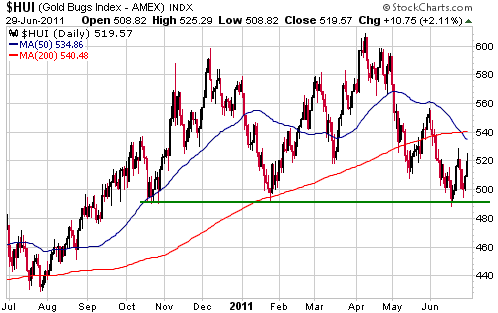
Gold Stocks
Gold bullion's decisive break below a confluence of support during the
final two days of the week failed to push the HUI to a new low for the
move. This prompted us to state, in the latest Weekly Update, that the
HUI appeared to be almost 'sold out' on a short-term basis.
As this trading week got underway it wasn't out of the question that
the HUI would soon break below support at 490, but it would probably
have taken significant additional weakness in the broad stock market
and the precious metals markets to make it happen. With the broad stock
market having just reversed upward and with silver having survived a
test of its May low, the odds have shifted decidedly in favour of a
gold-sector rebound over the coming weeks.
A normal counter-trend rebound would at least take the HUI up to around
540, at which point it would be near its 200-day moving average and
would have retraced about half of its preceding decline. At most, a
counter-trend rebound would take the HUI up to 580-600.
Currency Market Update
We are tired of seeing the "kicking the can down the road" metaphor
used to describe what Europe's political and monetary leadership are
doing to avoid a sovereign debt default, so let's simply say that
Europe continues to postpone the inevitable. Greece's politicians have
just done their part by voting in favour of an "austerity" program,
thus paving the way for the creation of more debt that will never be
paid off.
Stock markets breathed a collective sigh of relief once it became clear
that the Greek government was going to get another injection of credit,
and when the stock markets of the world rise the US$ usually falls. The
currency market action over the first three days of this week was
therefore normal, given what was happening in other markets.
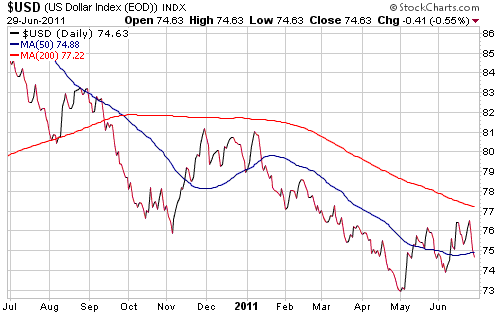
Interestingly, this week's sharp pullback in the Dollar Index is
consistent with the April-July 2008 bottoming pattern (refer to the
chart in the 27th June Weekly Update for details).
Update
on Stock Selections
(Notes: 1) To review the complete list of current TSI stock selections, logon at http://www.speculative-investor.com/new/market_logon.asp
and then click on "Stock Selections" in the menu. When at the Stock
Selections page, click on a stock's symbol to bring-up an archive of
our comments on the stock in question. 2) The Small Stock Watch List is
located at http://www.speculative-investor.com/new/smallstockwatch.html)
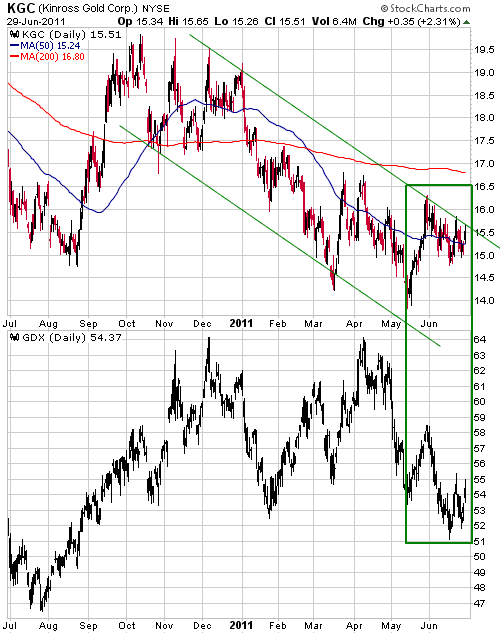
 Kinross Gold (NYSE: KGC, TSX: K) Kinross Gold (NYSE: KGC, TSX: K)
The following chart comparison of KGC and GDX shows that KGC was very
weak relative to the average senior gold stock (as represented by GDX)
between October of last year and early-May of this year, but that KGC
has been relatively strong since the second week of May. Of particular
note: whereas GDX dropped to a new for the year during the first half
of June, KGC did no worse during June than retrace about half of its
May rebound.
We aren't interested in owning KGC shares. However, with the stock at a
very depressed level on an intermediate-term basis and showing signs of
strength on a short-term basis, we think the time is ripe to take an
initial position, or average down on an existing position, in the
Kinross D-Series warrants (TSX: K.WT.D). The warrants have an exercise
price of US$21.30, an expiry date of September-2014, and a current
price (at Wednesday's close) of C$2.35.
Be aware that the market for these warrants is quite illiquid, which
means that they can usually only be traded in small parcels.
Clifton Star Resources (TSXV: CFO). Shares: 36M issued, 40M fully diluted. Recent price: C$2.50
In the process of outlining a rough valuation for CFO in the 20th June Weekly Update, we wrote:
"A 7M-oz resource in
Quebec would typically be valued by the market at more than $100/oz,
but due to the deposit's complexity we will assume that it attracts a
valuation of only $50/oz."
A Mineweb.com article posted on 29th June provides some information on the "deposit's complexity". We are referring, in particular, to the following excerpts:
"It's clear that while
Duparquet has an open pit component to it, the underground aspect will
increasingly become an important focus for Clifton. Miller says that
Clifton will be looking to deep holes targeting depths in the 1,000
metre range in coming phases of drilling."
And:
"Miller speculates there
could be four to five open pits on top of underground operations,
though whether underground and open-pit operations would proceed
simultaneously is a question for engineers to decide in coming studies."
Last year's drilling eliminated the possibility that CFO's Duparquet
project would eventually be developed into a single large,
straightforward open-pit mining operation. This, we suspect, is why
Osisko chose not to continue spending money on the project at the rapid
rate it was required to spend money to earn a 50% stake.
The above-linked article also quotes a mining analyst who has an
$11.00/share price target for CFO. In our 20th June commentary, we
arrived at a valuation range of $6.70 (moderately pessimistic) to
$12.20 (moderately optimistic).
Resolute Mining (ASX: RSG). Shares: 599M issued (incl 151.7M A$0.50 conv. notes), 659M fully diluted. Recent price: A$1.17
Early this week RSG's management issued its production guidance for the
12-month period beginning 1st July 2011. The forecast is for gold
production of 410K ounces at a "cash cost" of $730/ounce. This
represents substantial production growth, primarily due to the ramp up
of the Syama project in Mali.
The above-mentioned production forecast contains significant execution
risk, but in the absence of a major accident or natural disaster we
expect that the forecast will be achieved. The reason is that RSG has
been operating Syama for long enough now to have a good handle on what
the mine is capable of.
Our intermediate-term target for RSG is A$2.00-A$2.50. This target
range is based on RSG generating cash of $160M-$200M over the next 12
months and getting valued by the market at around 8 times cash flow.
Also, it assumes a gold price of US$1400-$1500/oz.
Chart-wise, the stock has resistance at A$1.20 and support at around A$1.00.
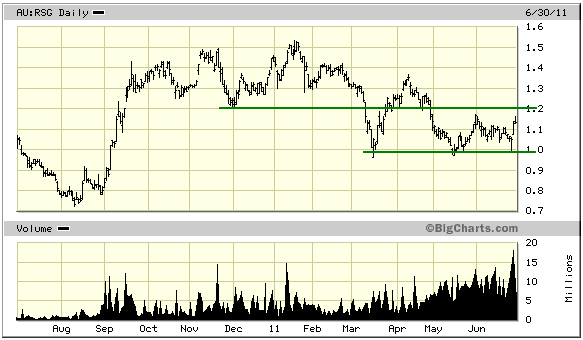
We consider RSG to be a good candidate for new buying below A$1.20 and a strong buy in the low-A$1.00 area.
For speculators looking for more 'bang for the buck', the RSG company
options (ASX: RSGO) could also be of interest while the stock is
trading below A$1.20. The options have an exercise price of A$0.60,
expire at the end of this year, and usually trade very close to their
intrinsic value (the intrinsic value of a stock option is the market
price of the underlying stock minus the exercise price of the option if
the option is 'in the money', or zero if the option is 'out of the
money').
Chart Sources
Charts appearing in today's commentary
are courtesy of:
http://stockcharts.com/index.html
http://www.futuresource.com/

|