![]()
![]()
![]()
![]()
- Interim Update 29th July 2020
Copyright
Reminder
The commentaries that appear at TSI
may not be distributed, in full or in part, without our written permission.
In particular, please note that the posting of extracts from TSI commentaries
at other web sites or providing links to TSI commentaries at other web
sites (for example, at discussion boards) without our written permission
is prohibited.
We reserve the right to immediately
terminate the subscription of any TSI subscriber who distributes the TSI
commentaries without our written permission.
12-Month Forecast,
updated 29th July 2020
We published a 12-month forecast
on 20th January, 2020. Due to government decisions to lock down large
parts of many economies in response to a flu virus, this forecast was
overwhelmed by events over the ensuing two months. We therefore did a
forecast update on 15th April, but at that time there were too many
unknowns to be specific.
Probably the most important part of our
January-2020 forecast was our outlook for "inflation", the reason being
that most of our market views hinged off our "inflation" view. In January
we wrote that the next 12 months would involve a substantial (by the
standards of the past 10 years) increase in what most people think of as
"inflation". In April we didn't change our "inflation" forecast, but an
adjustment was appropriate.
We explained the adjustment using a
metaphor. We wrote: "Originally, we were going to take a flight from
Singapore to northern California. Now, we will be flying from Singapore to
Alaska, but we will be getting there via New Zealand." In other
words, there was going to be even more "inflation" than originally
envisaged -- after a big move in the opposite direction.
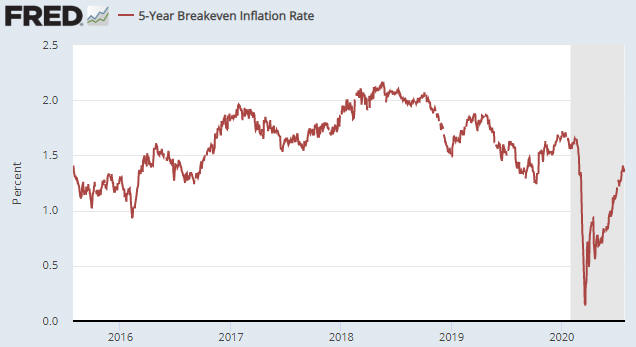
By way of
additional explanation, here is a chart that shows the "5 year breakeven
inflation rate". In effect, this chart shows the expected (by the market)
yearly rate of CPI growth over the next few years. This year started at
around 1.7%, after which there was a plunge to around 0.2% and then an
upward move to around 1.4%. We think that the post-March-2020 upward trend
is destined to continue over at least the next 12 months.
Our reason for expecting much higher "price inflation" was/is not only
the tremendous size of the monetary response to the economic damage caused
by the lockdowns, but also the way the new money was/is being distributed.
Of particular relevance, unlike the previous bouts of Quantitative Easing
that were totally focused on pumping money into the financial markets,
this time around a lot of new money has been and will continue to be
provided directly to businesses and individuals. This should ensure that
the 'problematic' inflationary effects (the effects on the prices of
everyday goods and services, as opposed to the prices of assets) of the
2020 money pumping will be much greater.
In the April update we
summed up our adjusted "inflation" outlook by writing: "...the stage
is being set for a veritable tidal wave of new money to meet a reduced
supply of goods and services. This WON'T result in hyperinflation in the
US or other developed economies in the foreseeable future (say, the next
two years), but it very likely will result in much higher levels of "price
inflation" within 12 months of the passing of the immediate COVID-19
crisis."
We don't have to make another adjustment, but it is
now possible to be more specific. The immediate COVID-19 crisis ended in
May-June, so our expectation is that the US (many other countries too, but
the problem will be bigger in the US due to that country's
disproportionately-large increase in government spending) will be
experiencing the highest rate of "price inflation" in more than 10 years
by Q2-2021.
The idea of a Q1-2020 detour followed by a steeper move
in the direction originally envisaged applies almost across the board to
the markets we track. For example, in January we forecast that the Dollar
Index (DX) would trend downward over the ensuing 12 months as the US stock
market became a relative laggard and as 'capital' shifted towards the
economies that provided the most leverage to commodity production, and
that the Australian dollar (A$) would be the strongest of the major
currencies. The "coronacrisis" prompted a scramble for US dollars during
the first half of March that led to a rapid rise in the DX and a crash in
the A$, but since the third week of March the DX has trended downward and
the A$ has been the world's strongest major currency by a wide margin.
For another example, in January we wrote that the monetary inflation
rebound promoted by central banks would boost the prices of industrial
commodities such as oil and copper to a far greater extent than it boosted
economic growth and overall corporate profitability. This is starting to
become evident. It's likely that oil and the stocks of oil producers will
perform worse over the course of 2020 than we expected in January, but
industrial metals and the associated equities look set to do as well as
originally expected. Furthermore, oil should return to its January-2020
high (near $60) or higher by the second quarter of next year.
Regarding the US stock market, in January we wrote:
"The
long-term US equity bull market won't end in 2020, but the January-2020
high for the S&P500 Index (SPX) will be close to its high for the year.
More specifically, we expect a sizable correction from a January high
followed by a rally that makes only a marginal new high (at best) before
the next sizable correction gets underway. In this regard, 2020 will have
a lot more in common with 2018 than with 2017 or 2019."
We
ended up getting a crash rather than just a "sizable correction", but the
SPX actually has followed the expected pattern and probably will continue
to do so. However, it's certainly possible that for all intents and
purposes the long-term equity bull market ended in the first quarter of
this year.
We say "for all intents and purposes" because we think
that the SPX will exceed its early-2020 all-time high during the first
half of next year if not sooner, but that the new high will be solely the
result of US$ depreciation. In other words, it looks like the US stock
market's 'real' bull market top is behind us.
Regarding the US
economy, although coming into this year the message from our favourite
leading indicators was that a recession would begin during the first half
of 2020, we guessed in January that there would be sufficient monetary
inflation to postpone the start of a recession until 2021. The lockdowns
invalidated this guess.
Both the monetary and fiscal responses to
the lockdown-related economic collapse should ensure that there won't be
anything like a complete recovery from the H1-2020 recession for many
years. As explained over the past couple of months, we are expecting the
economic rebound that got underway during May-June of this year to peak
during the first half of next year at well below the January-2020 level
and for the US economy to be back in official recession territory by the
first half of 2022.
Regarding the bond market, in January of this
year we thought that yields would move higher during 2020, but not
substantially so, and that the US yield curve would steepen. The US yield
curve has steepened significantly since early this year, but thanks to the
economic lockdowns the US T-Bond yield made a new all-time low in
March-2020 and has since chopped around near its low. We expect that bond
yields will rise over the coming 12 months and that the yield curve will
continue its steepening trend, but that the magnitudes of both moves will
be less than they 'should' be due the actions of the Fed.
In
general, we expect the price trends that were set in motion between
mid-March and mid-April of this year to continue until at least the second
quarter of next year. This means that with regard to the next 9-12 months
we are looking for continued weakness in the US$ and strength in the
commodity currencies, across-the-board strength in commodity prices,
strength in gold in US$ terms but not in terms of industrial metals or the
S&P Spot Commodity Index (GNX), strength in non-US equities relative to US
equities, and strength in the gold mining sector of the stock market.
As always there will be corrections along the way, with the period
between now and the early-November US election being a likely time-window
for significant countertrend moves.
Commodities
Oil is about to break
out
For the past 1.5 months the oil price has oscillated
between its 20-day MA and long-term lateral resistance at $42. In mid-June
the gap between these support/resistance levels was about $7, but because
the 20-day MA is rising the gap is now only $1.15. This almost guarantees
that there will be a breakout in one direction or the other within the
next week or so.
Due to the low volatility and the fundamental
backdrop, the more likely direction of the breakout is to the upside.
Uranium takes a hit
There were sizable
declines in most uranium-related stocks on Wednesday 29th July, led by a
12% plunge in the stock price of Cameco (CCJ). As evidenced by the
following daily chart, CCJ fell far enough to negate its recent break
above resistance at US$11.00.
The main reason for the weakness was the decision of Cameco management
to put the Cigar Lake mine (the world's highest-grade uranium mine) back
into production in September-2020. Cigar Lake produced 18M pounds of U3O8
in 2019 and was placed on "care and maintenance" in March-2020 in response
to the low uranium price and the 'coronacrisis' lockdowns.
The
decision to restart the Cigar Lake operation is significant because the
potential for a cyclical bull market in uranium is based on the
combination of reduced supply and stable demand. Our view, and likely the
view of many other speculators/investors, was that Cigar Lake would remain
off-line until after the per-pound uranium price made a sustained move
into the US$40s. The fact that it is being restarted with the per-pound
uranium price in the low-$30s is therefore a surprise.
CCJ's
management knows the supply-demand situation in the uranium market better
than anyone, so it is possible that global supply has tightened to the
point where Cigar Lake can be put back into production without derailing
the upward trend in the uranium price. Also, it is not 100% certain that
Cigar Lake will reopen in September as currently planned, because
virus-related restrictions or a drop in the uranium price to below $30
could prompt another re-think. However, we have decided to retreat to the
sidelines while waiting to see whether the Cigar Lake restart proceeds
and, if so, what effect it has on the market.
Further to the
above, we are going to remove from the TSI List the Uranium Participation
Fund (U.TO) trading position that was added in March and the Energy Fuels
(UUUU) trading position that was added only three weeks ago. The result of
the first trade is a profit of about 50% and the result of the second
trade is a profit of about 7%. This means that the sole remaining uranium
speculation in the TSI List is a CCJ call option expiring in January-2021.
The Stock Market
Over the past couple of weeks we
have discussed the huge disparities between the performances of different
US stock indices. In particular, we have pointed out that at the same time
as the NDX was showing signs of entering correction mode, other indices
were showing signs of exiting correction mode.
Nothing changed over
the first three days of this week. The NDX is still showing signs of
having entered correction mode more than two weeks ago, while the Dow
Transportation Average (TRAN), one of this year's biggest laggards,
appears to be on its way to a 5-month high. Here are the relevant daily
charts.
The performance disparities between different parts of the market
suggested that there was a plausible bullish alternative to a sizable,
market-wide short-term correction. This bullish alternative would involve
a rotation from the stocks/sectors that have been relatively strong to
those that have been relatively weak, leaving the SPX in the 3100-3300
range.
Given that the bullish alternative to a sizable market-wide
correction is not particularly bullish for the SPX, we have stated that
the SPX's short-term risk/reward is bearish. As mentioned above, nothing
changed over the first three days of this week.
Gold and the Dollar
Gold
The
US$ gold price has moved above its 2011 high into new all-time high
territory. Unlike the silver market the gold market has not experienced a
major upside blow-off, but the gold price has risen for 9 days in a row
and is working on its 8th consecutive weekly rise. This implies that on a
short-term basis it is stretched to the upside and probably about to
commence at least a 1-2 week correction.
Silver
In the latest Weekly Update, we wrote:
"We expect that silver's next multi-month top will be in place
before the end of this week."
And:
"...the tops
that follow rapid rises in the silver price usually are signalled by
either a large single-day price decline or a dramatic intra-day price
reversal. We didn't get either of these signals late last week, so the
blow-off to the upside could continue this week."
The blow-off
to the upside did continue this week, with the price rocketing up from
last week's close of $22.85 to an intra-day high of $26.27 on Tuesday 28th
July.
We suspect that Tuesday's spectacular price action marked a
multi-month top for silver. The reversal from Tuesday's intra-day high
wasn't quite as definitive as we'd like, but the extraordinary volatility
indicated by the almost-20% daily price range suggests that a mini mania
ended on that day.
Even if the 28th July intra-day high ($26.27)
turns out to be important, we won't be surprised if the high is tested
within the next month or so. For example, due to silver's tendency to lag
gold at important price bottoms and lead gold at important price tops, one
plausible short-term scenario involves a 1-3 week correction followed by a
rally that results in a new high for the gold price and a lower high (for
the year) for the silver price.
Gold Stocks
The gold sector still appears to be headed for a multi-month top
between early-August and early-September in line with a yearly cycle
established over the past five years. Some corrective activity over the
coming fortnight probably would have the effect of extending the upward
trend into early-September, but if the HUI were to make a new high for the
year next week then the odds would shift in favour of an August top.
The Currency Market
The Dollar Index (DX)
extended its relentless short-term decline over the first three days of
this week and has reached a 2-year low.
If the DX ends this week below its March-2020 low of 94.5 there will
be little remaining room for doubt that the US$ has commenced a cyclical
bearish trend. At the same time, the DX is now almost as 'oversold' on a
short-term basis as it ever gets.
Due to the extent to which the
DX's short-term trend is stretched to the downside, a significant rebound
lasting at least a few weeks should begin in the near future regardless of
whether or not we get conclusive evidence of a US$ bear market at the end
of this week. We will consider rebound targets for the DX after a reversal
is signalled.
Updates on Stock Selections
Notes: 1) To review the complete list of current TSI stock selections, logon at
http://www.speculative-investor.com/new/market_logon.asp
and then click on "Stock Selections" in the menu. When at the Stock
Selections page, click on a stock's symbol to bring-up an archive of
our comments on the stock in question. 2) The Small Stock Watch List is
located at http://www.speculative-investor.com/new/smallstockwatch.html
![]() The
Alkane (ALK.AX) spin-off starts trading
The
Alkane (ALK.AX) spin-off starts trading
Australian
Strategic Materials (ASM) commenced trading on the ASX today and averaged
A$1.35-$1.40 over the course of the day, giving us an extreme example of
stock market inefficiency.
To explain, ALK's stock price was
unchanged on the day (21st July) that it began trading 'ex' the ASM
spin-off. This means that someone could have bought ALK shares on 20th
July, sold the shares the next day and received ASM shares for free. Each
eligible ALK shareholder received one ASM share for every five ALK shares
held on 20th July and ALK ended the 20th July trading session at A$1.22,
so on 21st July ALK effectively went 'ex' a 0.28/share, or 23%, capital
return with no change in price. According to the proponents of the
efficient market hypothesis, this should not be possible.
The Dubbo
Specialty Metals Project owned by ASM is complex and difficult to value,
mainly because it is designed to serve commodity markets where supply,
demand and pricing are opaque. For example, the markets for zirconium,
hafnium and rare earth elements. We previously came up with a very rough
valuation of A$0.70 per ALK share ($3.50 per ASM share), but thought that
the stock market was valuing the project at only A$0.20 per ALK share
($1.00 per ASM share). At its closing price of A$1.40 in Australian
trading earlier today (30th July) there appears to be plenty of upside
potential, but due to the complexity of the project we have decided not to
follow the stock at TSI. However, in our own account we will hold the ASM
shares received in the recent spin-off, at least for a while.
The
current price of ASM suggests that ALK shareholders who weren't eligible
to receive ASM shares in the spin-off will instead receive a cash payment
of around A$0.28 per ALK share held on 20th July. Based on this
distribution amount, the gain on ALK from the time it was added to the TSI
List in 2016 to the time it was removed last week was around 600%.
 New TSI stock selection: Arafura Resources (ASX: ARU). Shares:
1168M. Recent price: A$0.067
New TSI stock selection: Arafura Resources (ASX: ARU). Shares:
1168M. Recent price: A$0.067
ARU has been a member of the
TSI Small Stocks Watch List for more than two years. Over this period the
stock's liquidity has improved and the company has made significant
progress on the ground, but the market cap remains very low. It is still a
rank speculation, but the risk/reward is very attractive and it offers a
reasonable way to obtain exposure to Rare Earth Elements (REEs).
Therefore, we are adding it to the TSI List as a trading position with an
expected duration of about 12 months.
ARU is focused on the
fully-permitted Nolans REE project in the Northern Territory (NT). A
Feasibility Study for the project was completed in February-2019 and an
update to this study is underway. In addition to completing this update,
the company is engaged in Front End Engineering and Design (FEED) work and
offtake/financing negotiations. It is adequately funded, with no debt and
about A$22M of cash at the moment.
About 80% (by revenue) of the
forecast Nolans production will be neodymium-praseodymium (NdPr), a
critical raw material in the manufacture of the high-performance permanent
magnets used in the electric components of cars. An average ICE (internal
combustion engine) car uses about 0.7 kg of NdPr, whereas an average
electric or hybrid car uses about 1.7 kg of NdPr. Therefore, ARU is a play
on the shift to an all-EV (Electric Vehicle) world.
According to
the February-2019 FS, it will cost about A$1B to develop Nolans into a
mine with average annual production of 4,357 tonnes of NdPr over 23 years.
At "base case" NdPr pricing (US$47/kg in 2020 up to US$90/kg in 2030) the
after-tax NPV(10%) and IRR are estimated to be A$729M and 17.4%,
respectively.
At base-case prices the economics are OK, but not
great. However, with every US$5/kg increase in the NdPr price the
estimated NPV increases by A$130M, meaning that the economics of the
Nolans project will improve rapidly if a new NdPr bull market gets
underway.
However, there are no signs that a new NdPr bull market
is underway. On the contrary, the NdPr price hit a 10-year low of around
US$37/kg in March of this year and has rebounded to around US$44/kg.
The Nolans project probably isn't economic at current commodity
prices, but that is why ARU's market cap and enterprise value are only
A$78M and A$56M, respectively. If the NdPr price rises to the point where
the Nolans project is economically robust, ARU will be worth a multiple of
its current market cap.
ARU is far too small to raise the money
needed to put Nolans into production. Ideally, it will do a JV deal with a
much larger company.
At the moment ARU should be viewed as a
long-term call option on the NdPr price. The risk is high, but the
potential reward is huge.
Chart Sources
Charts appearing in today's commentary
are courtesy of:
https://stockcharts.com/
http://bigcharts.marketwatch.com/
https://research.stlouisfed.org/
![]()