|
- Interim Update 29th September 2010
Copyright
Reminder
The commentaries that appear at TSI
may not be distributed, in full or in part, without our written permission.
In particular, please note that the posting of extracts from TSI commentaries
at other web sites or providing links to TSI commentaries at other web
sites (for example, at discussion boards) without our written permission
is prohibited.
We reserve the right to immediately
terminate the subscription of any TSI subscriber who distributes the TSI
commentaries without our written permission.
We have switched email services
Up
until this week we were using "Yahoo Groups" to broadcast emails to
subscribers, but we have now switched to a new mail delivery service.
Aside from a slight change in email format, subscribers shouldn't
notice any difference as a result of this change. Of particular note,
the sender's email address for TSI email notifications will still be
shown as sas888_hk@yahoo.com.
To minimise the chance of our messages getting blocked by Spam filters,
please put sas888_hk@yahoo.com into your email account's address book
or "safe list".
That's right, there is no "money multiplier". And it's just as well!
This week's issue of John Mauldin's "Outside the Box" letter
refers to a recent paper by a couple of Federal Reserve economists that
questions whether the fabled "money multiplier" actually exists (the
multiplier theory is that for every additional X dollars of reserves,
the banking industry will create an additional 10X, or some other
multiple of X, dollars of deposits). The Fed economists point out that
bank reserves are up by a staggering 2,173% since September-2008, and
yet over the same period M2 is up by only 11.4% and bank loans are down
by $140.2bn. Their conclusion: "...if
the level of reserves is expected to have an impact on the economy, it
seems unlikely that a standard multiplier story will explain the
effect." Are the Fed economists onto something?
The answer is yes, although they are about 15 years late in recognising
that the traditional relationship between bank reserves and money
supply no longer applies. It hasn't applied since the early 1990s, when
the Fed itself altered some regulations and effectively severed the
link between bank reserves and bank deposits. These days, almost any
amount of reserves can 'support' almost any amount of money.
The breakdown in the traditional relationship between bank reserves and
money supply was blatantly obvious in the data a long time prior to the
2008 financial crisis. Consider, for example, that from January-1990
through to August-2008 a 28% REDUCTION in bank reserves was accompanied
by a 215% GAIN in True Money Supply (TMS). If the famous "money
multiplier" had been in operation there would have been a large decline
in the money supply over this period.
The US economy is actually fortunate that the "money multiplier" no
longer 'works' the way it did in the distant past, because if it did
still work the way it is typically described in basic economics texts
then the Fed's trillion-dollar addition to bank reserves over the past
two years would potentially have resulted in the money supply rising by
as much as 10 trillion dollars, or about 200% (based on a starting TMS
value of around $5.4T in August of 2008). A money-supply increase of
this magnitude in such a short time would likely have caused the US
dollar to collapse and plunged the US economy into a hyperinflationary
depression.
Luckily, the banks haven't yet used their new reserves as the
foundation for a tower of new loans, but have, instead, shrunk their
loan books to a modest extent. It is important to understand, however,
that even without any net lending from the commercial banks the
Fed-Treasury combination has managed to engineer a 27% increase in TMS
since August of 2008 (note that as far as monetary aggregates go, TMS
is vastly superior to M2). By historical standards, that's an unusually
large 2-year increase and constitutes definitive evidence that the
continuation of inflation does not depend in any way on either the
ability or the willingness of private banks to make new loans.
The Stock Market
Thus
far it has been a quiet week for the broad US stock market. The market
remains 'overbought', but hasn't yet done anything to indicate that a
short-term top is in place.
The monthly ISM (Institute of Supply Management) Index will be reported
on Friday 1st October. The ISM Index is a measure of how US
manufacturing businesses are performing and is more meaningful than the
vast majority of economic indicators.
It will be interesting to see the extent of economic softening revealed by the ISM Index.
Gold and
the Dollar
Gold
There has been a remarkable lack of volatility in the gold market since
the beginning of August. There have not been any meaningful pullbacks
or large up-days; gold has just plodded higher.
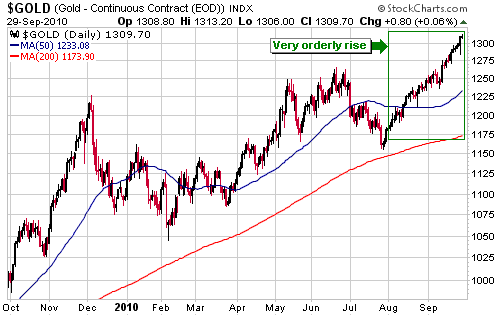
The bearish
divergence between the euro-denominated gold price (gold/euro) and the
US$-denominated gold price continues to develop. We note, for example,
that the US$ gold price closed at a new all-time high on Wednesday
whereas gold/euro closed at a 5-week low. On a slightly longer-term
basis, gold peaked in real terms (peaked against most currencies and
commodities, that is) more than three months ago. Since then it has
been pushed upward in US$ terms by weakness in the US$.
The almost complete absence of volatility means that gold is probably
not yet near a top of long-term or even intermediate-term importance,
but the extent to which gold is now 'overbought' in US$ terms combined
with the divergence mentioned above suggests that a multi-week downturn
will soon begin.
Gold Stocks
Current Market Situation
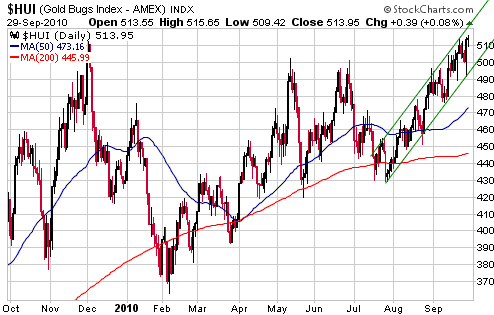
Like the broad stock market, the gold sector of the market was quiet
over the first three days of this week. There was a downward spike
during the first half of Tuesday's US trading session that helped
define the bottom of the channel drawn on the following daily HUI
chart, but nothing of real significance happened.
Based on what has happened over the past 10 years, a pullback to the
vicinity of the HUI's 50-day moving average is likely during October.
This will be the case regardless of whether or not the HUI breaks above
major resistance at 515-520 over the next few days.
A daily close below 495 would take the HUI below its short-term channel
bottom and signal that the aforementioned pullback was underway.
A note on valuing gold/copper deposits
Some mineral deposits have a combination of gold and copper. A simple
way to come up with a valuation for such deposits is to convert the
copper part of the resource to a gold-equivalent amount. For example,
assume that a deposit contains 1B pounds of copper and 2M ounces of
gold. With copper priced at $3.50/pound and gold priced at $1300/oz, it
could be said that 1B pounds of copper is the equivalent of 2.7M ounces
of gold (1B pounds times $3.50 per pound divided by $1300 equals 2.7M).
The deposit could therefore be said to contain 4.7M gold-equivalent
ounces and valued as if it were a 4.7M-ounce gold resource.
The above-described method of converting a gold-plus-copper resource
into a gold-equivalent amount simplifies the valuation process and is
regularly used, but it will typically result in an unrealistically high
valuation for the overall deposit and therefore isn't appropriate. The
reason this method will tend to yield an unrealistically high valuation
is that, all else being equal, the market generally assigns a much
lower value to a dollar of in-ground copper (or any other base metal)
than to a dollar of in-ground gold. Putting it another way, the market
generally values copper resources much more lowly than gold resources.
It has always been this way and likely always will be this way, which
is why it is inappropriate to convert a copper resource to its gold
equivalent.
The difference between the valuations assigned by the market to
in-ground gold and in-ground copper isn't an example of market
inefficiency or irrationality; it's a logical reflection of the fact
that the gold market is dominated by investment-related demand (which
encompasses monetary, speculative and store-of-value-related demand),
whereas the copper market is dominated by industrial consumption. To be
more specific, if a metal's primary purpose is to act as a store of
value then it can serve its purpose almost as well below ground as
above ground, but if a metal's primary purpose is to be part of a
manufacturing or construction process then it can't serve its purpose
at all until it is extracted from the ground.
The same applies to silver, and for the same reason. Consequently,
converting a silver-lead-zinc resource into a silver-equivalent
resource and then valuing this resource as if all the in-ground metal
were silver would yield an unrealistically high valuation.
In a nutshell, the only time it makes sense to use gold-equivalent or
silver-equivalent calculations when valuing deposits that contain a
mixture of metals is when the only metals involved are gold and silver.
Currency Market Update
Much of what comes under the heading of "technical analysis" is based
on the idea that price patterns repeat. The reality is that they do
repeat, and they do so because regardless of how different the
"fundamentals" happen to be at any time, human nature doesn't change.
However, there is no way of knowing in real time exactly which pattern
is about to repeat. To be more specific, we can be certain that no
market will do anything over the next few months that hasn't been done
by a market in the past, but until after it happens we won't know for
certain which prior pattern is relevant.
Just to be clear: we are sure that historical price patterns contain
clues regarding the likely performance of market prices in the future.
However, it is important to recognise the limitations of such analysis.
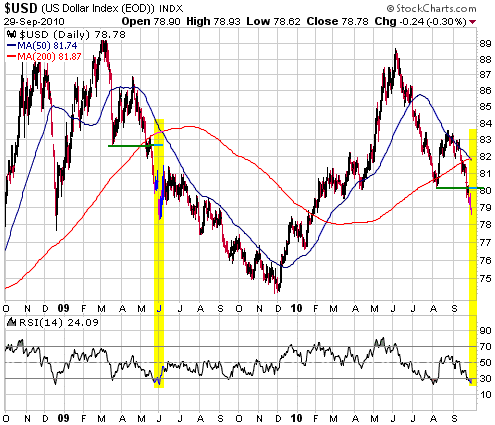
With the above 'disclaimer' in place, we point out that the Dollar
Index's performance over the past few months has been almost identical
to its performance during the few months leading up to June-2009.
Furthermore, the similarities extend to the positions of the 50- and
200-day moving averages and the Relative Strength Index (RSI). Refer to
the following chart for details.
If the similarities continue then the Dollar Index will make an interim
low within the next few days and rebound to the vicinity of its 50-day
moving average over the next few weeks, after which the downward trend
will resume.
From a fundamental
perspective, the idea that the Dollar Index will move substantially
lower over the next several months doesn't make sense. It doesn't make
sense because as bad as the dollar's fundamentals appear to be, the
euro's appear to be even worse.
Some European countries are beginning to experience "austerity protests".
This is evidence that once people become accustomed to 'feeding at the
government trough' it is politically difficult for the government to
reduce the 'food' supply. We wonder how many of the protestors
understand how the government gets its money. Do they realise that
every dollar they receive from the government must be borrowed or
stolen from someone else? Do they care?
Likely implications of increasing social unrest associated with
so-called "austerity programs" are that government cutbacks will be
short-lived and there will be more euro inflation -- inflation being
the most politically expedient way for over-extended governments to
keep voters happy in the short-term -- than most market participants
currently expect.
Update
on Stock Selections
(Notes: 1) To review the complete list of current TSI stock selections, logon at http://www.speculative-investor.com/new/market_logon.asp
and then click on "Stock Selections" in the menu. When at the Stock
Selections page, click on a stock's symbol to bring-up an archive of
our comments on the stock in question. 2) The Small Stock Watch List is
located at http://www.speculative-investor.com/new/smallstockwatch.html)
 Northgate Minerals (AMEX: NXG, TSX: NGX). Shares: 290M issued, 297M fully diluted. Recent price: US$3.14 Northgate Minerals (AMEX: NXG, TSX: NGX). Shares: 290M issued, 297M fully diluted. Recent price: US$3.14
NXG announced a $135M convertible-note financing prior to the start of
trading on Wednesday. As far as we can tell, the financing is being
done in a way that ensures the least favourable rates for the company
and the maximum possible short-term weakness in the stock price. In
particular, the financing is being arranged by the underwriter on a
best efforts basis, with the conversion rate and the interest rate to
be determined in the context of the market. The only plus is that NXG
will be able to decide whether the notes are paid back in cash or
shares. This is potentially a significant plus, however, because if our
understanding is correct it could mean that there will be no dilution
of the stock as a result of this financing.
We can't comment further at this stage because some of the most
important financing terms are still unknown. The stock will probably
find support at around US$3.00, but a lot will depend on the
yet-to-be-finalised details.
 Andina Minerals (TSXV: ADM). Shares: 108M issued, 129M fully diluted. Recent price: C$1.48 Andina Minerals (TSXV: ADM). Shares: 108M issued, 129M fully diluted. Recent price: C$1.48
In our 9th August and 25th August commentaries we said that a break
above C$1.40 by ADM would probably be followed by a rise to
C$1.70-$1.80, where a lot of supply would undoubtedly 'come out of the
woodwork', and that good news relating to the PEA (due to be finished
early next year) would probably be needed to get the stock above
C$1.80. ADM made it to resistance at C$1.80 last week and was then,
predictably, overwhelmed by supply.
It quickly dropped back from resistance at C$1.80 to support at C$1.40,
so the price action of the past several days created opportunities to
do some selling near resistance AND some buying near support. As we
keep suggesting: you should scale in during the purges and scale out
during the surges, all the while maintaining a core position.
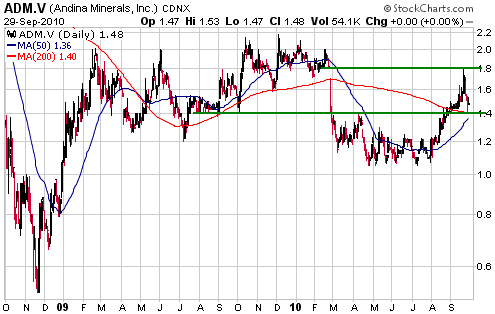
The next time ADM
tests resistance at C$1.80 it will have a better chance of breaking
through, because some supply will have been absorbed by last week's
test. However, the odds still favour the idea that a sustained breakout
will require good news relating to the PEA.
 Geovic Mining Corp. (TSX: GMC). Shares: 103M issued, 138M fully diluted. Recent price: C$0.80 Geovic Mining Corp. (TSX: GMC). Shares: 103M issued, 138M fully diluted. Recent price: C$0.80
Speculative stocks linked to minor metals have 'gone for a run' over
the past month, with GMC, a development-stage cobalt miner, joining in
to a modest extent over the past fortnight.
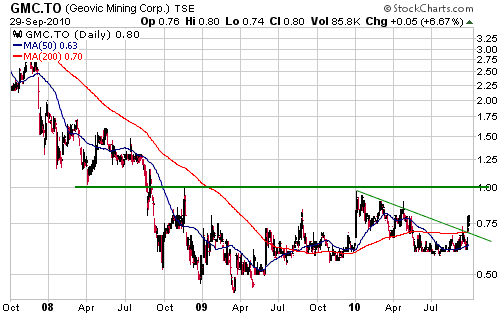
The following chart shows that GMC has been basing for the past two years. The top of the base is at C$1.00.
The fact that the
market is now rewarding small-cap mining stocks for any bits of good
news makes GMC an interesting speculation at this time, especially if
it can be purchased at C$0.75 or lower. One reason is that GMC is
scheduled to release an updated Feasibility Study (FS) for its
Cameroon-based Nkamouna cobalt-nickel project within the next few
weeks. If the FS shows robust economics at the current cobalt price,
which it probably will, then the market will have something to get
enthusiastic about. There could also be news in the not-too-distant
future about project financing.
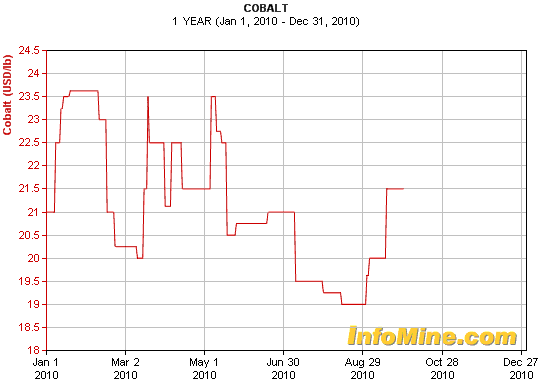
The price of cobalt has oscillated between $19 and $23.50 over the
course of this year and is now near the mid point of its range (see
chart below). We have no opinion on the likely performance of the
cobalt market and wouldn't purchase GMC as a bet on a higher cobalt
price. GMC is interesting because the company could potentially make a
lot of money at the current cobalt price.
 Energy Fuels Inc. (TSX: EFR). Shares: 97M issued, 106M fully diluted. Recent price: C$0.34 Energy Fuels Inc. (TSX: EFR). Shares: 97M issued, 106M fully diluted. Recent price: C$0.34
EFR is a high-risk/high-reward play on uranium. The stock has rebounded
along with many other exploration/development-stage uranium miners over
the past couple of months, and is now testing short-term resistance at
C$0.35. With the uranium market showing incipient signs of strength, an
EFR pullback to the 50-day moving average would create a new buying
opportunity for risk-tolerant speculators.
Chart Sources
Charts appearing in today's commentary
are courtesy of:
http://stockcharts.com/index.html
http://www.infomine.com/

|

