|
- Interim Update 29th October 2008
Copyright
Reminder
The commentaries that appear at TSI
may not be distributed, in full or in part, without our written permission.
In particular, please note that the posting of extracts from TSI commentaries
at other web sites or providing links to TSI commentaries at other web
sites (for example, at discussion boards) without our written permission
is prohibited.
We reserve the right to immediately
terminate the subscription of any TSI subscriber who distributes the TSI
commentaries without our written permission.
The Stock Market
Bear Market Comparison
The major decline in the US stock market that began in October of 2007
is part of -- quite likely the first downward leg of -- the second
cyclical bear market within the secular bear market that began in 2000,
the first cyclical bear market having occurred during 2000-2002.
Furthermore, the post-Oct-2007 decline is the second-largest 12-month
decline of the past 100 years, even exceeding the decline during the
first 12 months of the 1929-1932 stock market collapse.
The past century's largest 12-month decline in the US stock market
happened during 1937-1938. Interestingly, the 1937-1938 stock market
decline was also the first downward leg of the second cyclical bear
market within a secular bear market. And, as is the case with the
2007-2008 decline, it followed a government-sponsored inflation-fueled
boom and prompted an unprecedented (at the time) increase in government
indebtedness as the incumbent party desperately attempted to prop-up
its languishing popularity by mortgaging the future. In 1938 and the
years thereafter it was war that provided the justification for a
massive increase in government indebtedness and monetary inflation. In
the current cycle the justification is being provided by credit
contraction, falling house prices and widespread insolvency within the
banking industry.
The following chart compares the cyclical bear market of 1937-1942 with
the cyclical bear market that began in October of 2007. The chart's
vertical axis shows the percentage decline from the major peak and the
chart's horizontal axis shows the number of weeks after the major peak.
Note that:
a) 12-13 months after the 1937 peak the market commenced an upward trend that would last about 7 months.
b) The 1942 low (the ultimate low of the 1937-1942 cyclical bear
market) wasn't far below the 1938 low in nominal price terms. However,
there was massive inflation during 1938-1942, so in real terms the 1942
low was much lower than the 1938 low. In this respect, the relationship
between the 1938 and 1942 lows is similar to the relationship between
the 1974 and 1982 lows. In both of these historical cases the final
bear market low was close to the initial bear market low in nominal
terms, but only because inflation masked what was really happening.
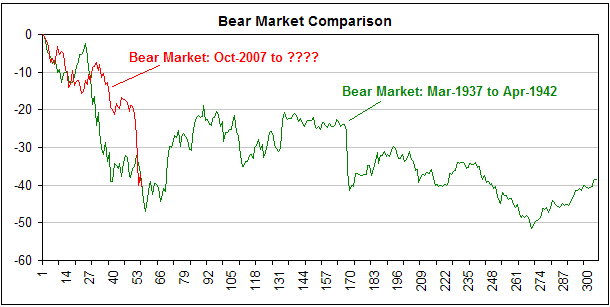
The comparison with
the late-1930s, when considered alongside the sentiment extremes
observed over the past month and the equally extreme policy responses
that have occurred to date, suggests that the US stock market has
reached an intermediate-term bottom. It also suggests that the market
is close to its ultimate bottom in nominal price terms, but probably
has a long way to fall in real terms. This is especially so because the
government's draconian efforts to inflate its way out of the current
mess will elevate prices while ensuring that real savings are not used
in the most productive way, thus guaranteeing many years of poor
economic performance.
Our guess is that the bear market will end in a few years time with the
Dow near its current level in dollar terms and at less than 30% of its
current level in gold terms.
Current Market Situation
All sorts of sentiment extremes have been reached over the past month.
For example, in addition to the indicators of stock market sentiment
that we have noted in earlier commentaries it is significant that
consumer confidence in the US, as measured by the Conference Board, was
reported this week to have fallen to its lowest level since 1967 (the
year when records began). Like all measures of the public's sentiment,
the Conference Board's index of consumer confidence is a contrary
indicator in that the public is invariably very optimistic near
important tops (when pessimism is warranted) and very pessimistic near
bottoms (when optimism is warranted). In other words, the all-time low
in consumer confidence reported early this week can be added to the
pile of sentiment-related evidence that an intermediate-term stock
market bottom is at hand.
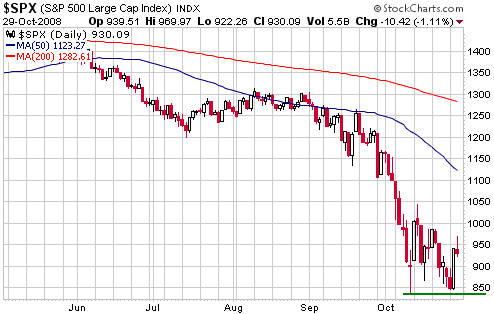
The market action over the first three days of this week was bullish.
As evidenced by the following daily chart of the S&P500 Index
(SPX), the US market moved all the way back to its 10th October
intra-day low on Monday and then rebounded ferociously on Tuesday. On
Wednesday the market was 'choppy' as traders first tried to anticipate,
and then reacted to, the Fed's interest rate cut.
There's a good chance, in our opinion, that Monday's decline will prove
to be a successful test of the 10th October low and that Tuesday 28th
October will prove to be 'Day 1' of a new intermediate-term upward
trend. However, we are well aware that ferocious single-day rallies are
quite common during bear markets and, therefore, that Tuesday's rally
doesn't mean much in isolation. What we now need in order to confirm
the upward reversal is a daily close above Wednesday's high (970).
The Commodity Rout
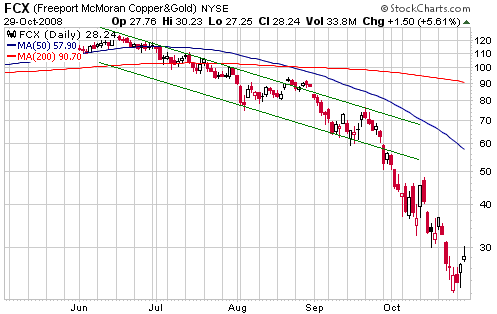
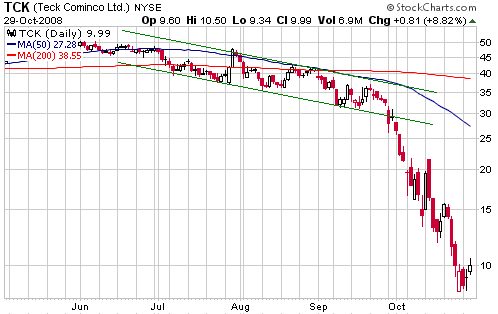
Included below are charts of Freeport McMoran (FCX), the world's
largest publicly traded copper producer, and Teck (TCK), one of the
world's largest diversified mining companies. These charts are
presented to show the extraordinary nature of the downturn in
commodity-related equities. Here we have two financially strong
large-cap mining companies that have lost more than 80% of their market
values within the space of a few months. Notice that the declines were
proceeding in a fairly orderly manner until late September, at which
point trap doors seemed to suddenly open.
To put what has happened to the commodity sector into perspective, the
major commodity stocks have fallen by almost as much in just the past
few months as the major tech stocks fell during the course of the
entire 2000-2002 bear market. And what makes this even more
mind-boggling is that the commodity stocks were not particularly
expensive, by traditional valuation metrics, to begin with.
The spectacular
decline in the commodity sector reflects a number of market dynamics.
For example, the Lehman Brothers collapse in early September resulted
in both the quick-fire unwinding of this investment bank's
commodity-related positions and the stranding of some commodity-focused
hedge funds that had used Lehman as their prime broker. Also, newly
introduced regulations preventing the short selling of financial stocks
forced short sellers to concentrate on non-financial stocks, and with
some commodity-focused funds quite obviously in trouble the commodity
sector became an attractive target. Most of all, though, the commodity
sector's spectacular decline reflects the massive amount of leverage
that had built up over the preceding years. It is now crystal clear
that a lot of commodity stocks were owned 'on margin'.
With margin-related selling having driven the prices of most commodity
stocks way below fair value, the stage is now set for an impressive
rebound.
Gold and
the Dollar
Gold
We had expected gold to do much better than it has done over the past
two months, but then again we weren't expecting the sort of carnage
that has occurred in the commodity and equity markets. Had we thought
that a total equity and commodity rout was on the cards then we would
not have been short-term bullish on gold. In any case, given everything
that has happened gold bullion has held up remarkably well to date. It
has pulled back in terms of the US$ and the Yen, the currencies that
were desperately sought in order to repay debt, but it has rallied in
terms of almost every other currency and has dramatically outperformed
industrial commodities and equities.
It looks like some semblance of stability is returning to the financial
world, at least momentarily. If this is true then we are probably
entering a multi-month period in which gold partially retraces the
gains it has recently made relative to most industrial commodities,
including silver and platinum. A return to some semblance of
financial-world stability would also pave the way for strength in gold
stocks relative to gold bullion.
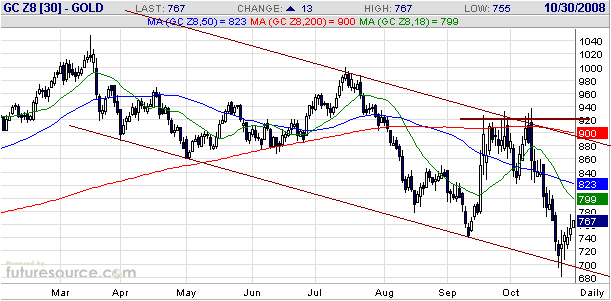
With reference to the following daily chart of December gold futures,
the early-October peak and the late-October trough in the gold price
have helped to define a downward-sloping channel. The top of this
channel is currently in the high-800s, but the most important
resistance is defined by the series of peaks that were made at around
$920 during September and October. Gold will have to surmount this
resistance to signal the start of a new intermediate-term rally.
Gold Stocks
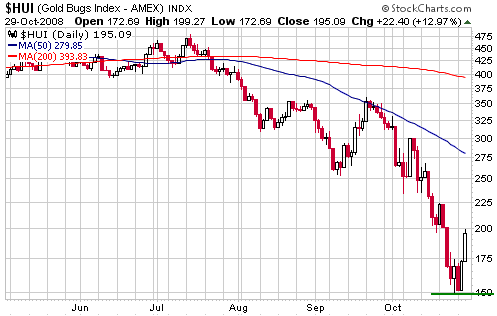
More evidence that the gold sector has FINALLY bottomed emerged over
the first three days of this week. Referring to the following daily
chart, the HUI tested last Friday's intra-day low on both Monday and
Tuesday before moving sharply higher.
The HUI gained about 30% from Tuesday's low to Wednesday's high. It
would not be surprising if a 1-3 day consolidation followed such a
large percentage gain, but a strong upward bias should be maintained
for at least a few weeks given that the gold sector is rebounding from
its most oversold extreme ever.
Gold stocks should be
helped over the next 6 months by improvements in earnings. The third
quarter of this year is when gold bottomed relative to oil and,
therefore, when the profit margins of most gold miners will have
bottomed out. Consequently, the third quarter's earnings (the earnings
that are currently being reported) should mark a low point, with
significant increases being achieved during the final quarter of this
year and during 2009 (assuming that gold only gives back a portion of
the gains it has recently made against oil and other commodities). If
it does its job properly, the stock market will discount the improved
earnings outlook over the next few months.
Currency Market Update
Intermediate-Term Outlook
The US$ has been given a hefty boost over the past several weeks by
global de-leveraging and is now pulling back sharply as asset prices
rebound and the urgent need for cash abates somewhat. However, the
dollar's intermediate-term upward trend against the euro is underpinned
by more than just the 'dash for cash'. It is also supported by the
higher real interest rates that stem from falling inflation
expectations (real short-term interest rates are trending upward even
though the Fed is pushing downward on nominal short-term rates), and,
perhaps most importantly of all, by the growing awareness of the euro's
flaws.
Chief among the euro's flaws, in terms of its ability to compete with
the US$ over the long-term, is the lack of a political union to support
the currency union. We've been saying for quite a while that as the
economic situation across Europe deteriorates in response to the
bursting of credit bubbles and the associated property bubbles, there
will be a substantial risk that the weakest members of the monetary
union will break away in order to re-gain the freedom-to-inflate
coveted by almost every political leader. Furthermore, it seems to us
that for the ECB to mitigate this risk it would have to gear its
monetary policy to the needs of these weakest members. In other words,
we see a distinct possibility that the ECB will end up either presiding
over a downsized monetary union or becoming so loose as to make the US
Federal Reserve look tight. Either outcome would be intermediate-term
bearish for the euro relative to the US$.
In addition to the risk of Europe's monetary union coming apart at the
seams, it appears that in at least one important respect the European
banking system is in worse shape than its US counterpart. According to
an article posted at Telegraph.co.uk on 27th October: "The
latest data from the Bank for International Settlements shows that
Western European banks hold almost all the exposure to the emerging
market bubble, now busting with spectacular effect. They account for
three-quarters of the total $4.7 trillion (£2.96 trillion) in
cross-border bank loans to Eastern Europe, Latin America and emerging
Asia extended during the global credit boom -- a sum that vastly
exceeds the scale of both the US sub-prime and Alt-A debacles."
Current Market Situation
In the latest Weekly Update we mentioned that a normal correction would
take the Dollar Index back to the low-80s. Wednesday's moves in the
currency market confirm that a correction is underway.
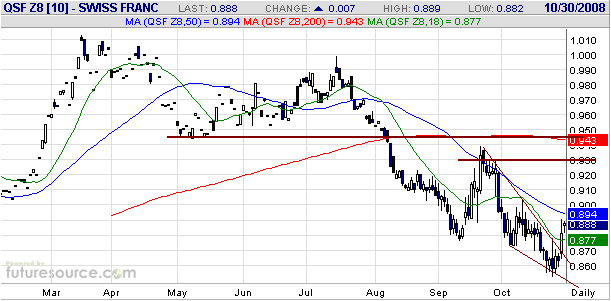
Below is a daily chart of December Swiss Franc futures. Wednesday's
action suggests that a short-term bottom is in place for the SF and
potentially sets the stage for a rebound to the resistance that extends
from 0.93 up to 0.945.
Update
on Stock Selections
(Note: To review the complete list of current TSI stock selections, logon at http://www.speculative-investor.com/new/market_logon.asp
and then click on "Stock Selections" in the menu. When at the Stock
Selections page, click on a stock's symbol to bring-up an archive of our comments on the stock in question)
 Western Goldfields (AMEX: WGW, TSX: WGI). Shares: 137M issued, 155M fully diluted. Recent price: US$0.62 Western Goldfields (AMEX: WGW, TSX: WGI). Shares: 137M issued, 155M fully diluted. Recent price: US$0.62
The market capitalisations of a number of junior gold/silver miners
have recently fallen below the values of their cash in the bank.
Furthermore, over the past week the situation became so absurd that the
market capitalisation of New Gold (NGD), a mid-tier gold miner, fell
below its cash value.
WGW is trading a long way above the value of its cash in the bank, but
it is still a very cheap stock on a risk-adjusted basis. Its Mesquite
mine in California is in production and is slated to produce 175K
ounces/year at a cash cost of $420/oz beginning in 2009 (2008
production is expected to be 117K ounces), which means that the company
should be able to achieve a gross margin of around $200/ounce if it can
sell its gold at an average price of $700/oz. Applying a relatively
conservative multiple of 10 to this cash flow suggests that Mesquite is
worth about $350M (175K ounces at $200/ounce gross profit), or US$2.30
per WGW share (based on 150M shares). Moreover, the estimated value per
WGW share doubles if we assume that its average sales price will be
$900/oz rather than $700/oz.
The risk that WGW will end up getting an average price of less than
$700/ounce for its gold is low because 66K ounces/year of WGW's
production has been forward sold at $801/oz. This forward sales
commitment is a longer-term negative because it caps the upside on
almost 40% of the company's production; but it goes a long way towards
ensuring that WGW will generate a lot of cash over the coming years,
and in the current market environment that is a definite plus.
Additionally, with plenty of cash in the bank and plenty of incoming
cash from Mesquite, WGW will be in a good position to take advantage of
the ultra-depressed prices that exist within the ranks of
exploration-stage gold mining stocks. As we've noted in the past,
Golden Queen Mining (TSX: GQM) is the most logical target for WGW. By
purchasing GQM or another miner with a multi-million ounce
development-stage project, WGW could water-down the long-term
significance of its gold hedge.
 Crowflight Minerals (TSXV: CML). Shares: 268M issued, 307M fully diluted. Recent price: C$0.145 Crowflight Minerals (TSXV: CML). Shares: 268M issued, 307M fully diluted. Recent price: C$0.145
Emerging nickel producer CML announced early this week that it had
taken advantage of the depressed nickel price by monetising the
positive mark-to-market value of its forward sales book. The
closing-out of 90% of its nickel hedge has allowed CML to repay $43M of
debt, leaving a debt balance of only $7.6M, and has injected $19M of
cash onto CML's balance sheet. This was an opportunistic and very
sensible thing to do as it has resulted in CML becoming a much more
financially secure company.
For new buying we continue to prefer gold equities to base metal
equities, but those who are holding CML should, in our opinion,
continue to hold.
We expect that base metal stocks will rebound with the broad stock
market over the next several months, with the majors leading the way
and the juniors joining in during the first quarter of 2009.
Chart Sources
Charts appearing in today's commentary
are courtesy of:
http://stockcharts.com/index.html
http://www.futuresource.com/

|

