|
- Interim Update
29th October 2014
Copyright
Reminder
The commentaries that appear at TSI
may not be distributed, in full or in part, without our written permission.
In particular, please note that the posting of extracts from TSI commentaries
at other web sites or providing links to TSI commentaries at other web
sites (for example, at discussion boards) without our written permission
is prohibited.
We reserve the right to immediately
terminate the subscription of any TSI subscriber who distributes the TSI
commentaries without our written permission.
The Fed
With the Fed's infamous "tapering"
now complete and its latest round of QE having ended amidst
vigorous, congratulatory back-patting, the main questions -- in a
world where the actions of the monetary central planners are far
more important to the markets than anything else -- revolve around
when and by how much the Fed will hike its targeted overnight
interest rate (the Fed Funds Rate). Rather than paying attention to
the opinions of various commentators and economists we think it
makes sense to look to the market for answers, bearing in mind that
the market's answers will vary from week to week.
The market's answers regarding the timing and extent of the coming
Fed rate-hiking program are contained in the prices of Fed Funds
Futures (FFF) contracts. Of these contracts, the most interesting
and most useful at this time is the one that expires in December of
2015, because this contract tells us what the market expects to
happen to the Fed Funds Rate next year.
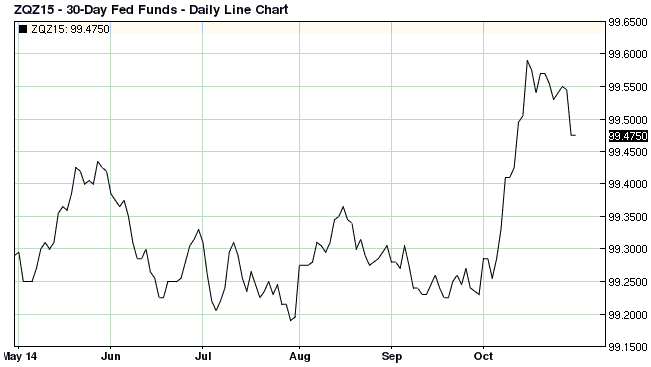
The December-2015 FFF contract is currently priced at 99.475 (see
chart below), which implies an average expected Fed Funds Rate of
0.525% in December of next year. This, in turn, implies that the
market is expecting at least one, but no more than two, 0.25% rate
hikes during the second half of next year (the current price of the
July-2015 FFF contract suggests that there is almost no belief that
the Fed will start hiking the Funds Rate prior to the middle of next
year). This expectation didn't change by much after the latest FOMC
statement was released on Wednesday 29th October, as the implied
expected Fed Funds Rate in December of next year was about 0.45% at
the close of trading the previous day.
The market's belief that there will be only one or two 0.25% rate
hikes between now and the end of next year is consistent with the
Funds Rate guidance emanating from the Fed's leadership, but is at
odds with the economy-related commentary of the Fed and almost all
mainstream analysts, economists and other pundits. The popular view
is that the US economy is doing fine and is likely to get even
better, but if this is true then why is Zero Interest Rate Policy (ZIRP)
still in place and predicted to remain in place for at least another
12 months? A good economist would, of course, understand that ZIRP
cannot do anything other than hurt the economy (at its core it is
nothing more than a means of transferring wealth from savers and the
productive elements within the economy to financial institutions and
carry-trading speculators), but most people and all senior
representatives of the Fed believe that it helps to support a weak
economy. Therefore, the pertinent question is: If it is true that
the US economy is no longer weak, then why is ZIRP still expected to
remain in place for a "considerable time"?
Euro-Zone and G2 Monetary Inflation
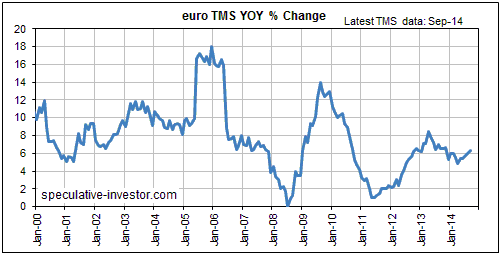
The ECB snapped into action this week and
published euro-zone money-supply figures for September. According to these
figures and as illustrated by the following chart, euro-zone TMS (True Money
Supply) rose by 6.4% over the 12-month period ending 30th September 2014. This
is 2014's highest year-over-year (YOY) growth rate and makes a mockery of the
deflation fear being expressed by financial journalists and the ECB itself, but
is roughly unchanged from where it was a year ago.
At a time when private and public sector debt is at dangerous levels a 6.4%
monetary inflation rate might not be high enough to generate the "price
inflation" that Mario Draghi and most other Keynesians mistakenly believe is
needed, but the euro-zone is presently not close to genuine deflation.
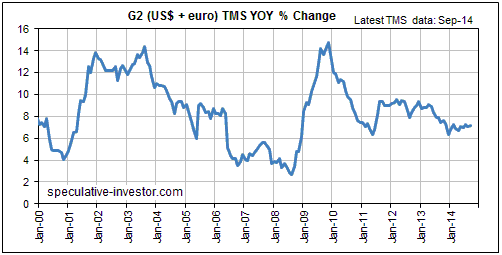
With September figures now in hand for the euro-zone we have been able to update
our chart showing the G2 (US plus euro-zone) monetary inflation rate. The result
is displayed below.
As a leading indicator of major economic trend changes and/or global financial
crises, the G2 monetary inflation rate has been more reliable than the US and
euro-zone monetary inflation rates in isolation. The G2 monetary inflation rate
has flat-lined at around 7% over the past year, which is not far from its lows
of the past 5 years but is still a few percent above the levels that preceded
the 2000-2002 and 2007-2008 crises. All things considered, we would take a
decline to below 6% as a clear-cut warning of impending crisis.
 The Stock Market
US consumer confidence hits a multi-year high
A
29th October Bloomberg article contained the following comments on the
latest Consumer Confidence number:
"Consumer confidence advanced in October as Americans enjoyed further price
drops at the gas pump and the job market continued to improve. The Conference
Board's index climbed to 94.5 this month, the highest since October 2007, from a
September reading of 89 that was stronger than initially estimated.
"The consumer confidence index was really big as everybody's been concerned
about what the pullback in the stock market means for holiday spending," John De
Clue, the Minneapolis-based chief investment officer for the Private Client
Reserve of US Bank, said in a phone interview. "When you approach this time of
year you're looking at a wall of money to be spent or not spent, and it looks
like now the fall in gasoline prices is going to offset that."
So, according to John De Clue* it's good news that consumer confidence in
October of 2014 is as high as it was way back in October of 2007. Has he
forgotten that in October-2007 the US stock market was at a major peak and the
US economy was within two months of entering an official recession?
Like most other indicators of the general public's sentiment, consumer
confidence is a contrary indicator at extremes. Confidence is always very high
at important peaks for the economy and the stock market, and confidence is
always very low at important bottoms for the economy and the stock market. While
a high level of confidence doesn't guarantee an important peak, it is a
prerequisite for one.
*It was difficult, but we resisted the temptation to make
fun of this name.
NYSE margin debt remains below its February peak
The NYSE margin debt figures are always published with a lag of about one month,
which is why the September figures have only just been published. The latest
figures show that although margin debt rose by a smidgen in September, it
remains 0.4% below the all-time high reached in February of this year. Given
that major peaks in margin debt have a history of occurring prior to major peaks
in the stock market, the fact that NYSE margin debt hasn't yet exceeded its
February-2014 high is consistent with the possibility that a major stock market
peak occurred in September. By the same token, if NYSE margin debt were to
exceed its February high it would be a sign that the equity bull market probably
had at least a few months to run.
The relationship between margin debt and the stock market is discussed in the
article posted
HERE. The following chart was taken from this article.
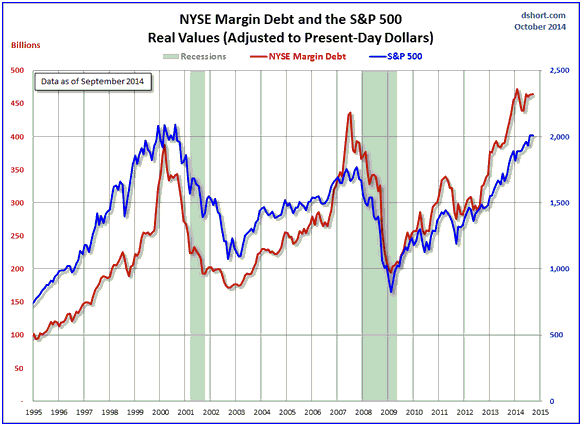
In broad terms, the relationship between margin debt and the stock market can be
worded as follows: Regardless of how much leverage there is, everything will
appear to be fine as long as leverage continues to increase.
Current Market Situation
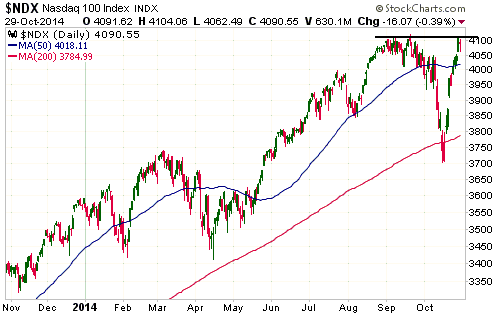
The US stock market's rebound continued over the past three days, in the process
enabling the S&P500 Index (SPX) to get within 1% of its 18th September closing
high and the NASDAQ100 Index (NDX) to test its September high (see chart below).
The NDX looks set to make a new high for the year, but ideally -- as far as our
outlook is concerned -- a new high in the NDX will not be confirmed by new highs
in the SPX or the Dow Industrials.
An important SPX level to watch over the next two days is the September closing
price of 1972. An October close above 1972 would be evidence that the
September-October decline was a bull-market correction and not the start of a
bear market. The SPX closed at 1982 on Wednesday 29th October.
Regardless of whether we are dealing with a bull-market correction or the first
stage of a new bear market, a short-term top is likely within the coming seven
trading days and a test of the October low is likely within the next month.
Consequently, we consider the next several days to be the optimum time to be
establishing or adding to bearish speculations such as SSO put options.
Gold and the Dollar
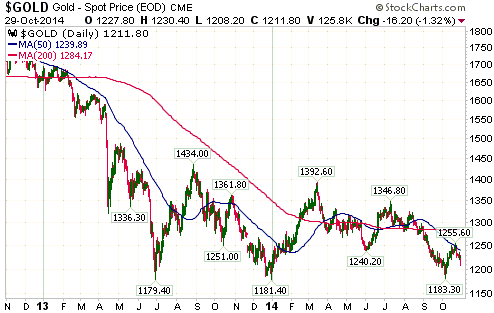
Gold
The US$ gold price reversed lower after reaching its 50-day MA last week. The
decline accelerated on Wednesday of this week after a few positive words on the
US economy in the latest FOMC statement prompted the liquidation of some
speculative long positions in the gold market.
Gold appears to be headed for another test of support at $1180. Almost everyone
expects that this support will soon give way, which actually makes it more
likely that the support will continue to hold for now. That being said,
quadruple bottoms are even rarer than triple bottoms, so another successful test
of the $1180 support level within the coming several days would increase the
probability that this support will be breached next year.
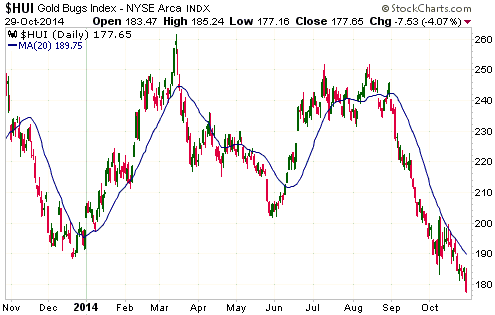
Gold Stocks
Tax-related selling pressure affects junior stocks more than senior stocks.
There is evidence in the price action that the first round of tax-related
selling pressure in the gold sector ended on Monday 27th October.
Evidence of tax-loss selling was apparent on Monday, when a 0.5% decline in the
gold price was accompanied by a 4.5% decline in GDXJ and a relatively minor 1.3%
decline in the HUI. That Monday was probably the final day of the first round of
tax-loss selling became apparent on Tuesday, when a flat gold price was
accompanied by a 4.2% rise in GDXJ and a 1.7% rise in the HUI. GDXJ was down a
hefty 7% on Wednesday, but this was due to a mini-panic out of all things
gold-related.
The first round of tax-related selling pressure stems from 31st October being
the financial year end for many hedge and mutual funds. The second and final
round will occur in December due to retail investors in the US and Canada taking
losses ahead of their 31st December financial year end.
The HUI is working on its 9th down-week in a row. As mentioned in the latest
Weekly Update, this means that the HUI is now so oversold that all it will take
to signal a reversal is a daily close above the 20-day MA (the blue line on the
following chart). Over the remainder of this week, that means a daily close
above 190.
The Currency Market
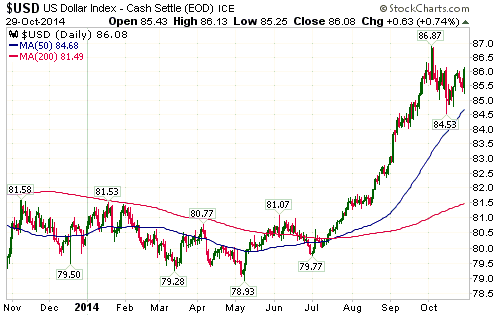
In the last two TSI commentaries we noted that the Dollar Index had improved its
chances of making a marginal new high (in the 87-88 range) before ending its
short-term upward trend. There was a further increase in the probability of such
an outcome on Wednesday 29th October, with the Dollar Index moving up to minor
resistance at 86 and our preferred measure of US equities relative to European
equities rising to a new high for the year.
Next week is shaping up as a likely time for short-term reversals in multiple
markets, including the currency market. Specifically, next week is shaping up as
a likely time for short-term highs in the Dollar Index and the US stock market,
and short-term lows in gold, the gold-mining sector, the T-Bond and the euro.
Updates
on Stock Selections
Notes: 1) To review the complete list of current TSI stock selections, logon at
http://www.speculative-investor.com/new/market_logon.asp
and then click on "Stock Selections" in the menu. When at the Stock
Selections page, click on a stock's symbol to bring-up an archive of
our comments on the stock in question. 2) The Small Stock Watch List is
located at http://www.speculative-investor.com/new/smallstockwatch.html
Chart Sources
Charts appearing in today's commentary
are courtesy of:
http://stockcharts.com/index.html
http://www.barchart.com/

|
