![]()
![]()
![]()
![]()
- Interim Update 29th November 2017
Copyright
Reminder
The commentaries that appear at TSI
may not be distributed, in full or in part, without our written permission.
In particular, please note that the posting of extracts from TSI commentaries
at other web sites or providing links to TSI commentaries at other web
sites (for example, at discussion boards) without our written permission
is prohibited.
We reserve the right to immediately
terminate the subscription of any TSI subscriber who distributes the TSI
commentaries without our written permission.
G2 monetary inflation
dips further into bust territory
Our G2 (US plus euro-zone)
monetary inflation indicator edged below the 6% boom-bust threshold in
September and dropped a little further in October.
As we stated a month ago, if the break below the boom-bust threshold
sticks then within six months we should be seeing evidence of bursting
bubbles. The most likely places for this evidence to first appear are the
high-yield bond market and the stock market, with the high-yield bond
market being the most vulnerable.
The Stock Market
What a difference two days can
make! Over Tuesday-Wednesday of this week the market darlings known as the
FANGs pulled back sharply, but this weakness in the leaders was more than
offset by dramatic strength in two of the sectors that were laggards prior
to this week. The dramatic strength we are referring to occurred in the
banking and transportation sectors.
In early-November the Bank
Index (BKX) plunged in dollar terms and relative to the SPX. In dollar
terms it came perilously close to breaking below critical support at 97.5,
while its weakness relative to the SPX was sufficient to be considered
bearish for the broad stock market and bullish for gold. At the close of
trading on Monday of this week there hadn't been a significant change, in
that a minor rebound from support looked more like a consolidation than
the start of a meaningful rally. However, over the next two days there was
a veritable moon-shot in the BKX to a new 10-year high in dollar terms and
to near an 8-month high relative to the SPX. This turned the banking
sector's relative strength from stock-market bearish to stock-market
bullish and from gold-bullish to gold-bearish.
The Dow Transportation Average (TRAN) ended last week near important
channel support. It needed to fall by only a small amount to signal that a
top of at least intermediate-term significance was in place, but instead
it rocketed upward to a new all-time high.
This week's upside breakouts by the BKX and the TRAN could turn out to
be false signals, but they also could have marked the starts of multi-week
surges. If you are concerned about the overall market's downside risk and
are looking for a new opportunity to enter a bearish speculation, it's
prudent to assume the latter until/unless the signals are proved to be
false via downward reversals.
Gold and the Dollar
Gold
Gold's 15-Year Cycle
This
discussion was prompted by the interview with David Vincent, a technical
analyst and gold company CEO, and the associated monthly gold chart posted
at the
Korelin Economics Report web site. Here's the gist of the interview
and the chart:
1) Gold is under the influence of a long-term cycle
that results in a major bottom every 15 years.
2) The most recent
cycle bottoms were in 2000 and 2015.
3) It is reasonable to assume
that an upward price trend of similar length and magnitude to that of the
2000-2011 period began in December-2015, in which case there will be a
major price top, potentially at around $8000/oz, in 2027 or thereabouts.
4) The 8 and 21 month MAs are important in defining gold's major price
trends, with a cross by the 8-month MA from below to above the 21-month MA
confirming the start of a major rally and a cross in the opposite
direction confirming the start of a major decline/correction.
The
monthly gold chart at the above-linked page only goes back to 1997. If we
go back further we find that there has, indeed, been a cycle with lows
every 15 years beginning in 1970. The blue vertical lines on the following
monthly chart mark these lows. However, we also find that the 15-year
cycle lows aren't always followed by major rallies. Instead, there was a
major rally following the 1970 low, a relatively minor (but still very
profitable) rally following the 1985 low, and a major rally following the
2000 low. If the pattern (major low followed by relatively minor low
followed by major low and so on) continues then 2015 was akin to 1985 and
the next major rally will begin around 2030.
The 15-year cycle low of 1985 was followed by a rally that lasted 2
years and nine months. If we are now dealing with something similar then
the rally that began in December-2015 will end during the second half of
next year.
That being said, the upward trend that began in
December-2015 has been far less consistent to date than the upward trend
that began in March-1985. This can be seen by comparing the two monthly
charts displayed below. Notice, in particular, that from the third month
onward the rally that began in 1985 (the first chart) held above the
8-month MA (the black line) on a monthly closing basis, whereas the recent
rally has experienced multiple monthly closes below both the 8-month MA
and the 21-month MA (the blue line). Up until now, however, the 8-month MA
has managed to hold above the 21-month MA.
At the risk of making the waters even muddier than they are we'll
reiterate a point we made several times last year, which is that the
closest historical parallel to the 7-month gold rally that began at the
December-2015 bottom is the 7-month gold rally that began at the July-1982
bottom. This rally is shown on the monthly chart displayed below. However,
gold's performance since the July-2016 top has been very different from
its performance following the early-1983 top.
Financial-market history repeats, so there's a great temptation to use
what happened in the past as a roadmap. Unfortunately, in real time you
never know exactly which financial-market history is repeating. A lot more
emphasis should therefore be placed on real-time analysis of fundamentals,
sentiment and technicals than on historical comparisons.
Current Market Situation
The
15-year cycle points to strength in the gold price during the first half
of 2018, albeit more like what happened in 1987 than what happened at any
time during the early-2000s. This is in line with what we expect based on
other analysis, but we've been warning that before the next substantial
gold rally gets underway there may have to be a sharp decline to flush out
the leveraged speculators who have stubbornly clung to their long
positions over the past 2.5 months.
The probability of a wash-out
decline to build a sentiment platform capable of supporting an
intermediate-term rally increased over the first three days of this week
due to deterioration (from gold's perspective) in the fundamental
backdrop. Our fundamentals-focused model was still gold-bullish at the end
of last week, but if there are no big changes over the coming two trading
days then the model will end this week in bearish territory. If so, the
gold market will be facing the combination of bearish fundamentals and
bearish sentiment.
The price action is neutral. The US$ gold price
tested round-number resistance at $1300 on Tuesday and Wednesday before
pulling back to its 50-day MA.
The price action leaves open the
possibility of a quick rise to the $1320-$1350 range in the near future,
but that's not an outcome worth betting on.
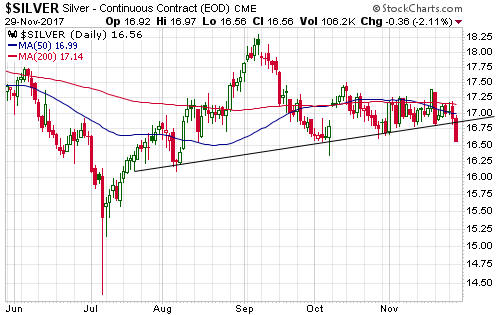
Silver
The US$ silver price broke decisively
below an obvious trend-line on Wednesday and ended the trading session at
lateral support. Both the price action and the sentiment situation (the
COT data) suggest that there will be an opportunity to buy silver at $15
or lower within the next two months.
Gold Stocks
The HUI has now spent more than
one month oscillating within a horizontal 5-point range. It ended Monday's
session at the top of this range but by the close of trading on Wednesday
it was near the bottom of the range. It's likely that a break below the
bottom of the range would lead to a quick decline to near the July low
(177). It could also pave the way for a test, within the ensuing 1-2
months, of the December-2016 low (160).
For those with substantial
exposure to gold and/or silver mining shares, a rebound within the next
week or so could reasonably be viewed as an opportunity to do some
hedging.
Many junior gold-mining stocks have been very weak of late. In some
cases the associated companies have issues that could be used to explain
the price weakness (for example, Asanko), but it appears to be related
more to a general lack of demand for gold-mining stocks than to
company-specific fundamentals.
The general problem is that there is
minimal demand for junior gold-mining stocks that are not associated with
interesting discovery stories. This means that to make money in the
near-term you have to focus on the stocks that other speculators believe
have discovery potential and in doing so run the risk of getting
shellacked if the news doesn't support the bullish dreams. Alternatively,
you could be patient in the knowledge that judiciously averaging into the
stocks of companies that offer good value will eventually pay off.
We don't know the extent to which 'crypto-mania' is adversely affecting
performance within the junior gold-mining world. We suspect that it is not
having a big direct effect but that it is part of the overall theme that
involves choosing dreams of what could be over current value. What we mean
is that the same sort of value-blind buying that pushed the Bitcoin price
up to $10,000 was responsible for bidding up the prices of a few discovery
stories to absurd levels (for example, Novo and Garibaldi) while companies
that had already proved-up substantial resources were left in the dust.
The Currency Market
The euro and the Swiss
Franc (SF) were mentioned in a
post at the TSI Blog early this week. This post
reiterated a point made in a TSI commentary a week earlier, which is that
the current sentiment backdrop suggests that the SF will be strong
relative to both the euro and the US$ over the next few months.
Turning to the Canadian dollar, two weeks ago we wrote:
"The
Canadian dollar (C$)...is currently in the midst of a rebound that could
extend as far as 80, but there's a good chance that it hasn't completed
its downward correction. The main reason is sentiment, as indicated by the
COT data. As is the case with the gold and silver markets, up until now
the C$'s decline from its early-September peak hasn't prompted enough
bullish speculators to 'throw in the towel'.
The C$ has both
lateral support and moving-average support at 77, which is only half a
point below the late-October low. This support could limit the downside,
but a final bottom at 75-76 now looks more likely."
It looks
like the C$'s rebound is over and that a decline to 75-76 is underway.
The C$ could reach its correction low as soon as December, but a
January-February bottom is more likely. The stage may then be set for
another intermediate-term rally, but we'll take the evidence as it comes.
Updates on Stock Selections
Notes: 1) To review the complete list of current TSI stock selections, logon at
http://www.speculative-investor.com/new/market_logon.asp
and then click on "Stock Selections" in the menu. When at the Stock
Selections page, click on a stock's symbol to bring-up an archive of
our comments on the stock in question. 2) The Small Stock Watch List is
located at http://www.speculative-investor.com/new/smallstockwatch.html
![]() Blackham
Resources (BLK.AX) finally -- after being suspended from trading for three
weeks -- published the details of its refinancing package and resumed
trading on Monday of this week. Rather than follow our normal practice and
wait for the Weekly Update, we'll deal with this news now.
Blackham
Resources (BLK.AX) finally -- after being suspended from trading for three
weeks -- published the details of its refinancing package and resumed
trading on Monday of this week. Rather than follow our normal practice and
wait for the Weekly Update, we'll deal with this news now.
On 1st
November the company advised that it had a credit approved term sheet to
fully refinance its A$36.7 million current secured debt position and that
the legal documentation was well advanced. This was good news. It turned
out, however, that refinancing the A$36.7M secured debt was only part of
the new financing package negotiated by BLK's management. The package also
has a substantial equity component that simultaneously reduces risk and
greatly reduces the company's per-share value.
Here are the
components of the refinancing (unless stated otherwise, all dollar amounts
are AUD):
1) A $40M senior secured loan from Pacific Road Capital
(PRC) with an interest rate of 9% per annum that effectively replaces the
existing secured loan. The difference is that whereas the first loan
payment under the existing loan is due in December-2017, the first payment
under the new loan won't be due until 30th June 2020. In other words, in
debt repayment terms BLK has bought itself an additional 2.5 years of
time.
2) A $10M standby facility from PRC that can be drawn by 30th
June 2018. Hopefully this won't be required.
3) A $7.35M private
placement of equity to PRC at 0.12/share. This requires the issuing of
61.3M new shares.
4) An entitlement offer to existing shareholders
that enables the purchase of two new shares at 0.12/share for every 7
shares held. If fully subscribed this will raise $12.3M and result in 103M
new shares being issued.
5) The issuing of 99.4M 5-year stock
options to PRC with an exercise price of 0.144.
Items 3) to 5) came
as a surprise, as information previously provided by the company had
strongly suggested that the refinancing would be totally debt-based. Items
3) and 4) aren't a problem because although they dilute the per-share
value the entitlement offer enables existing shareholders to maintain
their current ownership. Item 5) is a problem because it gives PRC massive
leverage to an improvement in BLK's performance/prospects at the expense
of all other shareholders.
If the entitlement offer is fully taken
up, the quantity of BLK shares on issue will increase by 47% from 350M to
514M and the fully-diluted share count will increase by 69% from 383M to
646M. The share count that we use for valuation purposes will increase
from 350M to 600M, since any scenario that doesn't involve the company
withering and dying will involve PRC exercising its low-priced options.
Taking into account the current moderately-depressed market
environment for gold-mining shares, our back-of-the-envelope valuation for
BLK's equity now ranges from 0.13/share to 0.28/share. The low end of this
wide range is based on a production rate of 80K ounces/year and the
assumption that the production is worth only US$1,000/oz (very
conservative), while the high end of the range is based on a production
rate of 100K ounces/year and the assumption that the production is worth
US$1500/oz (still slightly conservative, but not out of the ordinary in
the current market).
Given the large upside potential that doesn't
require any improvement in the overall market and the reduced risk
resulting from the healthier balance sheet, we suggest that existing
shareholders take up their entitlements to purchase two shares at 0.12 for
every seven shares currently held. Alternatively, it would be reasonable
to buy shares on the market if they trade near the 0.12 entitlement
exercise price, as is the case at the time of writing.
For TSI
record purposes it will be assumed that the entitlement is taken up.
Chart Sources
Charts appearing in today's commentary
are courtesy of:
http://stockcharts.com/index.html
![]()