|
- Interim Update 30th March 2011
Copyright
Reminder
The commentaries that appear at TSI
may not be distributed, in full or in part, without our written permission.
In particular, please note that the posting of extracts from TSI commentaries
at other web sites or providing links to TSI commentaries at other web
sites (for example, at discussion boards) without our written permission
is prohibited.
We reserve the right to immediately
terminate the subscription of any TSI subscriber who distributes the TSI
commentaries without our written permission.
The Fed-induced downward spiral
The following text and chart are from John Hussman's latest weekly commentary:
"...the poor performance
of the U.S. economy from an employment standpoint cannot be separated
from the Fed's attempts, for more than a decade, to make easy monetary
policy a substitute for the accumulation of real savings and
investment. ...Speculating and consuming off of cheap credit may feel
better than saving, but the long-term results are profoundly different."
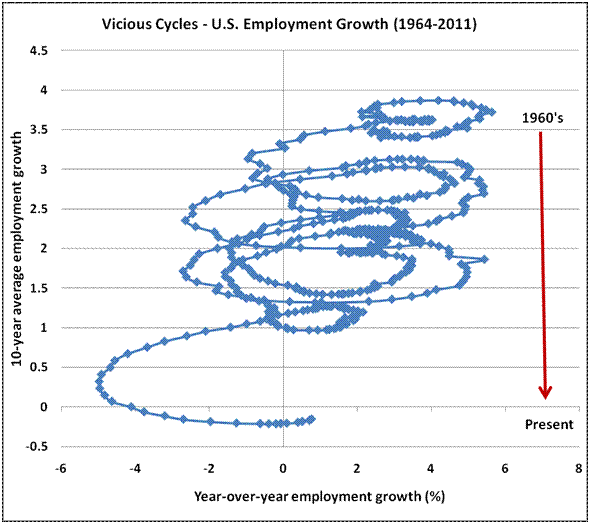
It could be argued
that factors other than the policies of the Fed and the US federal
government have contributed to the multi-decade downward spiral in US
employment growth illustrated above, but discussing these other factors
only clouds the issue. The reason is that the reduction over time in
the US economy's ability to create productive jobs is consistent with
what Austrian economics (good economic theory, that is) predicts would
be the result of the market distortions introduced by the Fed and the
government. Looking beyond Fed-sponsored inflation and the government's
meddling in the economy to explain the economic deterioration would be
akin to someone sitting in a sauna, with the temperature control
cranked up to the max, looking for reasons unrelated to the sauna for
why he/she is uncomfortably warm.
Unfortunately, very few people are looking in the right direction in
their efforts to diagnose the cause of the decline and come up with
solutions. As discussed last week, that's why we are long-term bears on
the US economy. There will be no hope as long as the causes of the
problem are misdiagnosed, because the proposed solutions will almost
certainly be wrong if the true causes of the problem are unknown. In
fact, if past is prologue then the proposed solutions will be exactly
the opposite of what is required and will make things worse. For
example, bad economists will recommend, and ignorant and/or
unprincipled policy-makers will bring about, more inflation of the
money and credit supplies in an effort to combat the problems caused by
earlier inflation of the money and credit supplies.
Successful Indoctrination
In
the latest Weekly Update we wrote a short piece in which we argued that
the only effective way to restrain the government and protect the
population from its own willingness to trade freedom for security (or,
at least, the perception of security) was to get the government out of
the money business. The market should decide what is and isn't money,
and the combination of market forces and natural physical limitations*
should determine the supply of and the demand for money.
This short piece was subsequently published as a standalone article at www.321gold.com,
and generated an unusually large amount of feedback. Most of the
feedback was supportive of the article's theme, but strangely,
considering that 321gold is a precious-metals-focused web site, some of
the respondents apparently couldn't conceive of a world in which money
wasn't printed and/or managed by an official institution. In other
words, some people couldn't even imagine an economic system in which
the money wasn't imposed on the masses by a higher authority.
It occurred to us that the view of a small minority of 321gold readers
was probably the view of the overwhelming majority of visitors to
mainstream web sites. That is, it occurred to us that the vast majority
of citizens probably couldn't conceive of a world in which money isn't
strictly regulated by the government. To the average person, the idea
that money should be left to the 'vagaries of the market' would
probably be anathema, especially since the global financial crisis of
2007-2009 has been widely reported as a market failure.
Considering that government has proven itself incapable of effectively
managing relatively simple processes, you'd be forgiven for thinking
that most people would realise the folly of placing in government's
hands the responsibility of managing something as important and complex
as the monetary system. Alas, that isn't the case. The public has been
indoctrinated over generations to believe that some services are so
critical that their provision cannot be trusted to the market, and
must, therefore, be provided by the government.
*For example, if
the market chose gold as money, as it most likely would, then the money
supply would be physically limited by nature.
The Stock Market
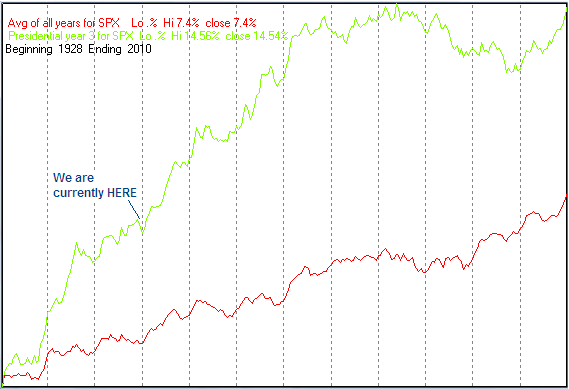
Presidential Cycle Update
2011 is the third year of the Presidential Cycle. As evidenced by the
following chart, the S&P500's average third-year performance
entails a strong upward trend through to July and then 'choppiness'
over the remainder of the year. In other words, the chart shows that
the market not only tends to be strong during the third year, but also
tends to make all of its upward progress during the first 7 months of
the year.
The "Presidential Cycle Model" (PCM) is not, by itself, a good reason
to be bullish (or a good reason not to be bearish). It is just one
piece of the puzzle, and should be taken into account along with all
the other pieces (monetary policy, valuation, sentiment, price action,
geopolitical developments, etc.).
With regard to the PCM, the points we wanted to make today are:
1) Despite some dramatic and potentially disruptive events (popular
uprisings in an important oil-producing region, a massive earthquake in
Japan, the worsening of Europe's sovereign debt problem and tightening
monetary policy in the "BRICs"), the US stock market has held up
remarkably well over the first four months of this year. Consequently,
it is fair to say that the market is roughly tracking the PCM.
2) The PCM suggests that the market will be very strong over the next 5 weeks.
3) Taking out the March low would be a significant departure from the PCM.
Current Market Situation
Here are some of the stock market indicators and indexes that we are paying close attention to:
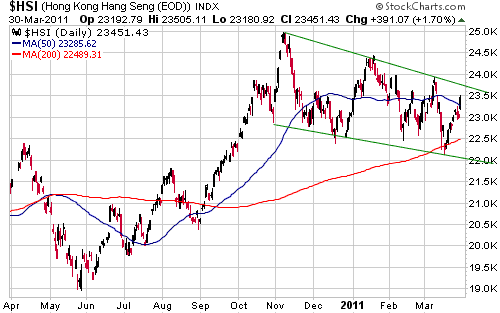
1. Hong Kong's Hang Seng Index (HSI). As illustrated below, the HSI has
rebounded strongly over the past two weeks but is now approaching an
important test in the form of the downward-sloping trend line that
dates back to early November of last year. Failure by the HSI to
confirm new 52-week highs in the senior US stock indices would be a
significant bearish divergence.
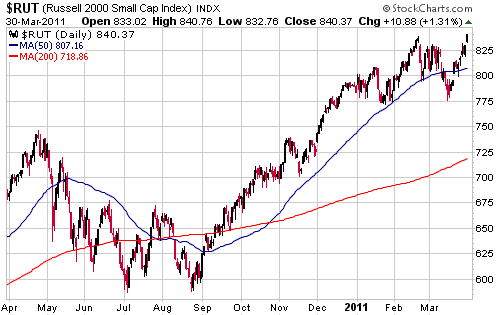
2. The Russell2000
Small Cap Index (RUT). Weakness in the RUT relative to large-cap
indices such as the S&P500 should generally be considered bearish,
and relative strength in the RUT should generally be considered
bullish. The RUT closed at a new multi-year high on Wednesday while the
S&P500 remained below its February high. This is a bullish
divergence.
3. The HYG/TLT ratio.
This indicator of credit conditions has partially retraced its
February-March decline, but remains well below the high reached earlier
this year. New highs in the senior stock indices alongside lower highs
in HYG/TLT would be a bearish divergence.
4. Gold relative to silver and the base metals. When gold begins to
strengthen relative to silver and the base metals it will probably mean
that the stock market's intermediate-term advance is at, or nearing,
its end.
5. The OEX put/call ratio. The 10-day moving average of the OEX
put/call ratio began to flash a warning signal at the beginning of this
year, and continues to do so. This indicator suggests that the 'smart
money' is presently a lot more worried than the 'dumb money' about
downside risk.
Our overall assessment is that the US stock market is probably going to
work its way higher over the next several weeks, but downside risk
remains worrisome.
Gold and
the Dollar
Gold
In the email alert sent during the Asian trading session on Wednesday, we wrote:
"There's a reasonable
chance that gold will break out to the upside within the coming week or
so, leading to a similar breakout in the HUI. The rally that followed
such a breakout would probably last only 4-6 weeks, but the rally's
magnitude could be significant (>10%). Also of note is that the risk
management parameters are currently clear, in that for this short-term
bullish scenario to remain plausible the gold price should not close
below $1380 during any additional 'corrective' action over the days
ahead.
Further to the above, we
are upgrading our short-term outlooks for gold and gold stocks from
"neutral" to "bullish". Unless advised otherwise, this short-term
bullish view will be 'stopped out' if gold closes below $1380."
In addition to gold's price action and the absence of any weakness in
the silver/gold ratio, the decision to upgrade our short-term outlook
was influenced by sentiment. Specifically, with Market Vane's latest
survey showing that only 75% of traders were bullish on gold and with
the latest COT Report showing that the total speculative net-long
position in COMEX gold futures was about 80,000 contracts shy of last
December's peak, there appears to be plenty of scope for the
recruitment of more bulls.
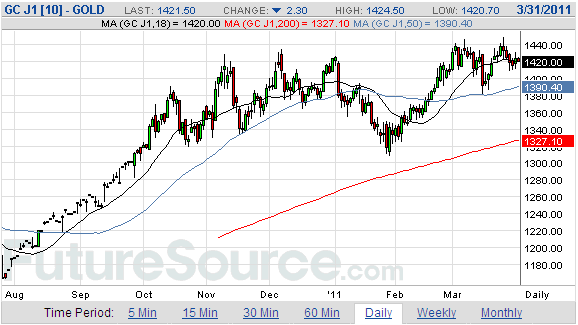
In this week's email
alert we emphasised that for a move to new highs to remain the most
likely near-term scenario, the gold price should not close below $1380.
We want to point out, though, that while a break below $1380 would
almost rule out a near-term move to new highs, it wouldn't suggest to
us that a large decline had begun. In our opinion, a break below $1380
within the next couple of weeks would result in gold doing no worse
than dropping back to the low-$1300s.
The extraordinarily 'overbought' condition of the silver market remains
our biggest concern. Ideally, silver will remain extraordinarily
overbought for at least a few more weeks before succumbing to 'market
gravity', but in the mean time we continue to like the strategy of
hedging our precious metals exposure by scaling into SLV July put
options as silver rises.
Gold Stocks
If gold breaks out to the upside in the near future, the HUI will
probably do the same. As noted in the latest Weekly Update, a break
above resistance at 580 would create a short-term chart-based target of
around 670 for the HUI.
Nearby support extends from 550 down to 540, but if this support were
breached over the days ahead it wouldn't mean that a major decline had
begun. Instead, it would probably mean that the HUI was on its way back
to the low-500s.
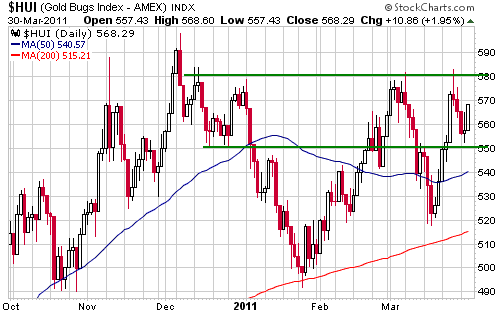
Our view is that the
HUI is more likely to break above resistance at 580 than below support
at 540-550. If it does break out to the upside and move sharply higher
then we will take advantage by doing some selling.
Currency Market Update
The deluge of new money created out of 'thin air' by the Bank of Japan
(BOJ) has had the desired effect and pushed the Yen down to the bottom
third of its 6-month trading range against the US$.
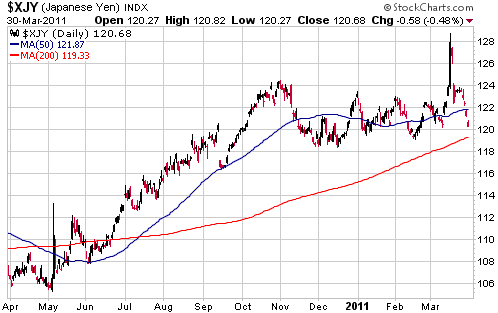
Will the BOJ continue
to inflate by enough to offset the upward pressure on the Yen's
exchange value stemming from the capital repatriation that will take
place to finance earthquake-related insurance payments and
reconstruction?
Nobody knows. Given its unlimited ability to create new Yen, the BOJ
certainly has the ability to prevent Japan's currency from rising in
response to market forces. The question is whether it will choose to
make full use of this ability over the months ahead.
In the past the BOJ was one of the most cautious of the world's central
banks when it came to inflating the money supply, but we doubt that
this was due to the BOJ decision-makers having a superior understanding
of the negative effects of monetary inflation. There has been no
evidence of such intellectual superiority in the official statements
put out by the BOJ over the years. Instead, like their counterparts at
the Fed the central planners at the BOJ appear to be labouring under a
hotchpotch of ill-conceived Keynesian and Monetarist theories.
One possible explanation for the BOJ's relative prudence on the
monetary inflation front is that the Japanese government has, up until
now, been able to finance its aggressive spending at low interest rates
using the population's existing monetary savings. But that method of
financing the deficit appears to have gone about as far as it can go,
so perhaps we'll see the BOJ becoming more Bernanke-like in the future.
This would be bad for Japanese Government Bonds, but good for the
Yen-denominated prices of Japanese equities.
We'll see. We are long-term bearish on the Yen because Japan's
government will have to resort to rampant monetary inflation within the
next few years to avoid directly defaulting on its debts, but we
haven't given up on the idea that there will be a final Yen rally
spurred by earthquake-related capital repatriation.
Update
on Stock Selections
(Notes: 1) To review the complete list of current TSI stock selections, logon at http://www.speculative-investor.com/new/market_logon.asp
and then click on "Stock Selections" in the menu. When at the Stock
Selections page, click on a stock's symbol to bring-up an archive of
our comments on the stock in question. 2) The Small Stock Watch List is
located at http://www.speculative-investor.com/new/smallstockwatch.html)
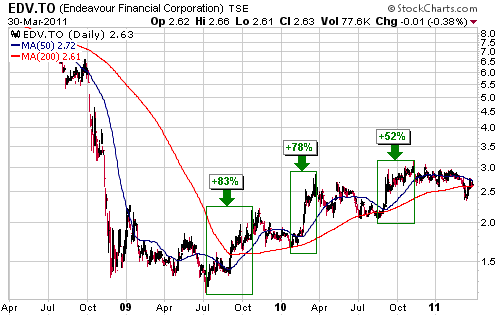
 Endeavour Mining (TSX: EDV). Shares: about 125M. Recent price: C$2.63 Endeavour Mining (TSX: EDV). Shares: about 125M. Recent price: C$2.63
We removed EDV from the TSI Stocks List some time ago, but retained
some exposure to this company via the warrants (TSX: EDV.WT.A).
Whether or not EDV makes its way back into the TSI Stocks List in the
future will depend on what the company does with its $200M cash hoard.
It is currently under-valued and offers exposure to gold via its
80K-oz/yr Youga mine in Burkina Faso, but because cash constitutes
about half of its net asset value it doesn't offer as much leverage to
gold as we'd like.
As we've mentioned in the past, we think it would make sense for EDV to
use its cash to make a stock-plus-cash bid for Resolute Mining (ASX:
RSG). RSG is under-valued and would make a good fit with EDV's West
African assets. Following a successful bid, RSG's non-African assets
could be sold off or spun off to make the expanded EDV an
Africa-focused mid-tier producer with a strong balance sheet. This
would likely lead to a substantial upward re-rating in the stock market
that would benefit all shareholders.
Although we aren't going to return EDV to the List at this time, we
wanted to point out that it is a relatively low-risk buy near the
current price. This is not only due to the low valuation and strong
balance sheet, but also due to the stock chart.
The chart (see below) shows that EDV has trended upward over the past
two years via a "two steps forward followed by one-and-one-half steps
backward" process. The rallies have generated trough-to-peak gains of
83%, 78% and 52%, while the intervening downward corrections have taken
the stock price to just below its 200-day moving average. There's a
good chance that the stock's most recent correction ended in the
C$2.30s earlier this month.
Consecutive daily closes above the 50-day moving average (currently
C$2.72) would suggest that the next "two steps forward" rally had
begun. If the next rally results in a trough-to-peak gain of 52%-83%
then it will end at C$3.50-C$4.30.
With a market cap of only $12M at Wednesday's closing price of C$0.37
and average daily turnover in its shares of only $30K, First Mexican
Gold (TSXV: FMG) is way too small and illiquid to be considered for the
TSI Stocks List. However, it is an interesting little company and is
included in the TSI Small Stocks Watch List (SSWL). It is interesting due to the drilling results achieved to date at its project in Mexico.
It doesn't take much selling or buying to move the price of a stock
such as FMG. Consequently, a lack of news can push the price down --
and thus create a buying opportunity -- by causing small traders to get
bored and dump their holdings onto the market.
For speculators who are comfortable with small, early-stage resource
stocks, the recent lack of any new drilling results has created an
opportunity to accumulate FMG shares 'on the cheap'. Drilling work has
recommenced and results should trickle in over the coming 2 months.
A
company called Norton Gold Fields, which trades in Australia under the
symbol NGF and operates gold mines and a mill in the Kalgoorlie region
of Western Australia, came to our attention earlier this week. We
haven't had a chance to take a detailed look at it yet, but our
preliminary investigation suggests that it has speculative merit. In
fact, in terms of enterprise value relative to annual gold production
it is by far the cheapest 100K+ oz/yr gold miner that we know of.
NGF is currently producing gold at the rate of about 155K ounces per
year. This production is unhedged, profitable, and at the 31st March
closing price of A$0.17/share is being valued by the market at only
$1175/oz (taking into account net debt of $64M). By way of comparison,
we aren't aware of any other gold mining stock with more than 100K
ounces/year of current production that is being valued by the market at
less than $2000 per ounce of production.
A possible explanation for the incredibly low valuation is that the
market expects the production rate to fall. NGF appears to have enough
in-ground resources in the vicinity of its mill to produce 150K
ounces/year for at least the next 10 years, but maintaining this
production rate will involve bringing new mines on line.
At this stage we are presenting NGF as a speculating idea that you
might want to check out. Also, if you know why this stock is so cheap,
we'd greatly appreciate it if you could fill us in.
Chart Sources
Charts appearing in today's commentary
are courtesy of:
http://stockcharts.com/index.html
http://www.futuresource.com/

|