|
- 30 May 2001
The US
Stock Market
An inflationary tide lifts all boats
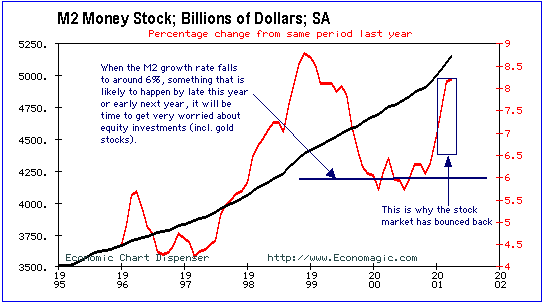
Below is a chart showing (in red) the
year-over-year %-change in M2. If we had to pick one single reason for
the strength of the US stock market from early-April until late-May, this
chart would be it. Furthermore, there is a good chance that the money supply
growth that has already occurred will underpin the stock market for several
more months and lead to an increase in consumer spending during the final
few months of this year.

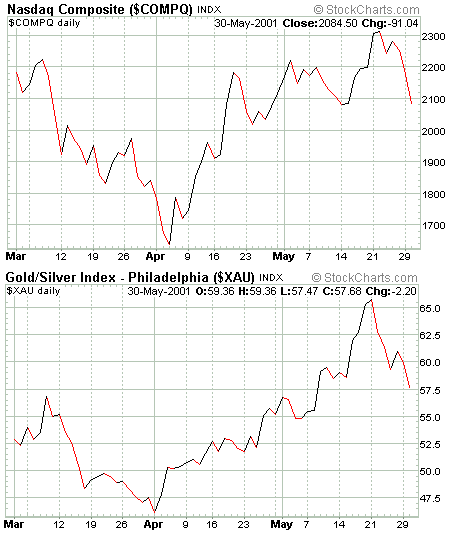
Below are charts of the NASDAQ Composite
and the XAU since the beginning of March. Notice how the two have been
moving together over the past 2-3 months. More often than not, gold stocks
move counter to the overall stock market so the recent action is unusual,
but not unprecedented. Our thinking is that an inflationary tide is, essentially,
lifting all boats. However, some boats - the ones that benefit directly
from higher inflation - are being lifted higher than others. This is quite
similar to what happened during the 12-month period leading up to the 1987
stock market crash.

Unlike the inflationary tide that swept
across the US economy in 1998 the current one is having a different effect
because, this time around, there is no 'slack' in the economy. There is
now a chronic energy shortage due to decades of under-investment in energy
infra-structure and this shortage is keeping energy prices at a much higher
level than they would otherwise be during a period of slow economic growth.
Also, consumer prices and labour costs are rising at their fastest rates
in many years. This is why it has, to date, been the stocks of companies
that benefit the most from a depreciating currency that have gained the
most as a result of the friendly monetary environment.
We expect the monetary environment
to remain friendly for at least a few more months and that this tide of
money will continue to support all asset prices.
If the experiences of the past 2 years
are anything to go by then the time to get very concerned about the stock
market (all stocks, including gold stocks) will be when the M2 growth rate
falls to around 6%. Unless the extremely unlikely happens and bonds exceed
their March highs over the next few months, the M2 growth rate should begin
to decline by August and be approaching the danger level by late this year
or early next (refer to the Apr-16 WMU for a chart showing that the bond
market, not the Fed, is the single greatest influence on the money-supply
growth rate).
Current Market Situation
The "hey, the Fed's doing the right
thing and the economy is sure to recover soon" rally ended last week.
Now we are into the "oh dear, maybe things are even worse than expected
and all the easy money in the world is not going to help us" correction.
This correction will then be followed by the "to hell with this year,
the Fed is still on our side and things will be great next year" rally
(probably the final rally in the cyclical bull that commenced in late-March/early-April).
It looks like we managed to exit our
QQQ positions right at the peak early last week. Of course, it would have
been nice if we had sold everything else at the same time, but unfortunately
our foresight is never as clear as our hindsight.
A bottom of the very short-term variety
is likely to occur during the next couple of days, but we doubt that any
low that is reached this week will be sustainable. We expect that this
correction will continue for at least another 2 weeks, but that the major
indices will handily exceed their recent peaks during the next few months.
Gold and
the Dollar
The only viable alternative
We've said on several occasions in
the past that gold represents the only viable alternative to the US$. By
this we meant that the Dollar's major competitors in the fiat currency
world suffer from the same ailments as the Dollar - they all come into
existence through the expansion of credit and are thus someone's liabilities.
They are as good as a politician's promise not to over-spend or a banker's
promise not to over-lend. Choosing between fiat currencies is therefore
like choosing whether you'd prefer to be eaten by a crocodile or by a shark.
There is, however, another reason that
gold is by far the best alternative to the US$ - its supply is essentially
fixed meaning that as overall demand increases its price must rise. Supply
cannot be arbitrarily increased to satisfy a greater demand. This is in
marked contrast to the fiat currencies of the world, the supply of which
can be expanded at will. If one of the national currencies should happen
to appreciate against the Dollar then the suppliers of that currency can,
and almost certainly will, increase the quantity of the currency in an
attempt to maintain a strongly-positive trade balance with the US. For
example, although the ECB and the euro-zone governments are no doubt unhappy
with the euro's plunge below US$0.90, we suspect that they would act aggressively
to reduce the euro's relative value (by increasing its supply or reducing
its price) if it should ever move well above parity with the Dollar (as
it is likely to do over the next 6 months).
The suppliers of gold do not have the
option of responding to increased demand with a corresponding increase
in supply. Newly-mined gold supply will add no more than 1.5% per year
to the total above-ground gold stock for at least the next few years, regardless
of how high the gold price goes (it takes years to bring new production
on line).
Gold versus Gold Stocks (the Gold/XAU
Ratio)
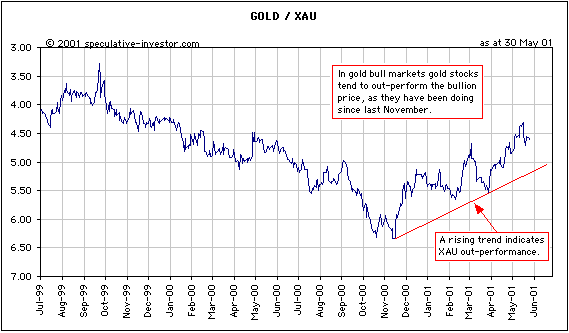
A characteristic of a gold bull market
is that gold stocks consistently out-perform the bullion price. This occurs
because the profits of gold mining companies are leveraged to the gold
price (some of them are, anyway), so if the gold price is expected to be
higher in the future than it is today then a disproportionately-large increase
in profits will be factored into gold mining company stock prices. The
Australian company Lihir Gold (LHG) provides an excellent example of such
leverage. According to a recent report by Johnson Taylor Potter, a $10
increase in the spot gold price will result in a 42% increase in LHG's
earnings for the year 2002.
Below is a chart of the Gold/XAU ratio
(with the scale reversed so that the line rises when the XAU out-performs
the gold price). If a gold bull market has begun then the up-trend shown
on this chart should remain in tact.

The resilience of gold stocks in the
face of the recent plunge in the gold price might be the result of delusional
thinking on the part of equity investors, or it could be the result of
equity investors presciently looking beyond today's commodity-price fluctuations.
Based on a) what we think is about to happen in the currency market, and
b) what continues to happen with the supply of Dollars, equity investors
will most likely be proven correct.
Current Market Situation
Over the past few weeks we've said
that a test of the Dollar Index's October 2000 high was a distinct possibility
before a substantial decline got underway. The Dollar is now in the process
of completing such a test. We would actually be more confident that an
important peak was in place if the Dollar Index spiked above its October
2000 intra-day high of 118.90 over the next few days before reversing lower.
We've noted, in the past, that:
a) A gold rally in the face of a strong
Dollar was/is a very low probability event.
b) If the Dollar moves to decisive
new highs, then any gold rally will probably be another unsustainable spike.
c) Gold equities have been moving higher,
without much support from the gold price, in anticipation of a lower
Dollar.
At some point in the future we expect
that gold will de-couple from the Dollar as people panic out of all fiat
currencies. However, we are presently nowhere near that point of mass-realisation.
We continue to be bullish on gold and gold stocks because we expect the
effects of inflation to become more obvious over the months ahead and because
we expect a Dollar decline to commence very soon.
In the latest WMU we included a chart
of the XAU and noted that support in the 55-57 range should hold on any
near-term pullbacks. Although the gold price itself has fallen further
than we had anticipated (we had thought that gold would consolidate in
the 270-280 range for 1-2 weeks), the XAU is just approaching the top of
its support band.
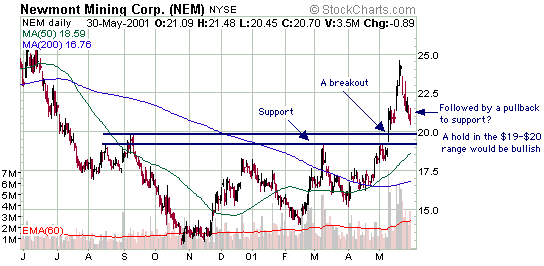
Below is a chart of Newmont Mining
(NEM), which provides a good example of the pattern being followed by the
XAU and a number of individual gold stocks. NEM appears to be pulling back
in a test of its previous breakout.

In summary, although the gold price
has fallen sharply we have seen nothing over the past week that would cause
us to deviate from our bullish view of the gold market. In particular,
the trend of gold stocks out-performing the gold price is still very much
in tact. A fall in the Dollar, something we expect to begin very shortly,
continues to be the key to a sustainable gold rally.
We wanted to discuss the traders' commitments
again in today's Update, but have run out of time so we'll do it in the
coming Weekly Update.
Changes
to the TSI Portfolio
HTA (Hutchison Telecom, an Australian
mobile phone company), was stopped out. There are clearly one or two large
sellers that want out of this stock at any price and it is also suffering
from tax loss selling (June 30 is the end of the Australian tax year).
We may re-purchase it after we see some evidence that the selling has been
exhausted.
We are going to add two new resource
stocks - Mount Isa Mining (ASX: MIM) at A$1.24 and Crew Development Corp
(TSE: CRU) at C$1.15. We will explain why in the next WMU.

|

