|
- Interim Update 30th June 2009
Copyright
Reminder
The commentaries that appear at TSI
may not be distributed, in full or in part, without our written permission.
In particular, please note that the posting of extracts from TSI commentaries
at other web sites or providing links to TSI commentaries at other web
sites (for example, at discussion boards) without our written permission
is prohibited.
We reserve the right to immediately
terminate the subscription of any TSI subscriber who distributes the TSI
commentaries without our written permission.
TSI Schedule Change
This
report has been posted a day earlier than originally scheduled. This is
partly because public holidays in both the US and Canada (the US
markets will be closed on Friday and the Canadian markets will be
closed on Wednesday) mean that there will be less trading than usual
during the second half of the week, and partly because we didn't
publish a Weekly Update at the beginning of the week.
California
The US federal Government has been spending far more than it earns
(steals) for a very long time, and, as a result, the amount of its debt
is now close to the entire nation's GDP. Moreover, its debt is
expanding at an accelerating pace. And yet, it has no difficulty
finding buyers for its bonds at low single-digit interest rates. Nor is
it concerned enough about its financial predicament to seriously
contemplate cutting back on its expenses. On the contrary, it is
rapidly increasing its expenses.
The federal government can act the way it does and still find eager
buyers for its debt because its access to money is, in effect,
unlimited. Regardless of how burdened with debt its balance sheet
becomes, the US federal government will always have access to the
Federal Reserve's "printing press". It will therefore never be in the
position where it is forced to directly default on its obligations.
State governments, however, do not have the power to expand their
obligations ad infinitum. A state government that consistently spends
more than it rakes in can end up in the position of having to cut back
on its expenses and/or directly default on its debt. This is the
position in which the government of California now finds itself.
California's government has essentially run out of cash and is facing a
$24B deficit over the coming fiscal year. Unlike the market for US
Treasury Bonds, the market for bonds issued by the State of California
is limited by the general perception of the State's ability to generate
sufficient revenue in the future to cover interest and principal
payments as they become due.
We aren't experts on California's financial situation, but detailed
knowledge is not required to understand that one or a combination of
the following is going to happen:
1. In an effort to bring its expenses into line with its income, the
government of California will shrink in size by eliminating some
state-run operations and by making others more efficient.
2. The government of California will sell-off some of its assets.
3. There will be increases in state taxes and other charges.
4. There will be a bailout by the federal government.
Given that the federal government has already bailed out private
financial corporations and auto companies, a federal bailout of
California -- which would amount to giving California's state
government access to the Fed's printing press -- is a likely outcome.
With regard to bailouts it's important to understand that the federal
government doesn't have surplus financial resources that can be drawn
upon to support troubled corporations and state governments; rather,
the bailouts involve the diversion of resources from some parts of the
economy -- via taxation, borrowing, or monetary inflation -- to other
parts of the economy. It's all about robbing Peter to pay Paul in the
hope that Paul will return the favour at the next election while Peter
won't realise, until much later, that he has been robbed.
California's economy is bigger than the economies of all except the
largest countries, so bailing out the government of this state would
likely require a huge amount of new money. Furthermore, a California
bailout would set a precedent in that it would be hard to justify
federal assistance to one state and deny it to another state that
happened to be in a similar predicament. Consequently, if the US
federal government chooses to use its unlimited powers of money
creation to bail out California's state government it will constitute
another hefty blow to the overall US economy and put another nail in
the coffin of the deflation thesis.
Bond Market Update
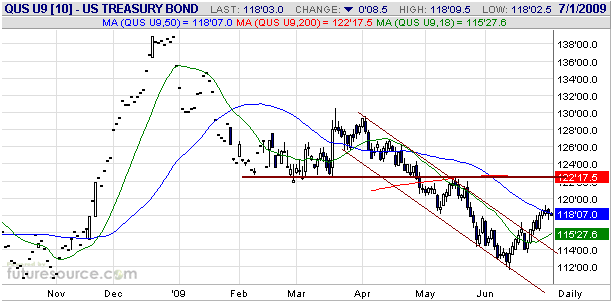
By breaking above
resistance defined by the downward-sloping channel drawn on the
following daily chart, the September T-Bond futures contract has
provided preliminary evidence that an intermediate-term bottom is in
place. More important resistance lies at 122.50.
Although we are short- and intermediate-term bullish on T-Bonds we will
be surprised if resistance at 122.50 is decisively breached within the
next few weeks. Based on the way previous intermediate-term bottoms
have formed in this market it is likely that the aforementioned
resistance will limit the initial rally from the June low, and that the
June low will be tested prior to the start of a multi-month upward
trend.
The Stock and Commodity Markets
Shades of 2008
The performances of the stock and commodity markets over the past
several months have been remarkably similar to their performances
during the same period of last year (although at much lower price
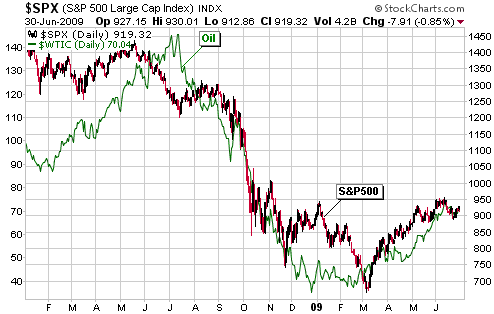
levels, of course). To illustrate what we mean we have included, below,
a chart comparing the S&P500 Index (SPX) with the oil price. With
reference to this chart, notice that oil began to power upward in
February of 2008 and was later joined in its upward journey by the SPX.
The SPX subsequently peaked in May while the oil price continued to
defy gravity until July, after which both markets plunged in unison. As
was the case last year, oil began to rally in February of this year and
was joined the following month by the SPX.
There are tentative signs that the SPX's rebound is over, but there is
not yet any evidence that the oil market has reached its ultimate
rebound peak. If the similarities with last year persist then oil
should peak during July.
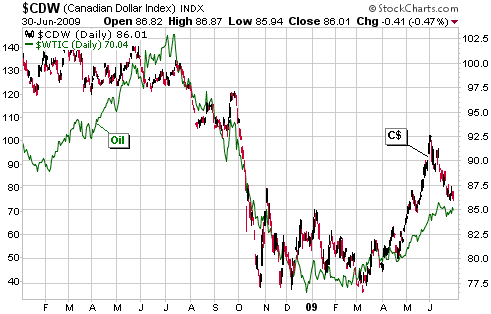
The correlation
between the stock and commodity markets evident on the above chart
extends to the currency market. In particular, the following chart
reveals a positive correlation between the Canadian Dollar and the oil
price.
It is not surprising, or even especially interesting, that an
intermediate-term positive correlation has existed between the oil
price and the currency of a major oil producer (Canada). Of greater
interest is that the C$ has tended to LEAD the oil price at
intermediate-term turning points over the past couple of years. For
example, the C$ turned down well ahead of the oil price during May-July
of 2008 and turned up well ahead of the oil price during the final
quarter of 2008. This lead-lag relationship suggests that oil should
peak within the next few weeks IF the C$ peaked at the beginning of
June (we think it did).
There's a good chance
that the inter-market relationships that have been in force over the
past 1-2 years will remain in force over the coming months. In other
words, if intermediate-term peaks are in place for the SPX and the C$
then an intermediate-term peak for the oil market is probably either in
place or close at hand. However, we don't think it is reasonable to
expect that this year's market action will continue to mimic last
year's. There are two reasons for this:
First, we do not have the sentiment extremes today that we had at this
time last year. For example, during June-July of 2008 the Market Vane
bullish percentages for many commodities, including oil, copper, and
natural gas, were in the 80s or 90s, whereas they are currently all
well below 50 (oil is at 39, copper is at 45 and natural gas is at 22).
Furthermore, at around this time last year the bullish percentage for
the Dollar Index was in the 'teens', whereas it is presently 50. In
other words, while market sentiment was extreme at around this time
last year (the financial world was exuberantly bullish on all things
commodity-related and frothing-at-the-mouth bearish on the US$), today
it is neutral.
Second, history never repeats itself in such a predictable manner
because the nature of markets is to keep the majority of participants
guessing most of the time. By way of further explanation, if the
markets continue to follow last year's pattern for another month or so
then a lot of people will begin to anticipate a repeat of the
September-November crash, which, ironically, will preclude such an
outcome because markets never crash when the majority is prepared for a
crash. To put it another way: when the public positions itself for a
particular market outcome it changes (lowers) the probability of that
outcome.
Our view is that the downside risks for the stock and
industrial-commodity markets exceed their upside potential by a
sizeable margin on both a short- and intermediate-term basis, but aside
from not expecting the sort of drama that occurred during the second
half of last year we don't pretend to know the paths that these markets
will follow over the months ahead.
Gold and
the Dollar
Gold
The most recent Commitments of Traders (COT) report showed a total
speculative (large speculators + small traders) net-long position in
COMEX gold futures of 195K contracts. Although this is about 30K less
than at the early-June peak and about 60K less than at last year's
peak, it is still quite high. In the gold market the speculators are
usually correct about the intermediate-term trend, but when they become
very positive about gold's prospects the short-term downside risk
increases due to the potential for a price decline to be magnified by
the liquidation of speculative long positions.
In our opinion, a likely outcome is that gold's performance over the
next few months will be a less-dramatic version of what happened during
July-October of last year. It's a good bet that many speculative long
positions in the gold futures market are predicated on expectations of
US$ weakness, so if the US$ defies these expectations and begins to
trend higher then some gold 'longs' will run for the exit. As a result
and as was the case last year, the INITIAL leg of a US$ rally will
probably be accompanied by weakness in the gold price. It's unlikely
that the weakness will be anywhere near as pronounced as last year,
though, because gold's performance from November-2008 through to
February-2009 proved that in times of stress the dollar's foreign
exchange value is not the dominant influence on the gold market, and
because the next round of market-wide de-leveraging should be less
frenetic than the previous round.
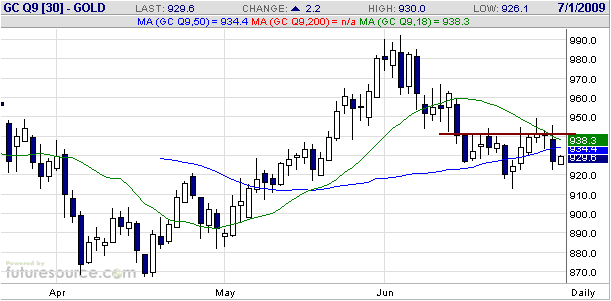
Turning to the short-term price action, the following daily chart of
August gold futures shows that the rebound of the past week was capped
by the 18-day moving average and resistance at $940. A solid daily
close above $940 would project a move up to around $980 while a daily
close below $915 would project a move down to around $880.
We suspect that gold will remain within the $880-$980 range over the next 1-2 months.
Gold Stocks
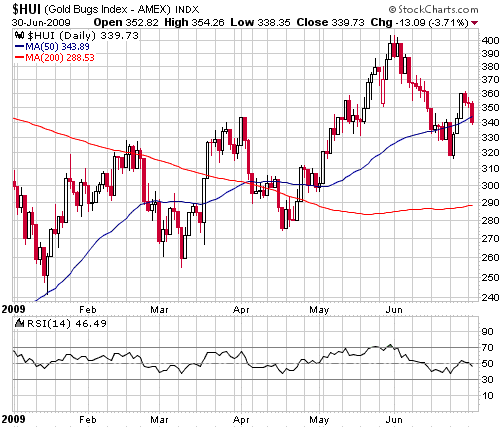
In last week's Interim Update we said: "The
most likely short-term outcome continues to be that the HUI will
rebound for a few weeks, retracing 50%-70% of its preceding decline in
the process, before dropping back to the vicinity of its 200-day moving
average."
A 50%-70% retracing of the June decline would take the HUI back to
360-380. When it traded at 362 last Friday it had therefore already
achieved our minimum expectation in terms of price, but at that point
the rebound was only 4 days old. It would be unlikely for the rebound
to end that quickly, so the current pullback will probably be followed
by another move into the 360-380 range. This would, we think, set the
stage for the second -- and likely final -- downward leg in the
correction that began on 1st June.
We continue to
believe that the gold sector will gain a lot of ground over the next
few years and that investors should therefore look for opportunities to
buy gold stocks near their 200-day moving averages over the next two
months. Specific buy zones for three of our favourites (MFN, NGD and
NXG) were noted in the 22nd June Weekly Update.
Currency Market Update
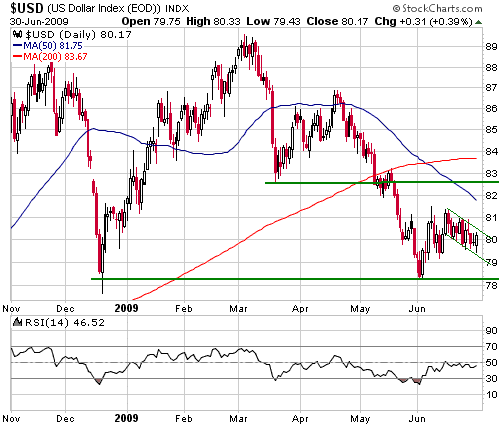
The following chart shows that the Dollar Index has support at 78 and
resistance at 82.5. The dollar's resistance at 82.5 is similar to the
T-Bond's resistance at 122.5 and probably won't be surmounted during
the initial rebound from the June low.
We use the Baltic Dry
Index (BDI), an index of ocean freight rates, as an intermediate-term
currency market indicator. The reason is that important turning points
in the BDI tend to coincide with, or follow, important turning points
in the US dollar's exchange value (BDI peaks tend to coincide with US$
troughs and BDI troughs tend to coincide with US$ peaks). This rather
strange relationship probably exists because investment gets drawn
towards the higher-growth regions of the world during periods when
global trade is on the rise, and then retreats to the perceived safety
of the US during periods when global trade is on the decline.
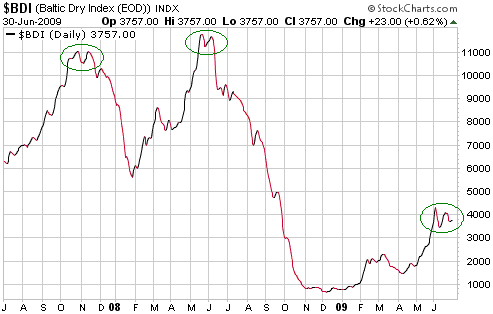
The BDI's current situation is quite interesting. As illustrated by the
following chart, it topped at the beginning of June and subsequently
tested its June peak. This opens up the possibility that a small
'double top' is in the process of forming, which is interesting because
similar price action occurred at the Q4-2007 and Q2-2008
intermediate-term peaks.
The BDI must now move below its early-June low to confirm a trend
change and support our view that the US$ has bottomed. Alternatively,
if the BDI moves above its June peak it will cast some doubt on our
bullish US$ outlook.
Update
on Stock Selections
(Note: To review the complete list of current TSI stock selections, logon at http://www.speculative-investor.com/new/market_logon.asp
and then click on "Stock Selections" in the menu. When at the Stock
Selections page, click on a stock's symbol to bring-up an archive of our comments on the stock in question)
 Red Hill Energy (TSXV: RH). Shares: 52M issued, 63M fully diluted. Recent price: C$0.50 Red Hill Energy (TSXV: RH). Shares: 52M issued, 63M fully diluted. Recent price: C$0.50
RH, an exploration-stage Mongolia-based coal miner, announced about two
weeks ago that it had arranged to sell its Ulaan Ovoo coal project for
US$30M (C$34M), with the money to be paid in stages over a few years.
In our opinion this is a reasonable deal. It provides the company with
more than enough cash to fund its exploration activities for a long
time to come without diluting the stock, and leaves the company with
the massive in-ground coal resources (819M tonnes in the
measured-and-indicated category) at its Nyalga coal basin projects.
Moreover, the agreed sale value for Ulaan Ovoo is more than RH's
current market capitalisation.
In the 11th May 2009 Weekly Update we wrote:
"RH would be a reasonable
speculation below C$0.50/share, but in the current environment and at
current share prices we prefer exploration-stage uranium miner Khan
Resources (TSX: KRI) to RH. We are comparing RH to KRI because both
companies operate in Mongolia, a high-risk country. We prefer KRI to RH
at current prices because KRI has a much stronger balance sheet (a lot
more cash) and because we are more bullish on uranium than coal."
Although RH's balance sheet will be strengthened when the recent deal
is consummated, we continue to prefer KRI because we are much more
bullish on uranium than coal. However, given that the stock market is
now valuing RH's 820M tonnes of in-ground coal at less than zero it is
clear that the stock's upside potential is vastly greater than its
downside risk.
Chart Sources
Charts appearing in today's commentary
are courtesy of:
http://stockcharts.com/index.html
http://www.futuresource.com/

|

