|
- Interim Update
30th July 2014
Copyright
Reminder
The commentaries that appear at TSI
may not be distributed, in full or in part, without our written permission.
In particular, please note that the posting of extracts from TSI commentaries
at other web sites or providing links to TSI commentaries at other web
sites (for example, at discussion boards) without our written permission
is prohibited.
We reserve the right to immediately
terminate the subscription of any TSI subscriber who distributes the TSI
commentaries without our written permission.
Gross
Output
For those desiring a measure of total
economic activity, there is an alternative to Gross Domestic Product
(GDP). It's called Gross Output (GO).
An alternative measure of total economic activity could be worthy of
consideration, because as an economic indicator GDP is worse than
useless. This is firstly because it measures spending without
differentiating between productive and unproductive spending, which
means that an increase in GDP doesn't necessarily indicate economic
progress (although that is exactly what almost everyone thinks it
indicates). Secondly, GDP doesn't cover all spending; instead, it is
primarily a measure of final sales to consumers and government
spending. Consumer spending is therefore a much larger percentage of
GDP than of the overall economy, which is not a problem in itself
but becomes a problem when almost everyone believes that GDP
measures the overall economy. Thirdly, the spending omitted by the
GDP calculation (the spending of all businesses involved in the
intermediate stages of production) is the spending carried out in
the parts of the economy where most people are employed.
GO is a more useful statistic than GDP, because it includes the
intermediate stages of production. Consumer spending is therefore
not over-weighted by anywhere near as much in GO as it is in GDP.
Specifically, consumer spending is almost 70% of GDP and less than
40% of GO.
Also, because GO is not dominated by the most stable component of
total spending (consumer spending varies less than the other
macroeconomic spending categories), it is better than GDP at
reflecting the economic cycles. For example, whereas US GDP never
contracted by more than 2% in response to the 2008-2009 financial
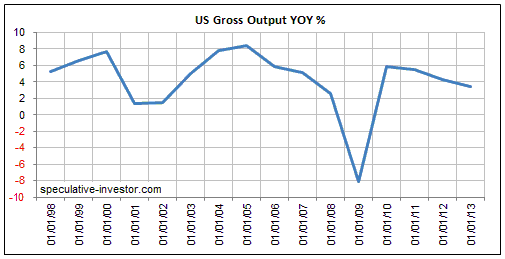
crisis and global recession, the chart displayed below shows that
the year-over-year rate of change in GO plunged from +5% in 2007 to
-8% in 2009. This is clearly a better reflection of what actually
happened to the US economy.
Unfortunately, GO, like GDP, fails to differentiate between
productive and unproductive spending and is therefore not a good
measure of real economic progress.
By the way, GO is not a new concoction. We first mentioned it about
5.5 years ago (in the 7th January 2009 Interim Update) and it has
been around for much longer than that. What's new is that until
recently GO was only updated annually with a lag of more than 12
months, but it is now being updated quarterly with a lag of about 4
months. The quarterly figures are posted
HERE.
As a practical tool for speculating or investing, GO is just as
irrelevant as GDP. We therefore won't be spending a lot of time
analysing GO data. However, the GO numbers provide a more accurate
historical tally of monetary spending throughout the economy, so the
fact that these numbers are now being published in a more timely
manner and becoming more widely known is a small step in the right
direction.
The Stock Market
The "Emerging Markets"
The emergence of our positive outlook for "Emerging Market" equities
We began this year thinking that "Emerging Market" equities, as represented by
EEM, were close to the end of a cyclical bear market, but that there could be a
final wash-out decline in 2014 to end the bear. Due to the potential for this
wash-out decline, during the first two months of the year we were interested in
making short-term bets against emerging-market equities.
For example, in the 24th February Weekly Update, we wrote:
"The potential exists for a sharp decline in EEM to the low-$30s. That's the
reason for our short-term bearish speculation. On a longer-term basis, the trend
that entails relative weakness in the emerging markets is now very old and is
probably going to end within the next several months. It seems that almost
everyone is now bearish on the emerging markets. While such a sentiment backdrop
doesn't preclude a final washout, it sets the stage for the emerging markets to
become leaders to the upside during the next global equity-market advance."
By late March, however, EEM's performance relative to the SPX was signaling that
the risk of EEM experiencing a final wash-out decline had receded. For example,
this is from the 26th March Interim Update:
"...over the past two trading days the EEM/SPX ratio broke out to the upside
from the well-defined channel that had limited its movements since October-2013.
We take this as an early warning that even if EEM's bear market is not complete,
it could be about to strengthen relative to the US stock market for at least a
couple of months."
A few days later (in the 31st March Weekly Update), we wrote:
"As is the case with commodity-related equities, signs are beginning to
appear that emerging-market equities are shifting from relative weakness to
relative strength. Last week, for instance, EEM broke above well-defined
resistance at $40 and the EEM/SPX ratio had its best week since the third
quarter of last year. From a fundamental perspective the recent strength in EEM
makes less sense than the recent strength in CRX [the Commodity-Related Equities
Index], but it isn't uncommon for the obvious fundamentals to lag at important
turning points for market prices."
After two more weeks went by there was additional evidence that an important
trend change was in the works, prompting us to write:
"While a large and sharp decline to end EEM's bear market remains a realistic
possibility, EEM's resilience in the face of the recent weakness in the US stock
market suggests that it isn't the most likely scenario.
We currently aren't inclined to bet on any particular short- or
intermediate-term outcome for the emerging markets, but if we were forced to
state a conclusion it would be: the emerging-market bear is dead and a decline
by EEM to around $39 is the worst that will happen over the months ahead."
Finally, in the 14th May Interim Update we reviewed the positive long-term
correlation between emerging-market equities and commodities, concluding that:
"...EEM should perform well over the next couple of years if we are right to
believe that commodities, as a group, are in the process of turning higher on a
long-term basis. We are well aware that the economic fundamentals do not suggest
that the recent relative strength in emerging-market equities will be sustained
beyond the very short-term, but if the upward trend in commodity prices is set
to continue then additional relative strength in emerging-market equities is a
high-probability bet."
In the 14th May Interim Update we also discussed the Russian stock market's
tendency to act like a leveraged play on the emerging-market and commodity
themes. This tendency suggested that short-term downward pressure put on Russian
equities by Ukraine-related fear, including economic sanctions, would create
good opportunities to average into the Market Vectors Russia ETF (RSX) for an
intermediate-term (6-18 month) trade.
EEM, China and Coal
The following chart compares EEM with the EEM/SPX ratio. Notice that EEM spent a
few years oscillating within a wide range while the EEM/SPX ratio trended
relentlessly lower. EEM's wide trading range could be part of a major topping
pattern, but it now looks more like a long-term consolidation.

SSEC, a proxy for China's stock market, has broken out to the upside from an
18-month basing pattern. This suggests that an intermediate-term upward trend is
now in progress.
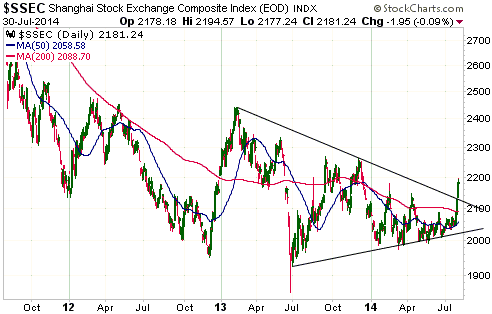
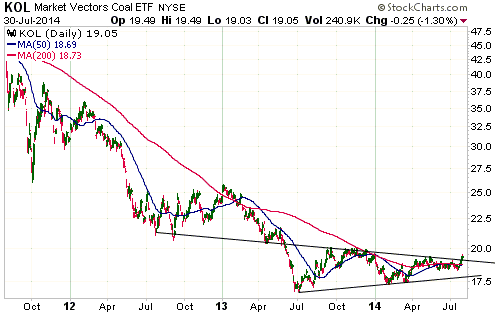
This week's upside breakout in China's stock market was accompanied by an upside
breakout in the Market Vectors Coal ETF (KOL). However, KOL's upside breakout is
marginal at this time. A weekly close above $20.00 is needed to confirm the
reversal.
The US
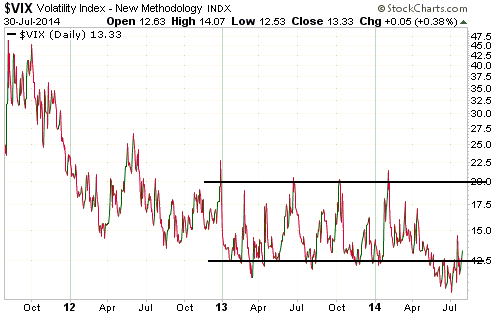
With regard to the US stock market's performance over the past three days, the
only development worth noting is that the Volatility Index (VIX) appears to have
reversed upward. This confirms the potential for a quick move in the VIX to
around 20, which could only happen in response to a sharp pullback in the S&P500
Index.
Gold and the Dollar
Gold
Gold, the Ukraine and Russia
It is still not known how MH-17 was shot down, or by whom. As far as we can
tell, the
weight of evidence currently points to the Ukraine military having caused
the event, either accidentally or as a "false
flag" designed to increase international pressure on Russia and Russian
separatists. If it was a "false flag" then it has been very successful, because
despite a complete lack of credible evidence to support claims of Russian
involvement, the event has led to more stringent economic sanctions against
Russia.
Regardless of where the truth lies, continuing to ramp-up the pressure on Russia
via economic sanctions will have negative economic consequences for "the West"
as well as for Russia. This could mean that cooler heads will prevail before too
long, but there is definitely a risk that the efforts to put pressure on Russia
will undermine Western economies that are already in weakened states due to many
years of destructive central bank policy. If so, the fundamental backdrop will
become more bullish for gold.
Current Market Situation
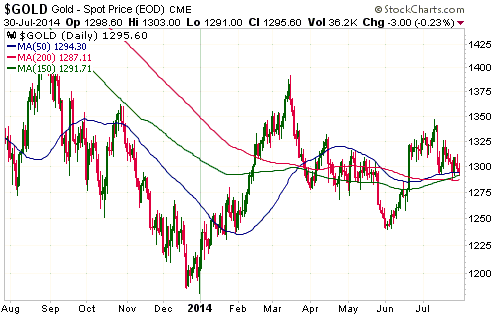
We suspect that gold made its correction low when it traded at $1287 on 24th
July, but it hasn't moved high enough to provide definitive evidence that this
is, indeed, the case. As previously advised, it needs to achieve a daily close
above $1325 to clearly signal an end to the correction that began about three
weeks ago. The fact that it hasn't yet done this leaves the door open to a final
downward spike to a new multi-week low.
Gold's upward trend will probably resume within the next few days, with or
without a final downward spike to a new multi-week low.
Gold Stocks
There is still a risk that the HUI will spike down to around 225 before the
gold-mining sector's correction comes to an end. As illustrated by the following
chart, 225 is roughly mid-way between the 200-day and 50-day moving averages.
However, with or without such a downward spike the correction will probably end
within the next few days.
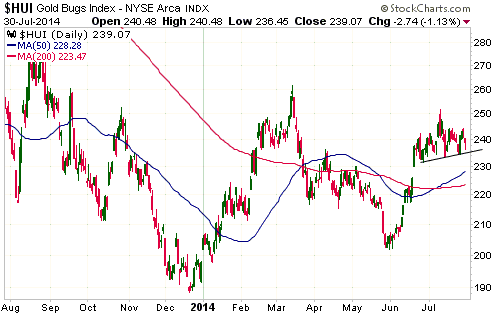
There are both fundamental and technical (price/chart related) reasons to
believe that the price weakness in the gold-mining sector over the past three
weeks is nothing more than a routine 2-4 week consolidation. From a fundamental
perspective, the backdrop for gold became definitively bullish in April of this
year for the first time since August of 2011. From a technical perspective,
notice the difference on the chart displayed above between the recent price
action and the price action immediately following the March top. Following the
March top the HUI quickly fell below its 50-day MA, whereas the HUI is currently
struggling to make it down as far as this MA. This tells us that prices are well
supported, with price weakness quickly attracting new buying.
The Currency Market
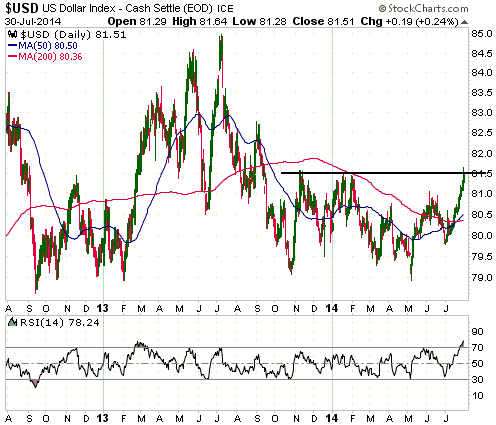
This is where it gets interesting. The Dollar Index is right at an
intermediate-term demarcation level. It is also now very 'overbought' on a
short-term basis and likely to soon reach a multi-week peak.
If the Dollar Index can end this week above resistance at 81.5 it will suggest
that an intermediate-term advance is underway. It would still likely be close to
a peak that holds for a few weeks, but a weekly close above 81.5 would mean that
the ensuing pullback was likely to retrace only part of the May-July rally and
be followed by a rally to new 18-month highs.
Alternatively, if the Dollar Index fails to end this week above 81.5, and
especially if it fails to end this week above 81.5 after spiking higher in a
knee-jerk reaction to 'bullish' employment news on Friday, it will maintain the
potential for an eventual decline to the low-70s.
Updates
on Stock Selections
Notes: 1) To review the complete list of current TSI stock selections, logon at
http://www.speculative-investor.com/new/market_logon.asp
and then click on "Stock Selections" in the menu. When at the Stock
Selections page, click on a stock's symbol to bring-up an archive of
our comments on the stock in question. 2) The Small Stock Watch List is
located at http://www.speculative-investor.com/new/smallstockwatch.html
Chart Sources
Charts appearing in today's commentary
are courtesy of:
http://stockcharts.com/index.html

|
