|
- Interim Update 30th August 2006
Copyright
Reminder
The commentaries that appear at TSI
may not be distributed, in full or in part, without our written permission.
In particular, please note that the posting of extracts from TSI commentaries
at other web sites or providing links to TSI commentaries at other web
sites (for example, at discussion boards) without our written permission
is prohibited.
We reserve the right to immediately
terminate the subscription of any TSI subscriber who distributes the TSI
commentaries without our written permission.
The property market, the stock market and the economy
...the financial markets do not appear to have gone very far towards
discounting the INDIRECT adverse effects of the real estate downturn.
...the Fed's response to the next major economic downturn, whenever it
occurs, will involve the large-scale creation of more dollars.
At around this time last year (in the 14th September 2005 Interim Update) we wrote:
"...while there appears
to be a lot more downside risk than upside potential in housing and
housing-related equities right now, the situation could be very
different 12 months from now. For example, if a recession combined with
a deflation scare were to take the average house price down by 10% and
the average homebuilding stock down by 40%, and if central banks were
to react to such a situation in the same way they reacted to the
2001-2002 downturn (it's a virtual certainty that they would), then by
this time next year the stage could well be set for another multi-year
upward leg in property-related investments."
Since that time the price of the average house has fallen by a few
percent and the average homebuilding stock has fallen by almost 50%.
Furthermore, most homebuilding stocks are now trading at close to book
value, which suggests that there isn't a lot of scope for additional
large declines within this sector of the market. So, is the worst over
for the US housing market?
We are tempted to say it is given that it is becoming difficult to find
any financial commentary or news service that isn't emphasising how bad
the residential property market is right now and how much worse it's
likely to get in the future. With the negatives now so well known and
dire forecasts everywhere isn't it reasonable to assume that the worst
is in the past?
The problem is, despite the carnage amongst the housing-related
equities the broad stock market has held up remarkably well and there
is scant evidence that a major economic downturn has begun. This is a
problem because it means that most of the knock-on effects of the real
estate downturn -- whatever they may turn out to be -- are yet to be
felt. Let's put it this way: we'd certainly be a lot more willing to
accept that the worst was in the past if, for example, the US economy
was officially in recession, the yield-spread had been in a strong
upward trend for several months, deflation fears were dominant,
low-quality debt had tumbled relative to higher-quality debt, the
copper price had fallen by around 50% from its May peak, the S&P500
Index was trading well below its June-2006 low, and the Fed had begun
to openly promote inflation in an effort to stem the tide.
As it is, the DIRECT adverse effects of major downturns in the
construction and sale of new homes have probably been almost fully
discounted in the prices of homebuilding stocks, but the financial
markets do not appear to have gone very far towards discounting the
INDIRECT adverse effects of the real estate downturn. And with the
housing boom having been such an important generator of US economic
activity over the past several years these indirect adverse effects
could be substantial. In particular, rising house prices have led to
increased spending throughout the US economy by making people feel
richer and, via home equity loans and cash-out re-financings, allowing
them to treat their homes as ATM machines. Take away this positive
force and things could get ugly.
We can't predict, with any real confidence, how ugly things are going
to get over the next 6-12 months or even if they are, in fact, going to
get lot uglier than they are right now. In any case, there's not a lot
to be gained by trying to predict how bad things are going to get. If
we make a guess and our guess proves to be close to the mark then we'll
have 'bragging rights', but rather than guessing it makes sense to
simply watch the stock market for clues.
There's an old saying that the stock market correctly forecasts seven
out of every two recessions -- an acknowledgement of the fact that many
of the stock market's gut-wrenching declines don't foreshadow anything
particularly bad as far as the economy is concerned. However, while the
stock market often cries "recession" when there is no recession on the
horizon, it never fails to turn down well ahead of an actual recession.
In other words, when used as a leading indicator of a major economic
downturn the stock market will provide many false positives, but no
false negatives. Therefore, let's not don the morose-coloured glasses
as long as the S&P500 Index remains above its June low.
One thing we can predict with immense confidence is that the Fed's
response to the next major economic downturn, whenever it occurs, will
involve the large-scale creation of more dollars. And as long as a
supernatural being doesn't repeal the laws of supply and demand we will
be prepared to bet heavily that when the Fed does, again, begin
inflating like crazy in an effort to overcome the problems caused by
previous Fed-sponsored inflation that it will, again, be successful in
lowering the value of the US$. This, as discussed in many previous
commentaries, is why it makes no sense to be long-term bearish on
NOMINAL house prices.
The Stock Market
An interesting chart that's making the rounds
We've included, below, a chart prepared by Merrill Lynch showing a
strong positive correlation between the NAHB Housing Index and the
S&P500 Index when the S&P500 Index is lagged by 12 months. If
the relationship depicted on this chart continues to work like it has
worked over the past 10 years then the US stock market is going to
trend relentlessly lower over the coming 12 months.
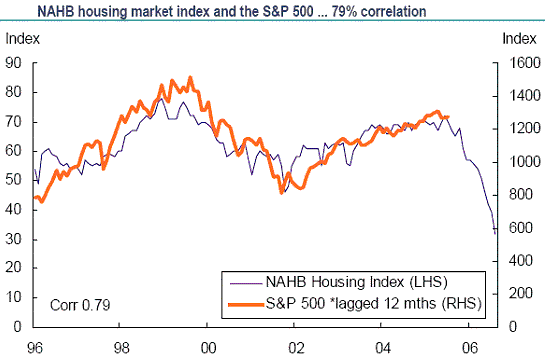
The above chart is
interesting and obviously has very bearish intermediate-term
implications, but even if the general relationship is still in effect
the chart doesn't tell us what to expect over the remainder of this
year. In particular, when constructing the chart the Merrill Lynch
analyst lagged the S&P500 Index by 12 months, no doubt because
doing so created a neat fit, but note that the comparison would look
almost as neat if the S&P500 were lagged by 18 months. In the
latter case, though, the chart's message would be that the US stock
market was going to remain firm for another 6 months, which is perhaps
not what the analyst wanted the chart's message to be.
Current Market Situation
...it's
possible that too many people have bought into the idea of a major
4-year cycle low occurring within the next few months for such a thing
to actually transpire.
Most people think of put/call ratios as being contrary indicators,
meaning that they view a high volume of put options relative to call
options as being indicative of excessive fearfulness and, therefore, as
being bullish on the basis that market participants usually only become
excessively fearful near important bottoms. When it comes to equity
options this is the correct interpretation, but the opposite applies
when it comes to S&P100 (OEX) index options. The difference, we
think, stems from the fact that the public (the 'dumb money') is the
dominant force in the trading of equity options whereas professional
money managers dominate the trading of OEX options.
Further to the above, extreme highs in the equity put/call ratio tend
to coincide with market bottoms whereas extreme highs in the OEX
put/call ratio tend to coincide with market peaks.
The below chart shows that the 10-day moving average of the OEX
put/call ratio has just hit an extreme high (shown as a low on the
chart due to the inverted scale) and that a short-term peak in the
stock market has followed closely on the heals of previous similar
put/call readings over the past three years. In all but one of the
previous cases a stock market correction began within a few days of the
OEX put/call ratio hitting an extreme, the one exception being
January-2004 (in January-2004 the market continued to move higher for
about three weeks following the OEX put/call signal).
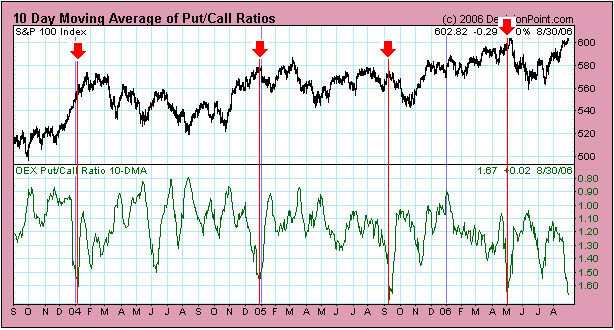
The above chart
suggests that a pullback should soon begin. However, the sentiment
backdrop does not appear to be conducive to a large decline in that
most sentiment indicators are revealing a remarkable lack of optimism
on the part of the investing public. For example: the amount of public
short-selling remains at a high level despite the stock market's
rebound, the bullish percentages reported by sentiment surveys are at
depressed levels, and the public's demand for bear funds is almost as
high today as it was when the stock market was bottoming in June.
Further to the above, it's possible that too many people have bought
into the idea of a major 4-year cycle low occurring within the next few
months for such a thing to actually transpire.
Our view is that a pullback will begin within the next few days and
that this pullback will be followed by a rally to new highs for the
year (new highs, that is, for the S&P500 Index, but not for the
NASDAQ100 Index).
Gold and
the Dollar
The Gold-Oil Relationship
...changes
in the oil price are neither here nor there as far as the price of gold
bullion is concerned. ...Changes in the oil price do, however, have an
important effect on gold mining shares...
If you spend (waste) a lot of time reading or listening to the
explanations in the mainstream financial press for why the gold market
did what it did on a particular day you will probably come away with
the impression that the oil market drives the gold market. For example,
whenever gold and oil prices fall on the same day you'll almost
certainly see headlines such as "gold follows oil lower"; and whenever
both markets rise together there will usually be headlines such as
"gold bounces in response to higher oil price".
The idea that the oil price is an important driver of the gold price
has also been given weight by the commentaries of the many gold bugs
who, over recent years, have often cited the rising oil price as a
reason to expect a higher gold price. Some gold bugs even claim, in one
breath, that a higher oil price is bullish for gold and then, in the
next breath, that gold is money. It seems not to have occurred to them
that there's no reason for the demand for money and the demand for
industrial commodities to move in the same direction.
On a side note, gold is unfortunately not money right now, but in many
respects it still trades as if it were. For example, it typically turns
in its best performances when real economic growth and confidence are
falling.
When a particular viewpoint becomes entrenched it will often be
self-fulfilling in the short-term. For instance, the idea that the
widening US trade deficit all but guaranteed a continuing decline in
the dollar over the coming 12 months gripped the markets during the
final quarter of 2004 and encouraged a lot of speculative 'shorting' of
the dollar. Even though it was based on a false premise this
speculative 'shorting' had the effect of pushing the dollar down at the
same time as interest rate differentials were setting the scene for a
US$ recovery. In a similar way, the mistaken view that the oil market
is an important driver of the gold market is causing a stronger
correlation between the two markets than there should be, which, in
turn, reinforces the faulty analysis.
But just as the "dollar is going to plunge due to the widening trade
deficit" idea that was so popular at the end of 2004 was eventually
overwhelmed by real interest rate differentials (the true fundamental
drivers of intermediate-term exchange-rate trends), we suspect that the
"oil price drives the gold price" idea that is currently quite popular
will, before much longer, be overwhelmed by genuine fundamentals.
In our opinion, changes in the oil price are neither here nor there as
far as the price of gold bullion is concerned. Under the current
monetary system the directions of the long-term price trends in oil and
gold will tend to be the same because inflation is a primary driver of
both markets, but it is what's happening on the monetary front, not
what's happening with oil supply/demand, that matters to the gold
market.
Changes in the oil price do, however, have an important effect on gold
mining shares, but it's not the effect that most people would expect.
To be specific, as far as gold mining equities are concerned a rise in
the oil price is BEARISH and a fall in the oil price is BULLISH. The
reason, of course, is that gold miners are major CONSUMERS of oil (a
large chunk of a gold miner's costs are energy-related).
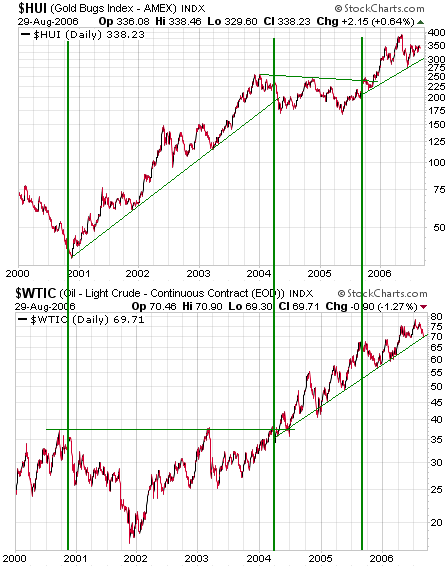
In theory, therefore, a comparison of longer-term charts of oil and the
AMEX Gold BUGS Index (HUI) should reveal a slight inverse correlation.
Fortunately, this is what the following chart comparison of the oil
price and the HUI actually does reveal (we say "fortunately" because
it's nice when market trends make sense). In particular, the chart
shows that:
a) The start of the long-term bull market in gold shares in Q4-2000
coincided, almost to the day, with an intermediate-term PEAK in the oil
price
b) The largest percentage gains made by gold shares occurred between
Q4-2000 and Q4-2003, a period during which the oil price was basing
c) Oil's upside breakout from its base coincided with the start of a major downward correction in the gold shares
d) Between November of last year and May of this year the oil price and
the HUI both surged upward. In light of what happened over the
preceding 7 years this action was anomalous, although it simply
reflected the fact that the gold price was rising at a faster rate than
the oil price during this period (gold was strong enough relative to
oil to offset the adverse effects, on the profit margins of gold
miners, of higher energy prices)
Of interest, but not shown on the below chart, is the fact that ALL the
gains in the major gold shares relative to the gold price were made
while the oil price was below $35.
In summary, the oil
price does not drive the gold price and the only reason the two markets
have similar long-term trends is that they have one important long-term
driver in common: monetary inflation. There is, however, an inverse
relationship between the oil price and the prices of gold shares, but
this relationship only comes to the fore during periods when the oil
price is moving sharply lower or sharply higher relative to the gold
price.
Current Market Situation
Things have recently been so slow in the currency market it almost
seems as though the market has stopped trading. The euro, for instance,
has spent the past 4 months oscillating between 1.25 and 1.29 and the
past 4 weeks oscillating between 1.27 and 1.29. However, a break in one
direction or the other is going to happen soon, perhaps in response to
the US Employment numbers due to be announced on Friday morning.
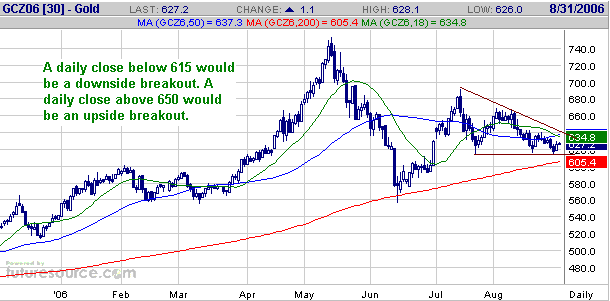
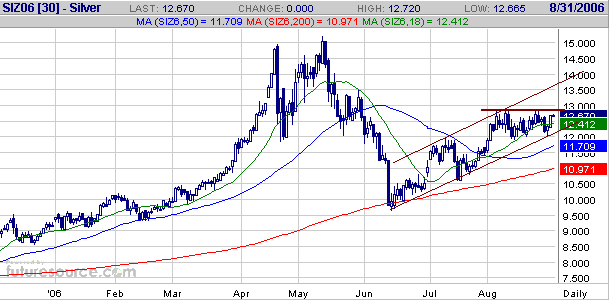
There has also been a lack of action in the gold and silver markets
over the past month. Again, though, a breakout in one direction or the
other is going to happen soon. With reference to the following daily
charts of December gold and silver futures, our thinking is that gold
will break upward from its recent consolidation and that silver will
move up to near the top of its channel over the next few weeks.
Gold Stocks
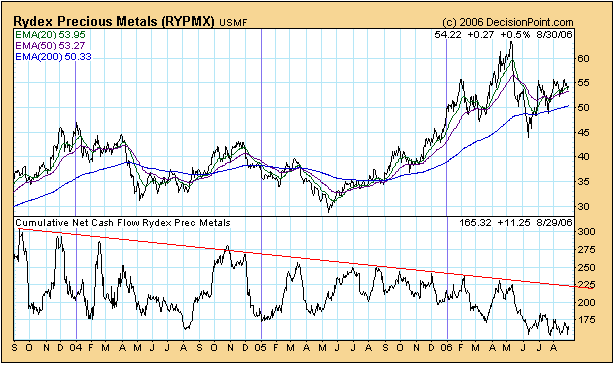
The following chart shows that the cumulative net cash flow into the
Rydex Precious Metals Fund hit a 3-year low early this week.
The gradual downward trend, over the past few years, in the amount of
money invested in the Rydex PM Fund is no doubt partly explained by the
introduction of a few ETFs that enable the public to easily gain
exposure to gold and gold shares. However, during a bull market for an
asset class it's normal for the public's demand for the asset to
outstrip any and all increases in supply...right up until the final
blow-off. The advent of a few new ways to invest in gold and gold
shares therefore doesn't account for why the amount of money invested
in gold-oriented mutual funds is as low as it is right now. Rather, we
think it boils down to a general lack of enthusiasm towards the gold
sector on the part of the public.
The low level of enthusiasm towards gold shares does, we think, reduce
the risk that a sharp decline is about to begin and improves the odds
of an upside surprise.
We continue to anticipate some additional gains in the gold sector prior to a drop back to test the June low.
In the
immediate-term, trading in the gold sector will be dominated by the
extraordinary merger announcement made earlier today. What we are
referring to is the announcement that Goldcorp (NYSE: GG) will be
buying Glamis Gold (NYSE: GLG).
The aforementioned merger news is extraordinary for two reasons. First,
Glamis is an incredibly expensive stock and yet Goldcorp's offer is
pitched at a 33% premium to Wednesday's closing price. Second, back in
December of 2004 Glamis made an offer to buy Goldcorp at a 23% premium
(that is, the situation was reversed), an offer that was rejected by
Goldcorp. So, Goldcorp previously rejected a merger deal with Glamis
that would, it seems, have been completed on vastly more favourable
terms for Goldcorp shareholders than the current deal.
In our opinion, today's merger news is terrific for GLG shareholders
and terrible for GG shareholders. It could, however, generate some
speculative interest in the gold sector.
Update
on Stock Selections
(Note: To review the complete list of current TSI stock selections, logon at http://www.speculative-investor.com/new/market_logon.asp
and then click on "Stock Selections" in the menu. When at the Stock
Selections page, click on a stock's symbol to bring-up an archive of our comments on the stock in question)
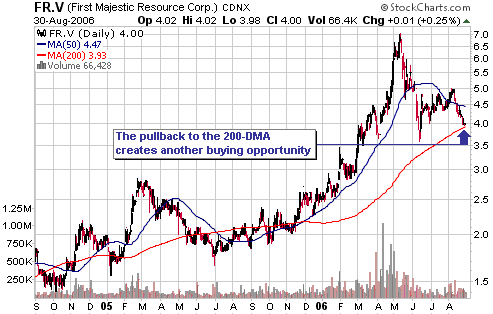
 First Majestic Resource (TSXV: FR). Shares: 33M issued, 51M fully diluted. Recent price: C$4.00 First Majestic Resource (TSXV: FR). Shares: 33M issued, 51M fully diluted. Recent price: C$4.00
FR is our favourite long-term investment in the silver sector. It
doesn't have as much upside potential as Sabina Silver (TSXV: SBB) or
Apogee Minerals (TSXV: APE), but it's a much larger company than the
aforementioned explorers and its success is more assured.
We last highlighted FR as a buy when it was bottoming in mid-June.
After rebounding strongly from its June low it has pulled back to just
above its 200-day moving average, creating another opportunity to buy
the stock at a reasonable price.
American Gold Capital (TSXV: AAU). Recent price: C$1.69
We added AAU to the TSI Stocks List in April, primarily to gain a
foothold in the Chesapeake Gold (TSXV: CKG) warrants and rights that
are going to be issued to AAU shareholders as part of the planned
merger of AAU and CKG. CKG's latest quarterly report was released after
the close of trading on Wednesday and contained the following update on
the merger:
"On March 3, 2006
Chesapeake and American Gold agreed to a business combination of the
two companies. Pursuant to the agreement, Chesapeake will issue for
everyone (1) outstanding common share of American Gold ( i ) 0.29
Chesapeake Common shares ("Shares"), (ii) 0.145 Chesapeake common share
purchase warrants ("Warrants") and, (iii) 0.29 Chesapeake rights
("Rights"). Based on 30,855,525 outstanding common shares of American
Gold this would result in the issuance by Chesapeake of approximately
8,948,102 shares, 4,474,051 Warrants and 8,948,102 Rights.
Each Warrant will entitle
the holder to purchase one (1) Chesapeake common share at $8.00 for a
term of 5 years. Each Right will be exercisable for one (1) Chesapeake
common share at $1.00 for a term of five years in the event that the
average London PM fix closing trading price of gold for the trading
days on such market during any 90 day period is equal to or greater
than US$850 per ounce. If the proposed transaction is completed it is
anticipated that Chesapeake will have a total of 28,685,897 shares
issued and outstanding. Of these shares approximately 68.8% will be
held by the existing Chesapeake shareholders and 31.2% will be held by
the existing American Gold shareholders. In addition it is anticipated
that American Gold shareholders will hold Warrants to acquire
approximately 4.5 million additional shares and Rights to acquire a
further approximately 9.1 million shares which if fully exercised would
represent approximately 53.4% of the then outstanding shares.
Both parties are continuing in their efforts to complete, and expect
to be in position to execute the definitive combination agreement
between the companies in late August-early September, 2006. The
delay in executing the definitive agreement results from the efforts
made in evaluating and structuring the proposed transaction to achieve
an optimal fiscal outcome from the perspective of both parties and
their shareholders.
Once the definitive
agreement is executed, American Gold will finalize the information
circular for mailing to its shareholders in connection with the holding
of a Special Meeting to approve the proposed business combination. It
is expected that the meeting materials will be mailed to American Gold
shareholders in September for a Special Meeting to be held in October.
If the proposed business combination is approved by American Gold's
shareholders, the business combination should close in early November, 2006." [Emphasis ours]
Earlier in the same report it was noted that if the proposed merger is completed then "Chesapeake
will have approximately $40 million in cash and long term investments,
the largest undeveloped gold and silver deposit in Mexico, an advanced
Nevada gold project with a mineral resource of over 1.2 million ounces
together with a dominant pipeline of exploration and development
projects in Mexico."
Chart Sources
Charts appearing in today's commentary
are courtesy of:
http://stockcharts.com/index.html
http://www.futuresource.com/
http://www.decisionpoint.com/

|
