![]()
![]()
![]()
![]()
- Interim Update 30th August 2017
Copyright
Reminder
The commentaries that appear at TSI may not be distributed, in full or in part, without our written permission. In particular, please note that the posting of extracts from TSI commentaries at other web sites or providing links to TSI commentaries at other web sites (for example, at discussion boards) without our written permission is prohibited.
We reserve the right to immediately terminate the subscription of any TSI subscriber who distributes the TSI commentaries without our written permission.
A potential T-Bond reversal in the making
The iShares 20+ Year Treasury ETF (TLT) spiked up to its June high on Tuesday of this week and then reversed course. This spike possibly set a double top and marked the beginning of an intermediate-term decline, but it's too soon to tell.
At this stage it's an even-money bet as to whether a) Tuesday's spike marked the beginning of an intermediate-term T-Bond (and TLT) decline or b) there will be a T-Bond surge to a final high in September in response to fear-inducing stock market weakness. However, we continue to think that this week is a reasonable time to start averaging into a bet against the T-Bond via the ProShares UltraShort Treasury ETF (TBT).
The Stock Market
The monetary backdrop is the long-term key
The end of the US equity bull market will not be caused by a news event. For example, North Korea's mischief-making will not bring about a shift in the stock market's long-term trend.
After the fact it will be possible to look back and find specific events that coincided with the major reversal and many commentators will cite these events when trying to explain why the trend changed, but the real reason will be tightening monetary conditions. Unfortunately, while we have ways of measuring the extent to which the monetary backdrop is tight/loose, there is no way to know in advance the amount by which monetary conditions will have to tighten before the resulting downward pressure on an over-valued stock market will become irresistible.
There has been a meaningful tightening of monetary conditions over the course of this year, but there is no evidence yet that it has been sufficient to reverse the long-term upward trend in leverage and the associated long-term upward trend in prices.
Current Market Situation
So far, this has been a good week for the US stock market. For one, the S&P500 Index (SPX) has rebounded to above its 50-day MA. For another, the Russell2000 Index (RUT) has stepped back from the brink. Refer to the following charts for details.
The relatively strong indices such as the SPX won't be in imminent danger of suffering large declines until the relatively weak indices such as the RUT and the Dow Transportation Average (TRAN) break out to the downside.
It hasn't been a good week for European equities as represented by the EURO STOXX 50 Index (STOX5E), but, unlike the senior US stock indices, on a short-term basis the STOX5E has now accomplished as much on the downside as we expected. If the SPX had performed similarly it would now be about 100 points lower.
Gold and the Dollar
Gold
By their nature, superstitions die hard. They aren't based on evidence, so no amount of evidence can cause a superstition to be abandoned. For example, the gold price has never held onto gains achieved on the back of military conflict or rising fear of military conflict, but the superstitious belief that gold should be bought in anticipation of or in reaction to military conflict never wavers.
Currently, the fundamental backdrop is gold-bullish for reasons that have absolutely nothing to do with North Korea. If it remains so it will be reasonable to assume that significant additional price gains are in store, at least until sentiment becomes a strong headwind and/or intermediate-term momentum indicators become stretched to the upside.
There was an obvious upside breakout in the US$ gold price on Monday 28th August, but, as we noted in the email sent to subscribers after the close of Monday's session, the breakout pushed the daily RSI into 'overbought' territory. This prompted us to write:
"With the gold market already short-term 'overbought' and likely to be distorted over the days ahead by the North Korea situation, there is obviously a risk that Monday's breakout will prove to be a false signal. However, the short-term bullish scenario should continue to be given the benefit of the doubt until/unless evidence of a false breakout emerges. For gold and the HUI we would now view daily closes below $1290 and 197, respectively, as evidence that the 28th August upside breakouts were false/misleading signals."
It turned out that gold wasn't able to build on Monday's upside breakout, but it hasn't yet done anything to cast doubt on the sustainability of the breakout. We expect significant additional gains within the next two months.
Silver
It's worth mentioning that the US$ silver price is yet to break out to the upside. As illustrated below, this week's up-move in the silver price ended at the channel top.
It will be of help to the short-term bullish case if the silver price ends the week above its channel top.
Gold Stocks
Like the US$ gold price, the HUI achieved a clear-cut upside breakout early this week that immediately resulted in a short-term 'overbought' condition as indicated by the daily RSI(14).
Considering that the HUI's upside breakout came after 6.5 months of range-trading it's likely to be sustained. However, there are no guarantees, so the risk of a breakout failure should be acknowledged. As previously advised, we would view a daily close below 197 as evidence of a breakout failure.
The Currency Market
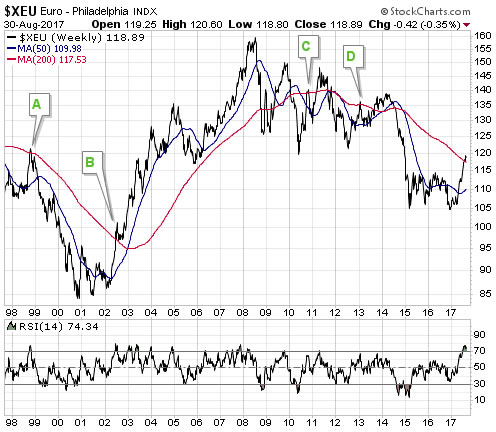
After trading as low as 105 last December, during the first half of this week the euro tested long-term resistance at 120. Also, over the past four weeks the euro has traded above its 200-week moving average for the first time since early-2014. This strength is consistent with a long-term trend change from down to up. Unfortunately, it is also consistent with an intermediate-term bear-market rebound.
On the following long-term weekly chart of the euro we have identified four points, labeled A, B, C and D, that are potentially similar to the current position. In each case the point was reached via a strong 6+ month rally that took the euro from well below to slightly above its 200-week MA (the red line on the chart).
Point A is associated with the most bearish scenario. In this case the rapid rebound to slightly above the 200-week MA was followed by a powerful 2-year downward trend to the ultimate bear-market low.
Point B is associated with the most bullish scenario. In this case the rapid rebound to slightly above the 200-week MA was followed by a minor 3-month consolidation and then another rapid multi-quarter advance.
Points C and D are effectively the same. In each of these cases a rapid rebound to slightly above the 200-week MA was followed by a sizable multi-month correction to the vicinity of the 50-week MA (the blue line on the chart). There was then a rally to above the initial rebound high, after which the bear market resumed.
The one thing that each of these scenarios has in common is that a multi-month decline/consolidation began shortly after the euro broke above its 200-week MA. It was the extent of the decline that followed the break above the 200-week MA that indicated whether the initial rebound from the low was part of an on-going bear market or the first leg of a new bull market.
At this stage we think that the current situation is least like Point B, but if the coming decline holds above 115 and is followed by a rally to a new 12-month high then the 'new bull market' scenario will go from being least likely to most likely.
Regardless of scenarios based on previous performance, it's highly probable that the primary driver of the euro (relative to the US$) over the past 12 months will be its primary driver over the next 12 months. We are referring to the Germany-US 10-year bond-yield spread.
As illustrated by the following chart, the Germany-US 10-year bond-yield spread began to move against the euro in mid-July. This suggests that roughly the final four points of this year's euro rally were due to a speculative blow-off, which, in turn, suggests that four points could be given back quickly.
Finally, there is preliminary evidence that the long-awaited and much-anticipated reversals in the euro and the Dollar Index (DX) happened over the past two trading days. As illustrated by the following daily chart, the DX closed at a new low for the move on Monday and then extended its breakdown on Tuesday before turning around.
As an aside, the 0.4% upward revision to the Q2 US GDP growth number reported on Wednesday had nothing to do with the DX's upward reversal. We know this because a) the reversal began a day before the GDP revision was reported and b) the GDP revision did not prompt any increase whatsoever in the expected level of the Fed Funds Rate.
Updates on Stock Selections
Notes: 1) To review the complete list of current TSI stock selections, logon at
http://www.speculative-investor.com/new/market_logon.asp
and then click on "Stock Selections" in the menu. When at the Stock
Selections page, click on a stock's symbol to bring-up an archive of
our comments on the stock in question. 2) The Small Stock Watch List is
located at http://www.speculative-investor.com/new/smallstockwatch.html
![]() Quick comment on Orla Mining (OLA.V)
Quick comment on Orla Mining (OLA.V)
From the email sent to subscribers early this week:
"...in the 7th August Weekly Update we introduced Orla Mining (OLA.V), an exploration-stage gold miner with projects in Panama and Mexico. At that time we wrote that OLA would be added to the TSI List if it traded at C$1.06 (it was trading in the C$1.20s at the time). It traded as low as C$1.05 on Monday 28th August and has therefore been added to the List at C$1.06.
We consider OLA to be a short-to-medium-term trading position with an expected holding period of up to 9 months."
Here's a daily chart of the stock. Our stipulated buy price was set slightly above lateral support at C$1.05 in the hope of catching a downward spike to support. A downward spike to support is what we got early this week.
 Quick comment on Asanko Gold (AKG)
Despite all the rumours, speculation and negative press, up until now the only significant bearish information to emanate from AKG is a 10% reduction to 2017 production guidance. This news was responsible for the last multi-day plunge shown on the following daily chart.
AKG has rebounded to its 50-day MA, which happens to coincide with lateral resistance in the mid-US$1.20s. If it can get through this resistance then the 200-day MA will become a realistic short-term target.
Chart Sources
Charts appearing in today's commentary are courtesy of:
http://stockcharts.com/index.html
![]()