|
- Interim Update 30th November 2005
Copyright
Reminder
The commentaries that appear at TSI
may not be distributed, in full or in part, without our written permission.
In particular, please note that the posting of extracts from TSI commentaries
at other web sites or providing links to TSI commentaries at other web
sites (for example, at discussion boards) without our written permission
is prohibited.
We reserve the right to immediately
terminate the subscription of any TSI subscriber who distributes the TSI
commentaries without our written permission.
Copper Market Manipulation
IF
market manipulation by hedge funds is largely responsible for the
current high level of the copper price then it's reasonable to conclude
-- as Veneroso and Hunt have done -- that at some point over the next
few months the price will tank.
Two interesting reports on the machinations in the copper market have
been produced over the past few weeks, one by Frank Veneroso and the
other by Simon Hunt. Both of these analysts are experienced and
knowledgeable, and both have arrived at the same conclusion: the copper
price is headed for a big fall.
Frank Veneroso, in his 6th November report entitled "Copper: The
Manipulation", lays out the evidence that hedge funds have been
stocking-up on copper over the past year, thus creating the appearance
of a shortage in a market that would otherwise have experienced a
substantial surplus. He begins his analysis by explaining that official
data on copper demand is based on "apparent consumption", which is
calculated by summing domestic production, net imports and the change
in visible stocks. Taking the specific example of China, the country
whose industrial demand has supposedly driven the copper price to its
current heights, there is a huge discrepancy between data on actual
copper consumption and the "apparent consumption" figures on which most
supply/demand analyses are based. This discrepancy, according to Mr
Veneroso, is around 30,000 tonnes per month, which if correct would
means that 30,000 tonnes per month of copper were going into
non-visible stocks.
Mr Veneroso goes on to explain a) why it is very likely that the
additional copper -- the amount that is going into non-visible stocks
each month -- is being accumulated for speculative, rather than
industrial/commercial, purposes, b) how the manipulation is probably
being conducted, c) the manipulators' exit strategy, and d) the risks
for the manipulators.
One of the main risks facing the manipulators is that the surplus in
the market will increase to the extent that it is no longer
economically feasible for them to purchase enough physical copper to
maintain the illusion of a tight market. The surplus is probably
increasing every month, but this risk would really come to the fore if
an entity that held a large stock of non-reported copper -- China's
Government, for example -- were to decide to dump a lot of copper onto
the market with the intent of bringing down the price.
According to both Frank Veneroso and Simon Hunt, the potential for
China's Government to suddenly increase the supply of copper is a clear
and present danger to those who are attempting to push the price higher
by removing copper from visible inventories. A lot has been written in
the press over the past month about a 100K-200K tonne short position in
copper built-up by a trader working for China's State Reserve Bureau
(SRB) -- an agency responsible for the stockpiling of strategic
materials. However, if recent statements by Chinese officials can be
believed -- and Mr Hunt asserts that they SHOULD be believed -- then
this short position is small compared to the 1.3M tonnes of copper held
by the SRB. In other words, Mr Hunt thinks that the SRB has the ABILITY
to end the manipulation and bring about a substantial fall in the
copper price. And given that the high copper price is causing problems
for China's manufacturing industry the SRB also has the INCENTIVE to
supply enough additional copper to the market to bring down the price.
In summary, Mr Veneroso's conclusion is that the current high copper
price is the result of an old-fashioned 'short squeeze' and that the
price will collapse to below $1/pound when the squeeze ends. Mr Hunt's
conclusion is similar, although he doesn't mention a specific price
target.
Our view is that the manipulation theory is plausible. In fact, during
the first half of this year we said that copper's relentless price
strength was probably due more to manipulation by hedge funds than
genuine supply/demand dynamics. Our opinion wasn't based on a detailed
analysis of supply and demand in the copper market; rather, it was
based on the fact that some of the most important underpinnings of
copper's intermediate-term upward trend were either disappearing or had
already disappeared, and yet the price was still moving higher. In
particular, we noted the following:
a) The support that had been provided by a weakening dollar during 2002-2004 was no longer in place
b) The plunge in ocean freight rates was indicating that Chinese demand for raw materials was falling
c) Liquidity, whilst remaining at a fairly high level, was expanding at
a significantly slower rate than had been the case during 2003-2004
IF market manipulation by hedge funds is largely responsible for the
current high level of the copper price then it's reasonable to conclude
-- as Veneroso and Hunt have done -- that at some point over the next
few months the price will tank. However, the idea of betting against
the copper market doesn't appeal to us right now. We made a couple of
attempts to bet against copper earlier this year via positions in
Phelps Dodge put options, but these put options will almost certainly
have to be written off because the manipulation -- if that's what is
actually going on in this market -- has been more successful than we
had expected. We are more confident now than we were then that
manipulation is the major driving force behind the price move and that
a large price decline lies in the future, but we have no way of
estimating when this large decline will begin. We'll therefore stay
away for now.
When the copper squeeze ends and the price plunges the other industrial
metals will almost certainly be adversely affected, but we suspect that
the bulk of the damage will be confined to the copper market. It is
probable that the gold market will also be adversely affected for a
while because it is likely that some of the hedge funds that are
heavily 'long' copper are also 'long' gold futures, although we don't
think a large downturn in the copper price would be a longer-term
negative for gold. In fact, to the extent that a large decline in the
copper price helped push the US yield-spread higher it would be a
longer-term positive for gold.
The Stock Market
Current Market Situation
There were downward reversals in many of the world's stock markets
during the first half of this week, but it's unlikely that these
reversals will evolve into anything more serious than routine
consolidations. The first quarter of next year is a more likely time
for major peaks to occur.
With respect to the US market, the following weekly chart of the
NASDAQ100 Index (NDX) shows the important support that exists at around
1630. As long as this support is not breached during any further
corrective activity over the coming fortnight we will assume that at
least one more push to a new multi-year high lies ahead of us.
Gold and
the Dollar
Gold Stocks
The Keys
The keys to breaking the AMEX Gold BUGS Index (HUI) upwards out of the
range in which it has traded over the past two years are the gold/CRB
ratio and the US yield-spread (the difference between yields on
long-term and short-term US Treasury debt).
A breakout to new multi-year highs by gold relative to the CRB Index
would point towards a surge in profit margins for gold mining companies
because the CRB index is a proxy for the costs incurred by these
companies (gold miners purchase commodities such as energy and steel in
order to produce gold). If this happened we would expect the biggest
winners to be the exploration-stage stocks and the stocks of low-margin
producers such as DRDGOLD (NASDAQ: DROOY), Golden Star Resources (AMEX:
GSS), and Resolute Limited (ASX: RSG).
The yield-spread is important because a widening yield-spread
(long-term rates rising relative to short-term rates) indicates that
monetary policy is becoming 'easier' and that inflation is going to be
higher in the future than it is in the present. Furthermore, the
gold/CRB ratio trends with the yield-spread, so it would be unlikely
for gold/CRB to make a sustained upside breakout unless the
yield-spread began to widen in sustainable fashion.
The inter-relationship between the HUI, the gold/CRB ratio and the yield-spread is shown below.
Current Market Situation
A couple of weeks ago we mentioned that some bearish divergences were
potentially developing within the gold sector. The following chart of
the HUI, two momentum indicators for the HUI (the RSI and the MACD),
and the HUI/gold ratio, shows that these bearish divergences have
continued to develop. Specifically, note that last week's higher high
in the HUI was accompanied by lower highs in the aforementioned
momentum indicators and the HUI/gold ratio. That this is happening at a
time when a cyclical turning point is due is a reason to be especially
wary. We will therefore retreat to a short-term "neutral" view on the
HUI.
Interestingly, the
HUI peaked at the beginning of December-2003 on the day the gold price
first traded above $400 and this week's peak and subsequent downward
reversal in the HUI has coincided with the nearest gold futures
contract trading at $500 for the first time since 1987. Following the
December-2003 peak in the HUI the gold price continued to move higher
and by January of 2004 it was in the 420s, yet the HUI was unable to
exceed its early-December peak at any time.
It's quite possible that the HUI has just made a peak of similar
importance to its December-2003 and November-2004 peaks, but even if
this is the case we doubt that a large decline will occur over the next
several weeks. As discussed below, the public does not appear to be
bullish enough on gold to allow for anything more than a routine
pullback at this time. This is obviously a time to be cautious, but
even if an intermediate-term peak has just been put in place we think
the most likely short-term outcome is for the HUI to hover near its
highs for another 1-2 months. This is the type of scenario that would
allow for some of the more speculative gold/silver stocks to make new
highs early next year.
Long-Term Outlook
If
the HUI of today duplicates the performance of the BGMI of the 1960s
and 1970s then it will peak at around 1400 towards the end of the next
decade.
In the "Big Picture View" included at the top of every Weekly Market
Update we say that the peak of gold's secular bull market will likely
occur during 2008-2010. We are going to take things one decade at a
time, but actually it would be unusual for a secular bull market to
only last 10 years. A more typical duration would be 15-20 years.
If you only looked at the performance of the gold price you would
probably come to the conclusion that the previous secular bull market
in gold lasted only 9 years (from 1971 through to the beginning of
1980), but the picture is distorted by the fact that the gold price was
fixed prior to 1971. By looking at the performance of gold stocks we
can, however, get an undistorted view of what happened.
The following chart shows that a secular bull market in the Barrons
Gold Mining Index (BGMI) extended from the first half of the 1960s
through to 1980. Not coincidentally, the secular bull market in gold
stocks of the 1960s and 1970s coincided with secular bear markets in
most other sectors of the stock market.
If the HUI of today
duplicates the performance of the BGMI of the 1960s and 1970s then it
will peak at around 1400 towards the end of the next decade. In this
case the total gain from its November-2000 bottom would be around
3500%, which is not an unusual achievement for a secular bull. For
example, from its 1982 bottom to its 2000 peak the NASDAQ Composite
Index gained 3100%.
Gold
December gold has just tested round number resistance at $500 and has
begun to pullback (see chart below). If this is just a routine
consolidation then support at 480-485 should not be breached.
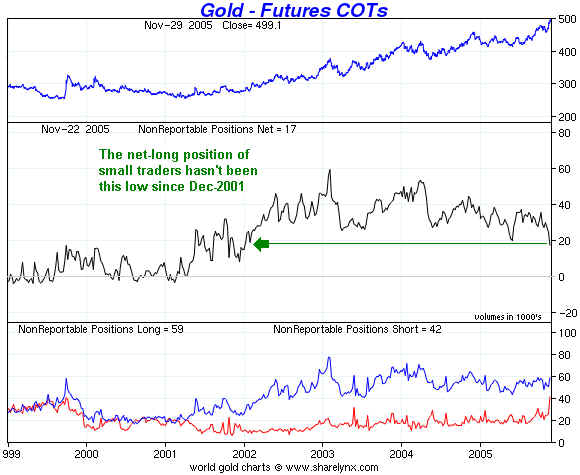
The probability that
any pullback at this time will be "routine" is enhanced by the public's
lack of enthusiasm towards gold. Large speculators have been very
bullish for a while, but the following sharelynx.com
chart shows that the net-long position of small traders in COMEX gold
futures has just hit its lowest level since December-2001. This
suggests that small traders are now less bullish regarding gold's
short-term prospects than they have been at any time over the past 4
years.
Currency Market Update
The euro is presently mid-way between short-term support and
intermediate-term resistance (see chart of December euro futures
below). We expect short-term support to be breached over the coming
weeks.
The Yen has a lot
going for it. In particular, Japan runs a large current account surplus
and the Japanese stock market has, over the past several months, become
a world leader. However, with the Fed continuing to push US short-term
interest rates upward and the Bank of Japan retaining its "zero
interest rate" policy there is a huge incentive for speculators to
borrow Yen and invest the proceeds in short-term dollar-denominated
debt. This is known as the "Yen carry trade", and so far this year the
putting-on of these carry trades has swamped any other considerations
(when someone borrows Yen in order to buy dollars they are, in effect,
shorting the Yen versus the US$). At some point in the future all of
these carry trades will have to be unwound and there will be a
spectacular surge in the Yen, just as there was during the second half
of 1998 when some large hedge funds attempted to exit similar trades
(refer to the weekly Yen chart below). This WILL happen, but it's
anyone's guess WHEN it will happen.
The Yen will probably bounce over the next few weeks, but at this stage
we don't see a good reason to expect an imminent reversal in the
intermediate-term trend.
Update
on Stock Selections
 Desert
Sun Mining (TSX: DSM, AMEX: DEZ) announced on Monday that it had raised
C$30M by issuing 12M units at C$2.50 per unit, with each unit
consisting of one common share and one-quarter of one common share
purchase warrant. Taking into account the value of the warrants, the
new shares were issued at a discount of around 15% to last Friday's
closing price, or a discount of around 10% to the average price over
the preceding week. As is invariably the case when a substantial number
of new shares are issued at a discount to the current market price, the
stock market reacted negatively to this news. Desert
Sun Mining (TSX: DSM, AMEX: DEZ) announced on Monday that it had raised
C$30M by issuing 12M units at C$2.50 per unit, with each unit
consisting of one common share and one-quarter of one common share
purchase warrant. Taking into account the value of the warrants, the
new shares were issued at a discount of around 15% to last Friday's
closing price, or a discount of around 10% to the average price over
the preceding week. As is invariably the case when a substantial number
of new shares are issued at a discount to the current market price, the
stock market reacted negatively to this news.
We were surprised by management's decision to issue more equity at this
time given that the company has plenty of cash in the bank, no debt,
and a mine that should now be cash-flow positive. However, if companies
have to issue more equity then the best time for them to do so is when
market conditions are favourable and the stock price is near an
all-time high. In this respect the timing of the issue was good.
The main use of the funds will be to finance the development of the
Morro do Vento deposit. Currently, DSM's Jacobina Mine in Brazil is
producing gold at the annual rate of around 100K ounces and with this
week's financing the company should now have enough money to increase
production to 150K ounces/year over the coming 12 months by bringing
Morro do Vento on line.
In our opinion, DSM would be suitable for new buying in the C$2.20s. It
is one of the stocks with a good chance of making a new high during the
first quarter of next year even if the HUI has just made an
intermediate-term peak. Also, this week's pullback has taken the DSM
warrants (TSX: DSM.WT) back to levels where new buying might be
appropriate (the warrants closed at C$0.71 on Wednesday).
Chart Sources
Charts appearing in today's commentary
are courtesy of:
http://stockcharts.com/index.html
http://www.futuresource.com/

|