|
- Interim Update 30th November 2011
Copyright
Reminder
The commentaries that appear at TSI
may not be distributed, in full or in part, without our written permission.
In particular, please note that the posting of extracts from TSI commentaries
at other web sites or providing links to TSI commentaries at other web
sites (for example, at discussion boards) without our written permission
is prohibited.
We reserve the right to immediately
terminate the subscription of any TSI subscriber who distributes the TSI
commentaries without our written permission.
Interesting...
"In the 1880s, total UK bank assets were equal to 5% of GDP. At the bubble peak they were 500%. As to consolidation, the assets of the UK's three biggest banks at the start of the 20th Century were 7% of GDP. By the end of it they were 75% and by 2007 -- astonishingly -- 200%. Leverage climbed from 3 - 4 times in the19th Century to 30 times in the bubble. And return on equity -- unsurprisingly -- went from modest single figures to 30% at the peak."
- From a 6th November article by Tony Jackson in the Financial Times, by way of Don Coxe's "Basic Points" letter.
Our comment: Today's monetary system is what it is (a system based on non-convertible paper (or electronic) money and central banks with infinite capacity to create new money) for two equally important reasons. The first is to enable commercial banks to expand their balance sheets to a vastly greater extent than would otherwise be possible. The second is to enable governments to become much bigger than would otherwise be possible. The Stock Market
In the latest Weekly Update we wrote:
"The performance of the market during previous periods when technical indicators were in similar positions suggests two potential outcomes. One is that a multi-month low is now in place or will be put in place via a final downward spike this week. The other is that a multi-week rebound or consolidation will soon commence, after which the market will resume its downward trend. Either way, the market should soon stabilise or strengthen for at least 2-3 weeks. In other words, the stage is set for an interim or short-term low."
It's apparent that some sort of low was put in place at the end of last week.
At the end of last week some technical indicators were at extremes that clearly pointed to a significant rebound, either beginning immediately or following a final downward spike this week. As an aside, when you are 'short' you should pay attention to such extremes, because bear-market rebounds have a tendency to be ferocious. Gains on short positions that have accumulated over a few weeks can easily be wiped out in 2-3 days, even while the longer-term outlook remains bearish.
The market action of the past few days has, however, negated any ability we have to make short-term predictions based on technical indicators. This is because the 'oversold' condition has been eliminated and an 'overbought' condition has not yet been established.
Most traders are probably now expecting the rally to continue until early next year in response to positive seasonal factors, which is definitely a plausible scenario. This scenario would be bolstered by an interim peak this week or early next week followed by a 1-2 week pullback to a higher low. Alternatively, if the market continues its upward ramp beyond the next few days then the next important peak could occur as soon as the middle of December.
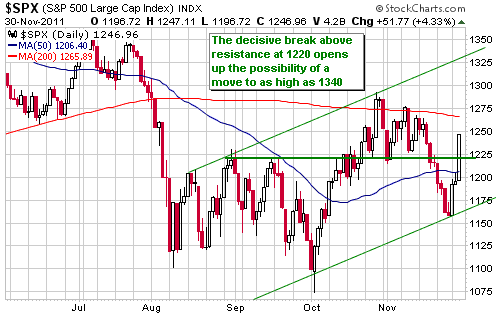
The stock market initially reversed direction this week due to its 'oversold' extreme and then accelerated upward in dramatic fashion on Wednesday in reaction to news that central banks around the world were providing more money.
The way that most pundits interpret news is often determined by how the market behaves in the wake of the news. For example, if the market surges upward in the immediate aftermath of a news event then most pundits will go out of their way to explain why the news was fundamentally bullish, but if the market declines or goes nowhere in the aftermath of exactly the same news event then we'll see plenty of explanations about why the news was either fundamentally irrelevant or bearish. However, for fundamental analysis to be worth anything it must be independent of price action.
Our opinion is that the news that supposedly gave global equity and commodity prices a huge boost on Wednesday was irrelevant. As generally reported in the press, the main fundamental change that happened on Wednesday was a coordinated decision by the world's major central banks to provide US$ liquidity at a reduced rate. This is to be done by reducing the rate that the Fed charges for central bank liquidity swaps -- from around 1.0% to around 0.50%. (Note: A good description of the mechanics of "central bank liquidity swaps" can be found at
http://www.cnbc.com/id/44963864.)
In an effort to help the ECB prop-up troubled European banks the Fed had already promised, back in September, to provide an UNLIMITED quantity of new dollars via "Central Bank Liquidity Swaps". Furthermore, as at the end of last week only $2.4B had been provided under this facility. So, we are now supposed to believe that reducing the cost of these swaps by 0.50% is going to make a big difference? We are supposed to believe that insolvent European banks that were neither willing nor able to borrow dollars at 1.0% are now going to be healthier because they are being given the opportunity to borrow dollars at 0.50%? Is this a joke?
Also emanating from the shady world of central banking on Wednesday was news that the Bank of China (BOC) had reduced the official reserve requirement for commercial banks from 5.5% to 5.0%. If this indicates a major directional change in BOC policy then it is more significant than the "liquidity swaps" news discussed above, but we wonder if there is much scope for looser monetary policy in China. After all, looser monetary policy would add to the already-blatant inflation problem in that country.
Gold and the Dollar
Gold and Silver
The biggest reaction to the central bank liquidity news occurred in the stock market. This is probably because the stock market was closer than the other major markets to sentiment and momentum extremes.
The gold and silver markets rose on Wednesday, but the up-moves didn't significantly alter the price patterns. Silver, for example, rose to the top of the $31-$33 range in which it has oscillated over the past 8 trading days.
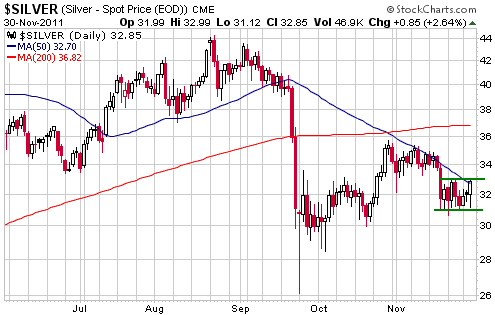
With a short-term bottom most likely now in place in the stock market, silver is more likely to break out of its recent $2 range to the upside than the downside. An upside breakout from this range would potentially be followed by a rise to the high-30s.
We will re-assess the situation in real time, but if a rise to the high-30s eventuates over the next few weeks we will probably view it as a good short-term selling opportunity.
Gold Stocks
The wide-angle view
Gold stocks, as a group, did poorly in 2011. They did very well during 2009 and 2010, although the strong 2009-2010 performance was partly a reaction to the dismal 2008 performance. If we step back we see that despite experiencing some huge swings, they have essentially gone nowhere since March of 2008. In other words, long-term holders of gold stocks have now spent almost 4 years treading water in rough seas.
If past is prologue, the gold sector's performance over the past few years is encouraging. We say this because if we step even further back we see that the current long-term bull market is continuing to evolve in a similar manner to the long-term bull market that extended from the early-1960s to 1980. In particular, with reference to the following weekly chart of the Barrons Gold Mining Index (BGMI) we see that:
1. The previous bull market had three major upward legs separated by huge corrections back to a long-term trend-line (drawn in green on our BGMI chart). The new bull market appears to have completed the first major upward leg and the first huge correction back to the long-term trend-line (the trend-line under the current market is drawn parallel with the earlier one to help make the point that the long-term pace of advance is roughly the same in both cases). In terms of time it now appears to be about half way into the second major upward leg, although in terms of price it is probably less than half way. This is because a disproportionately large percentage of a multi-year up-leg's price gain usually occurs during its final 6 months.
2. After the 60s-70s bull market reached the top of a major upward leg (the points labeled 1 and 2 on our BGMI chart), more than 5 years elapsed before there was a decisive break to a new all-time high. If the current market does something similar then there won't be a decisive break into new all-time-high territory prior to the second quarter of 2013. The point, here, is that the gold sector's seeming inability over the past 12 months to embark on a powerful new upward trend is consistent with what happened during the previous long-term bull market.
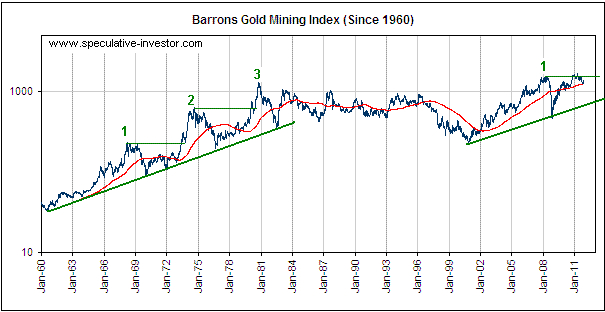
Now, we shouldn't blindly assume that the current long-term bull market will continue to track the earlier long-term bull market. Real-time analysis is required at each step along the way, because the current market could end up doing better or worse than the earlier one in response to contemporary fundamental developments. We are simply trying to show that the frustration being experienced by today's holders of gold stocks was most likely also experienced by holders of gold stocks at a similar stage of the 60s-70s bull market. In fact, the level of frustration could have been higher back then because this time around the BGMI was quicker to recoup the losses incurred during its first major correction.
Current Market Situation
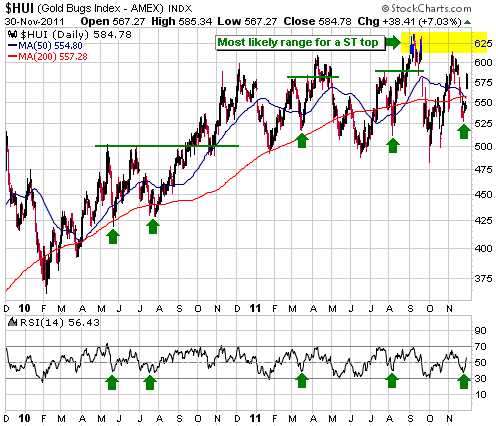
In the Weekly Update we wrote that an intermediate-term bottom was probably in the process of being established in parallel with depressed sentiment, but that neither the price action nor momentum indicators were giving us much to go on as far as the short-term risk/reward was concerned. We noted that the HUI's daily RSI(14) was at a level that sometimes coincided with a short-term bottom, and that the HUI was about to experience a 50-day/200-day moving average "death cross", an event that most 'technicians' interpret as bearish even though it usually has bullish implications on at least a short-term basis.
As a result of the price action over the first three days of this week, we now have something to go on. The HUI has clearly reversed upward from a daily RSI(14) reading of
38- 40, which it has done on four previous occasions since May of 2010
(indicated by the green arrows on the following chart). And the "death cross" has again failed to live up to its name in that it has occurred in parallel with another short-term bottom. "Life Cross" would be a better name.
Based on earlier price action, the HUI should at least gain enough additional ground to test its early-November peak within the next four weeks. It could even gain enough additional ground to test its September peak.
Note that some 'backing and filling' could occur over the days immediately ahead.
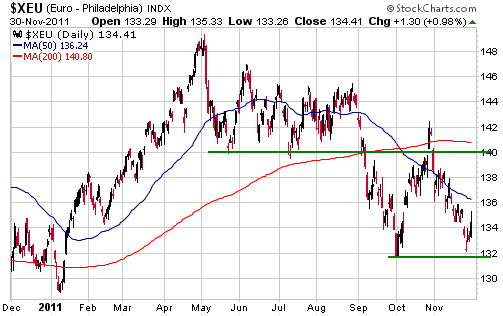
Currency Market Update
With the stock market rebounding strongly this week it almost goes without saying that the euro has also rebounded. It's noteworthy, however, that the rebound in the euro has been far less impressive than the rebound in the stock market.
With the total speculative net-short position in euro futures just below its May-2010 all-time high, there is more than enough short-covering fuel to drive a multi-week euro rebound. The price action isn't yet definitive, but with the stock market having reversed upward it is likely that such a rebound has just begun.
We'll take the price and sentiment evidence as it comes, but at this stage it looks like the euro has the potential to rebound to the high-130s.
Update
on Stock Selections
Notes: 1) To review the complete list of current TSI stock selections, logon at
http://www.speculative-investor.com/new/market_logon.asp
and then click on "Stock Selections" in the menu. When at the Stock
Selections page, click on a stock's symbol to bring-up an archive of
our comments on the stock in question. 2) The Small Stock Watch List is
located at http://www.speculative-investor.com/new/smallstockwatch.html
 Pretium Resources (TSX: PVG). Shares: 87M issued, 92M fully diluted. Recent price: C$12.24 Pretium Resources (TSX: PVG). Shares: 87M issued, 92M fully diluted. Recent price: C$12.24
On Monday PVG announced an updated resource calculation for the Brucejack part of the Snowfield-Brucejack project. The overall NI-43-101 project resource now contains 38.8M ounces of gold in the M&I category (up from 34.1M ounces) and 27.2M ounces in the Inferred category (up from 21.6M ounces). These are nice increases, but the real news was the extent of the increase in the high-grade portion of the resource.
PVG had previously identified a high-grade component -- suitable for underground mining -- comprising 903K ounces M&I plus 1.9M ounces Inferred. The new high-grade component comprises 5.1M ounces M&I (up 460%) plus 3.3M ounces Inferred (up 70%). In other words, total high-grade resources increased by 200%. Moreover, the average grade of the high-grade resource more than doubled to around 20 g/t.
These are blowout numbers. Everyone knew a resource upgrade was coming, but the extent of the upgrade was a big positive surprise. The stock price naturally jumped in response to the news.
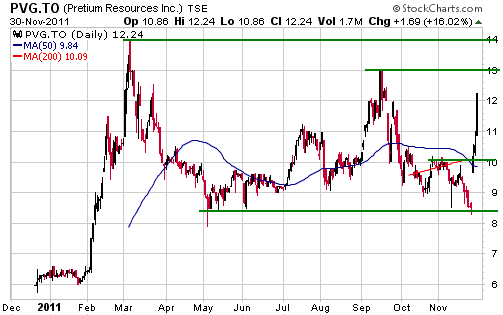
We think that PVG would offer at least as much value at around C$10.40/share today as it did when it entered the TSI Stocks List at C$6.40/share early this year. The reason is that this year's drilling campaign has added more than $4/share of value. It's called wealth creation, and PVG's senior management is apparently very good at it.
There will be more market-moving news from PVG over the next few months, including an updated Preliminary Economic Assessment (PEA) for the Brucejack high-grade project -- to incorporate the new resource estimate -- during Q1-2012. If the PEA is positive (it will be) then PVG's management will skip the pre-Feasibility Study (PFS) and immediately begin work on a full FS.
If you currently don't have a full position, we suggest waiting for a partial retracement of this week's surge before doing any new buying. There will possibly be an opportunity to buy at around $10/share within the next couple of months.
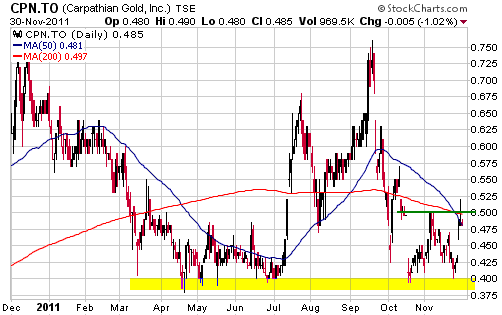
Carpathian Gold (TSX: CPN). Shares: 546M issued, 592M fully diluted as at Dec 2011 (incl. Dec-2011 financing). Recent price: C$0.48
In the 19 October Interim Update we wrote:
"There was some very unexpected bad news from CPN on Tuesday. The company had earlier been granted the Ad Referendum Licence to Install (AR LI) for its RDM gold project in Brazil, but on Tuesday it was announced that COPAM, one of the Brazilian environmental authorities having jurisdiction over the RDM project, had attached a condition to the AR LI. The condition is that CPN must not start any installation work on the project until the AR LI is ratified by COPAM, pending its further review of technical documents.
The newly imposed condition might not have a significant effect on project development, but it does create uncertainty and risk. Furthermore, it immediately affected the company's per-share value by causing an equity financing to be re-priced. Rather than raising $40M by issuing 80M new shares at C$0.50/share, CPN will now be raising $40M by issuing 100M new shares at C$0.40/share."
A press release on Monday 28 November reported that the above-mentioned licence (the AR LI) had been ratified by COPAM, thus enabling CPN to re-proceed with mine construction. This is obviously good news, but as a consequence of COPAM's intervention CPN suffered stock dilution and delays that have reduced our estimate of the company's per-share value by about 10%.
Our current valuation-based target for the stock is C$1.00. This means that there is still a lot of upside potential from the current price of C$0.48, but we would prefer to buy following a pullback to near the recent financing price of C$0.40.
Batero Gold (TSXV: BAT). Recent price: C$2.16
BAT confirmed on Wednesday that the initial resource estimate for its Batero-Quinchia project will be complete by the end of the year and reported in January. It could make sense for speculators to accumulate shares in the low-C$2 area ahead of the resource announcement.
BAT is in the TSI Small Stocks Watch List.
Clifton Star Resources (TSXV: CFO)
As far as we know, nothing has changed since our 31st October update. If a significant new development does occur we will, of course, report it at
TSI.
Chart Sources
Charts appearing in today's commentary
are courtesy of:
http://stockcharts.com/index.html

|
