![]()
![]()
![]()
![]()
- Interim Update 30th November 2016
Copyright
Reminder
The commentaries that appear at TSI
may not be distributed, in full or in part, without our written permission.
In particular, please note that the posting of extracts from TSI commentaries
at other web sites or providing links to TSI commentaries at other web
sites (for example, at discussion boards) without our written permission
is prohibited.
We reserve the right to immediately
terminate the subscription of any TSI subscriber who distributes the TSI
commentaries without our written permission.
The Oil Market
Anticipation of and then
reaction to the outcome of an OPEC meeting caused significant two-way
volatility in the oil price over the past few days, with oil first
dropping back to its 200-day MA due to scepticism that the OPEC members
would manage to strike a deal on production cuts and then rising sharply
after it was announced that a production-cut deal had been done. The
volatility hasn't, however, altered the price pattern.
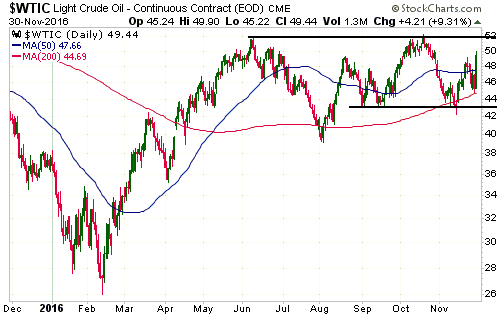
This week's OPEC news actually hasn't changed anything. To avoid
losing its remaining credibility OPEC had to announce some sort of
production-cut deal, but the deal that has been announced probably won't
have a significant effect on overall oil supply even in the unlikely event
that all parties to the deal meet their commitments. The reality is that
OPEC is no longer the swing producer in the oil market. That honour now
belongs to the US shale-oil industry.
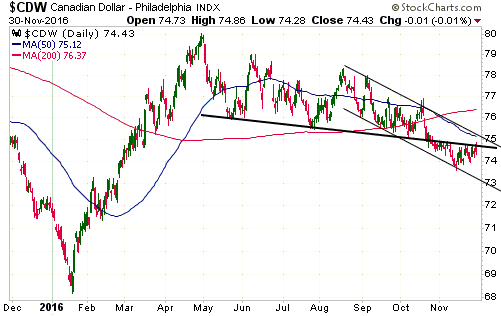
In any case, the currency
market is the most important driver of the oil market and the currency
market continues to point to a lower oil price. Of particular
significance, the C$ has done nothing to suggest that its short-term
downward trend is over.
The C$ would have to achieve a daily close
above 75.25 to generate the first sign of an upward reversal in its
short-term trend.
We view the OPEC-inspired price surge as an opportunity to buy some
more USO put options, both as a speculation and a way of hedging long
exposure to commodity-related equities.
The Treasury Market
The following daily chart shows
that the iShares 20+ Year Treasury Bond ETF (TLT) has not yet begun to
rebound from its 'oversold' extreme, although it lost downward momentum a
couple of weeks ago and is possibly building a base.
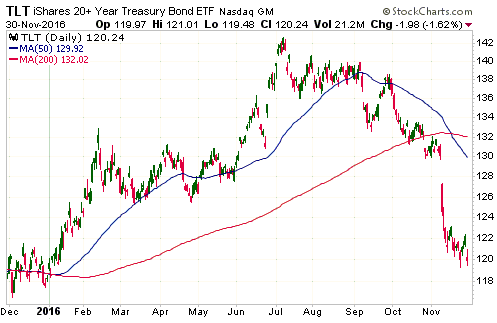
The on-going weakness in the Treasury Bond is the main obstacle to a
short-term rebound in the gold price. It will be difficult for the gold
price to manage anything more than a modest multi-day bounce until the
T-Bond price reverses upward.
The Stock Market
The NASDAQ100 Index (NDX) tested
its September-October highs on Tuesday of this week and then pulled back
on Wednesday. It has therefore still not confirmed the breaks to new highs
by other important US stock indices.
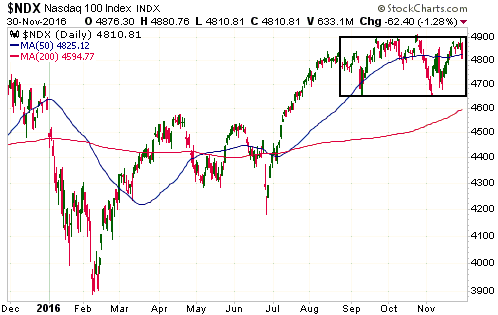
We expect at least a 6-month extension of the equity bull market, but
at the same time we expect a significant 1-2 month correction.
Gold and the Dollar
Gold
Gold and Inflation Expectations
We've covered the relationship between the gold price and inflation
expectations in many TSI commentaries over the years, but it now makes
sense to revisit the topic. This is because a sharp rise in inflation
expectations since mid-September went hand-in-hand with a sharp decline in
the gold price. According to conventional wisdom, this is not supposed to
happen. A sharp rise in inflation expectations is supposed to be bullish
for gold.
In the financial markets it's not unusual for
"conventional wisdom" to be wrong, although in this case it is not so much
wrong as incomplete. It is certainly the case that all else remaining the
same, an increase in inflation expectations will be bullish for gold.
However, all else never remains the same.
Here is a more complete
and correct statement of the relationship between gold and inflation
expectations: It is bullish for gold when inflation expectations rise
relative to nominal interest rates and bearish for gold when inflation
expectations fall relative to nominal interest rates, regardless of
whether inflation expectations are rising or falling in absolute terms.
With the aforementioned statement of the relationship in mind, let's
take a look at what happened in the recent past.
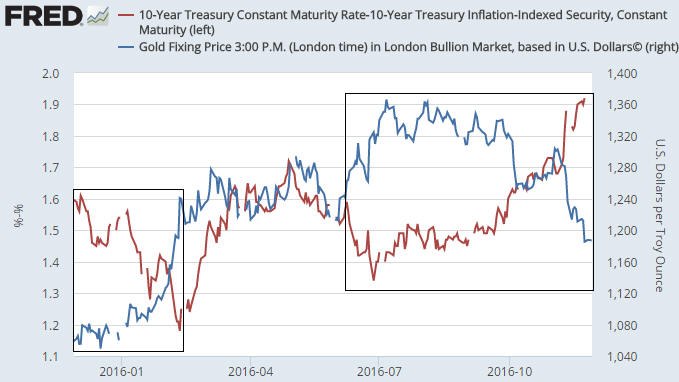
The following
chart shows the gold price (the blue line) and the yield difference
between the 10-year T-Note and the 10-year Treasury Inflation-Protected
Security (TIPS). We refer to this yield difference as the "Expected CPI",
because it is the average annual rate of CPI growth that the market
expects the US government to report over the next several years. Although
almost everyone knows that the CPI tends to understate the rate of
currency depreciation, the Expected CPI is a useful proxy for the
financial markets' inflation expectations.
If gold consistently
performed well during periods of rising inflation expectations and poorly
during periods of falling inflation expectations then the two lines on the
following chart would move in the same direction almost all of the time.
However, over the past 12 months they have actually spent more time moving
in opposite directions than moving in the same direction. It is especially
noteworthy that sharp declines in inflation expectations during the first
6 weeks of the year and during June were accompanied by a strong gold
market and that a sharp rise in inflation expectations since
late-September has been accompanied by a weak gold market.
It is
therefore fair to say that changes in inflation expectations cannot
explain gold's performance over the past 12 months.
Gold's performance over the past 12 months can, however, be explained
by changes in the nominal 10-year yield minus the Expected CPI. The
difference between these quantities is the 10-year TIPS yield, a proxy for
the real interest rate.
The following chart shows the gold price
(the blue line) and the above-mentioned proxy for the real interest rate.
Notice that a) the gold price has consistently trended in the opposite
direction to the real interest rate, b) the gold price traced out a
topping pattern and the real interest rate traced out a bottoming pattern
from early-July through to late-September, and c) the sharp decline in the
gold price from late-September through to the end of last week coincided
with a sharp rise in the real interest rate.
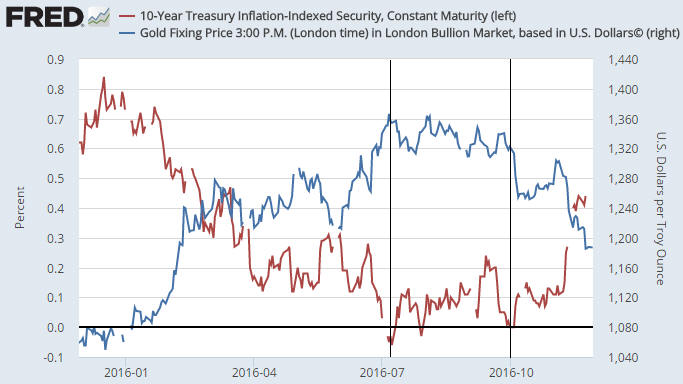
The upshot is that the gold market was very weak in the face of
sharply-rising inflation expectations over the past two months because
nominal interest rates rose even faster than inflation expectations,
leading to a higher real interest rate.
Current Market Situation
With the T-Bond remaining weak and
the Dollar Index remaining strong it is not surprising that the US$ gold
price has not yet managed a rebound of any significance. However, we
continue to anticipate a short-term rebound, mainly due to the extent to
which the gold market and the markets that exert the greatest influence on
the gold price are stretched on a short-term basis.
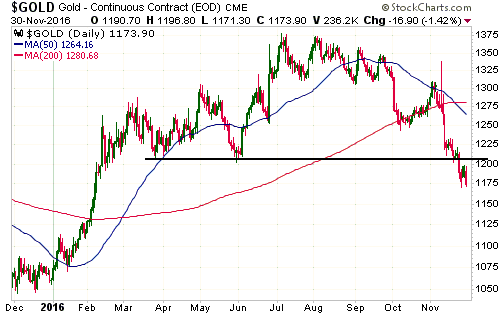
As noted in the latest Weekly Update:
"A rebound could
begin as soon as this week and probably won't begin any later than
mid-December (within a few days of the 14th December FOMC announcement),
but for a rebound to have longer-term significance it must, at a minimum,
achieve a weekly close above $1210. It must also be accompanied by a
fundamental shift in gold's favour."
As also noted in the
latest Weekly Update, the Commitments of Traders (COT) report that gets
published at the end of this week will be very interesting in that it will
reveal the effects on speculative sentiment of gold's break below $1200.
The larger the decline in the speculative net-long position in reaction to
the break below $1200, the more constructive (for the bullish case) it
will be.
Gold's COT situation will of course be covered in the next
Weekly Update.
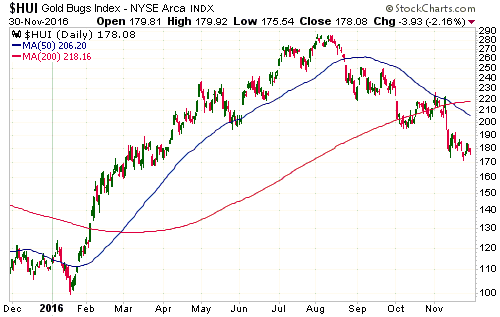
Gold Stocks
Aside from the
fact that the gold-mining indices have continued to show subtle signs of
strength relative to gold, nothing of significance happened over the first
three days of this week.
Over the past three days the HUI traded in
a narrow range near its low. This price action could be part of a small
base prior to a multi-week rally or it could be a consolidation prior to a
plunge below the 14th November low. We suspect it's the former, but we
aren't betting on any particular short-term outcome for this sector.
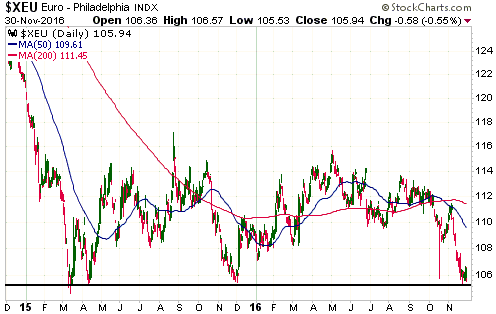
The Currency Market
The euro is still holding the line
The euro remains
precariously positioned slightly above major support as two important
political events and one important monetary event loom in Europe.
The two important political events are a referendum in Italy and a
presidential election re-run in Austria (the results of the Austrian
presidential election early this year were thrown out due to counting
irregularities), both of which are scheduled for Sunday 3rd December.
Italy's referendum is about the changes to the size and power of the
Senate (the upper house of parliament). A "yes" result, which would reduce
the Senate's size and power, has been vigorously advocated by Italy's
Prime Minister Renzi.
The polls point to a "no" result, but not
decisively. The outcome is therefore 'up in the air', especially
considering the poor recent track record of the political polling
industry.
A "no" result could -- but not necessarily will -- prompt
Renzi to resign, thus superficially making Italy's political situation
less stable.
The polls are also not decisive with regard to the
likely winner of Austria's presidential election, although the Freedom
Party's Hofer has a small lead. From the little we know about the
situation, the Freedom Party appears to be more anti-immigration than
pro-freedom. Austria's presidential election could therefore be viewed as
a referendum on the EU policy that allowed hundreds of thousands of
Middle-Eastern immigrants into Europe over the past two years.
The
outcomes of these political events could create currency-market volatility
next week, but it should be understood that regardless of the outcomes the
probability of either country leaving the EU within the coming 12 months
will be close to zero (zero in the case of Austria, slightly above zero in
the case of Italy).
The important monetary event is the ECB meeting
scheduled for next Thursday (8th December). It's likely that the ECB will
announce an extension of its asset monetisation program at the conclusion
of this meeting, thus highlighting the contrast with a Federal Reserve
that is set to take a tiny step towards a tighter monetary stance a week
later.
In the euro's favour are its 'oversold' condition and the
fact that almost everyone expects a rate hike from the Fed and extended
monetary easing from the ECB. This could enable the euro to rebound from
support over the weeks ahead regardless of the events mentioned above,
although we think it's too risky to bet on a euro rebound at this time.
The Chinese Yuan continues to slide
The first of the following charts shows the performance of the
Yuan/US$ exchange rate over the past 10 years using monthly average
prices. The second of the following charts zooms in on the Yuan's
shorter-term performance using daily closing prices.
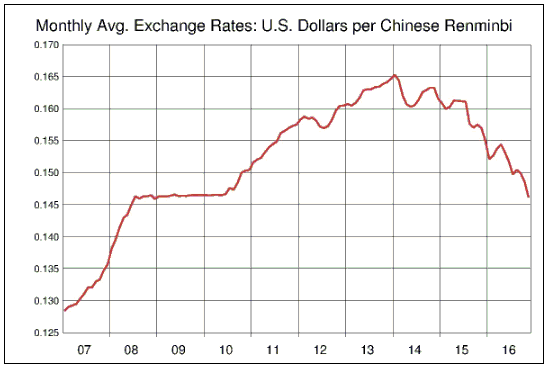
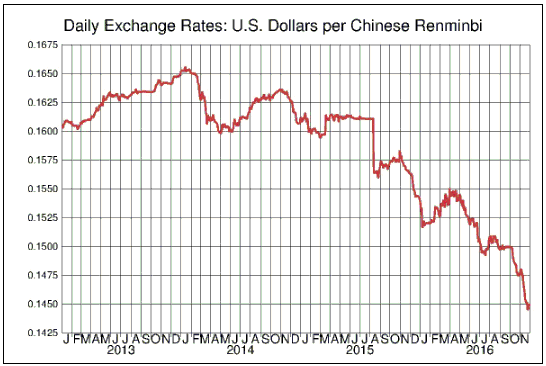
Chart source: Pacific Exchange
Rate Service
The Yuan has been weak relative to the US$ for
almost 3 years. This weakness was predictable based on the Yuan's
over-valuation and will probably persist for many more months. What hasn't
been predictable is the financial-world's reaction to the Yuan's most
recent bouts of weakness.
We are referring to the fact that the
financial world outside China pretty much ignored the sharp declines in
Yuan/US$ that occurred during May-July and over the past two months.
Pronounced weakness in the Yuan was widely viewed as very important last
year, but this year it has generally been viewed as irrelevant.
China's government, however, is worried by the relentless decline of its
currency. It has been selling-off its US$-denominated reserves to offset
the downward pressure on the Yuan resulting from capital outflows and is
now
readying new restrictions on outbound foreign investment in an effort
to relieve the downward pressure.
This strikes us as a significant
short-term threat to stock and bond markets in the major economies, with
stocks being at greater short-term risk due to being 'overbought'.
Updates on Stock Selections
Notes: 1) To review the complete list of current TSI stock selections, logon at
http://www.speculative-investor.com/new/market_logon.asp
and then click on "Stock Selections" in the menu. When at the Stock
Selections page, click on a stock's symbol to bring-up an archive of
our comments on the stock in question. 2) The Small Stock Watch List is
located at http://www.speculative-investor.com/new/smallstockwatch.html
Chart Sources
Charts appearing in today's commentary
are courtesy of:
http://stockcharts.com/index.html
http://research.stlouisfed.org/
![]()