|
- Interim Update 31st January 2007
Copyright
Reminder
The commentaries that appear at TSI
may not be distributed, in full or in part, without our written permission.
In particular, please note that the posting of extracts from TSI commentaries
at other web sites or providing links to TSI commentaries at other web
sites (for example, at discussion boards) without our written permission
is prohibited.
We reserve the right to immediately
terminate the subscription of any TSI subscriber who distributes the TSI
commentaries without our written permission.
The Global Savings Glut
One of the silliest ideas floating around is that there's a global savings glut.
To appreciate why it is such a silly idea it's first necessary to
understand that savings and money are two different things. When
someone saves they are not saving money; they are saving purchasing
power. Or, to put it another way, saving X dollars is meaningless; it's
what the X dollars can buy that's important. For example, if you have a
million dollars in the bank and that million dollars can buy a luxury
home then you have, in effect, saved the equivalent of a luxury home.
However, if the dollar has been devalued by inflation to the point
where an ice-cream cone costs one million dollars, then all you've
saved is the equivalent of an ice-cream cone.
Therefore, to say that there's a global savings glut is like saying
there's too much purchasing power in the world, which is, in effect,
like saying there's too much wealth. This is something that can never
happen in a world where valuable resources cannot be conjured out of
thin air; in the real world, that is.
A good way to explain what's really happening is to consider the
topical example of the so-called savings glut within the oil-exporting
part of the world. If a country produces 1M barrels of oil per day in
excess of its own needs then what it is saving is 1M barrels of oil per
day, or the purchasing power equivalent of 1M barrels of oil per day.
And as long as it continues to produce 1M barrels of oil per day in
excess of its own needs then its real savings rate will not increase
unless the purchasing power (real price) of a barrel of oil increases.
So, what has happened to the real price of oil over the years?
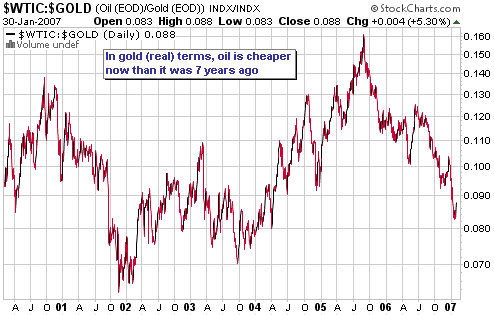
One way of determining the real price of oil is to divide the US$ price
of oil by the US$ gold price, thus removing the US$ from the equation.
When we do this and chart the result (see below) we find that the real
price of oil today is a bit LESS than it was 7 years ago. This tells us
that the only way an oil-producing nation could have increased its real
savings rate over the past 7 years is by increasing its production,
which, given that there has not been a large increase in production,
tells us that the dramatic increase over the past few years in the
amount of money flowing towards oil-producing nations is the result of
a money glut.
The problem is that too much new money has been created, thus causing
the value of money to fall relative to the value of scarce commodities
such as oil and gold. There is not, nor can there ever be, a global
savings glut.
The Stock Market
Current Market Situation
At the end of last week the senior US stock indices were positioned
such that a modest decline over the first three trading days of this
week would have resulted in monthly reversals to the downside. However,
they failed to provide this -- or any other new -- bearish evidence.
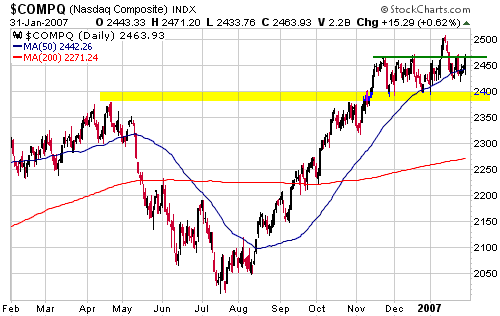
But with this week's rebound taking the NASDAQ Composite no further
than resistance in the 2460s (see chart below), they have also failed
to provide any new bullish evidence.
The most noteworthy
move over the past few days came from the Dow Transportation Average.
The "Transports" broke a sequence of declining tops and appear to be on
their way to new all-time highs, thus generating a bullish signal under
Dow Theory.
As we've noted on two prior occasions over the past few months, just as
a bearish Dow Theory signal in October of 2002 ended up marking the
bottom of the 2000-2002 cyclical bear market it's quite possible that a
bullish Dow Theory signal will end up marking the top of the 2002-2007
cyclical bull market. We wouldn't, however, be making any bearish bets
at this time in anticipation of such an outcome. Right now it makes
sense to be 'long' selected gold and commodity stocks, and to have a
sizeable cash reserve. It does not make sense to be short.
Our favoured outcome
is that the NASDAQ Composite and NASDAQ100 Indices made
intermediate-term peaks in January and that most other indices will
make intermediate-term peaks within the coming 3 months.
Gold and
the Dollar
Is the huge US debt a negative for the US$?
Bears on the US dollar often attempt to substantiate their negativity
by citing the huge US private and public sector debt levels. But
although it can reasonably be argued that an excessively high level of
debt is an economic negative, does it automatically follow that it is a
currency negative?
The short answer is no; economic negatives in general and high debt
levels in particular do not necessarily lead to currency weakness.
The long answer begins with the premise that the exchange rate between
two currencies is determined by the supply of and the demand for one
currency relative to the supply of and the demand for the other
currency. Demand-related factors tend to dominate over timeframes of up
to around 3 years, whereas over longer time periods the rate of
exchange between two currencies will usually be dominated by relative
inflation (money-supply growth) rates.
One factor that will have an effect on the demand for one currency
relative to another is relative economic strength. Unfortunately, many
analysts stop here and assume that the currency of Country A will be
strong relative to the currency of Country B simply because Country A's
economy is stronger than Country B's. However, while a relatively
strong economy sometimes leads to greater demand for the associated
currency (and, consequently, a higher exchange value for that
currency), a lot of capital gets shifted around the globe based on REAL
interest rate differentials. That is, the direction of capital flow
will often be determined by the real interest rate offered by a
currency relative to the real interest rate offered by another
currency. And the real interest rate is, in turn, determined by both
the nominal interest rate and the expected rate of purchasing power
reduction.
So, although the nominal interest rate is likely to be higher in the
country with the stronger economy it is quite possible for this nominal
interest rate advantage to be more than offset by differences in the
rates at which traders/investors EXPECT each currency to lose
purchasing power.
Further to the above, it's not appropriate to blindly assume that a weaker economy leads to a weaker currency.
Moving along, a build-up of debt will put downward pressure on a
currency to the extent that the debt involves the creation of new
currency units; that is, to the extent that it increases the currency
supply. However, every new debt -- even one that results in new
currency units being borrowed into existence -- establishes a future
demand for the currency due to the obligation to repay the debt.
Furthermore, the total repayment commitment will always be greater than
the amount originally borrowed because the future repayment obligation
comprises principal and interest. As a result, the long-term increase
in currency demand due to a new debt will generally be greater than the
associated near-term addition to currency supply. All else being equal,
therefore, an increase in debt will tend to put UPWARD, not downward,
pressure on the currency over the long-term because higher debt today
leads to higher currency demand tomorrow. But as we'll explain below,
all else is not equal.
Some analysts have argued that the huge dollar-denominated debt burden
represents a massive short position on the dollar; the implication
being that this short position will need to be at least partially
covered at some point and when the short-covering process (the debt
reduction process) begins in earnest the dollar will become a strong
currency. This would be a reasonable argument if not for the extreme
likelihood that the aforementioned short-covering process will never
actually occur. Instead, it's far more likely that the short position
will continue to grow...and grow...and grow... until the current
monetary system ceases to exist.
The so-called dollar short position can be likened to the short
position in the stock of a company where the company's management has
promised to issue enough new shares every year -- as many new shares as
it takes -- to prevent the share price from ever embarking on a major
upward trend. In the dollar's case, it is a virtual certainty that the
US Government and the Fed will work together to ensure that the
creation of new dollars proceeds at a fast enough pace to more than
offset any increase in dollar demand stemming from the need/desire to
repay debt. The most likely end result of the so-called short position
represented by today's high debt levels is therefore -- you guessed it
-- more inflation.
There are, of course, limits on how much money the private sector can
borrow into existence, but there are no such limits on the government.
Under an irredeemable paper currency system the government can rack-up
obligations ad infinitum as long as the obligations are denominated in
terms of its own currency. This is because the central bank stands
ready, willing and able to monetise all government debt should the need
arise. Eventually the government will run into a practical limitation
of sorts in that the financial markets will begin factoring a large
amount of future currency depreciation into current bond and gold
prices, but let's get to that point -- the point where gold is trading
well into 4 digits, bond yields are in double digits and the voting
public has become sufficiently angered by what the government has done
to its money to demand a major change -- before we start worrying about
what comes after the inflation.
The bottom line is that today's high US debt level is a negative for
the dollar, but only because it pretty much guarantees more inflation.
It may not, however, result in a lower dollar relative to other fiat
currencies because these other currencies generally face similar
issues.
All the world's paper currencies -- the US$, the euro, the British
Pound, the Yen, etc. -- are effectively involved in a race toward zero.
A few years ago the dollar was well ahead in this race, but other
currencies have since caught up and are beginning to pull ahead.
Therefore, the additional US$ inflation that will most likely occur in
response to today's high US debt levels might not lead to a weaker
dollar relative to the dollar's fiat currency counterparts. It's a very
good bet, though, that it will lead to a weaker dollar relative to gold.
Currency and Bond Market Updates
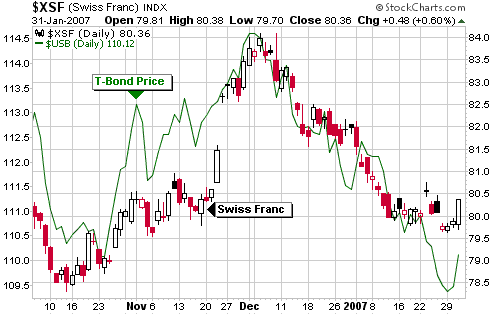
We mentioned in previous commentaries that the US$ and US Treasury Bond
futures began trending in opposite directions last October. This
relationship is more likely to be coincidental than causal and can't be
relied upon to continue for much longer. However, the following chart
comparison of the Swiss Franc and the T-Bond shows that the
relationship remains in effect at this time (the strong inverse
correlation between US bonds and the US dollar over the past 4 months
translates to a strong positive correlation between US bonds and the
Swiss Franc).
In the latest Weekly
Market Update we explained why we were upgrading our short-term bond
market outlook from "bearish" to "neutral". We've also recently said
that we were expecting a pullback in the Dollar Index to test last
December's low.
Given that the inverse relationship between the US$ and US bonds is
still in effect, a significant pullback by the dollar is likely to be
accompanied by a decent rebound in the bond market. There's a
reasonable chance that both of these markets will spike to new 2-month
extremes -- a new high for the US$ and a new low for bonds -- prior to
reversals taking place, particularly if Friday's data on the US
employment situation proves to be stronger than expected. However,
Wednesday's market reaction to the Fed's latest monetary policy
statement could be a sign that a dollar pullback and a coincidental
bond rally have already begun. This is a possibility worth considering
because the Fed did nothing and essentially said nothing that shouldn't
have already been priced into the markets, and yet the markets
responded by taking the dollar down and pushing bonds up. Our view is
that trends almost never change in response to news, but the market
reaction to news will often provide information on the direction of the
underlying trend.
In summary, we think a bond rebound and a dollar pullback have either just begun or will begin within the coming week or so.
Gold
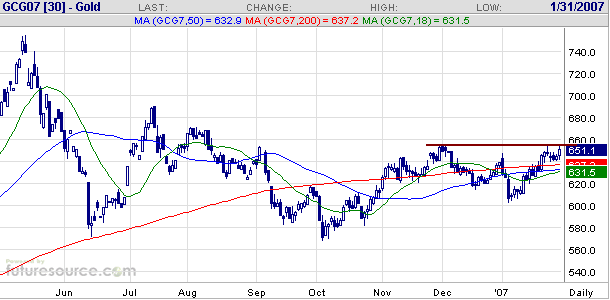
The following daily chart shows that February gold futures tested
resistance in the high-650s again on Wednesday. Until this resistance
is overcome on a daily closing basis the possibility of a pullback to
the 630s will remain alive.
With or without such a pullback, we continue to anticipate a move up to the $690-$750 range within the next couple of months.
Gold Stocks
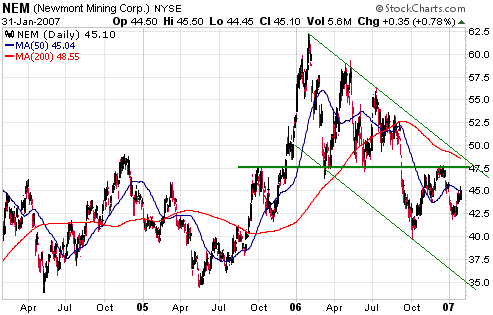
Charts such as the following are one reason we don't think there's a
lot of downside risk in the gold sector at this time. The chart shows
that Newmont Mining (NEM) has been consolidating for 12 months and is
clearly oversold, reflecting a general lack of enthusiasm for gold
stocks.
Important resistance at $47.50 lies about 5% above Wednesday's closing
price. There's a good chance that the stock will test this resistance
within the next few weeks, and if it manages to break through then the
technical objective will be around $60.
NEM, like some other
major gold mining companies, produces copper in addition to gold.
However, unlike some other high-profile gold producers -- Goldcorp and
Barrick Gold, for instance -- Newmont did not gain any benefit from the
huge run-up in the copper price because its management had previously
forward-sold several years of the company's copper production at
1990s-style prices. As a result, Newmont became a laggard once gold
started to perform poorly relative to industrial metals such as copper.
In fact, in addition to lagging behind the stocks of some other major
gold producers it began to trend lower relative to gold bullion.
Newmont's problem, in a nutshell, was that its profit margin was being
squeezed because its costs were rising as fast or faster than the gold
price; and, having locked-in a very low price for its copper
production, it was unable to use its copper-related revenue to offset
these cost increases.
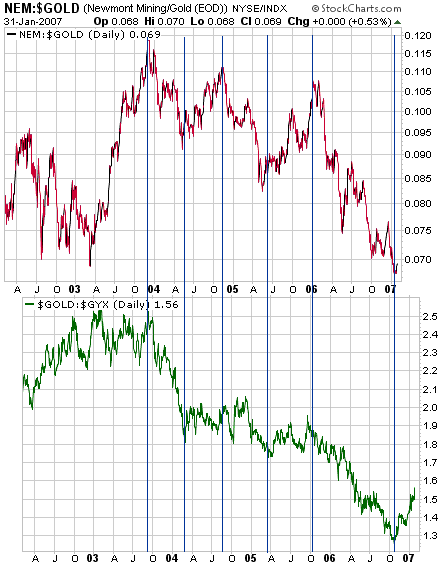
NEM's predicament is illustrated by the following chart-based
comparison of the NEM/gold ratio and the gold/GYX ratio (gold relative
to a basket of industrial metals). The chart shows that as gold has
trended lower relative to industrial metals Newmont has trended lower
relative to gold.
The chart comparison also shows that a) over the past three years the
NEM/gold ratio has consistently followed the gold/GYX ratio with a lag
of around 2-3 months (the charts have been offset by this amount to
account for this lead-lag relationship), and b) the strongest gold/GYX
rally in more than three years commenced last October. That is, the
chart shows that NEM is likely to trend higher relative to gold over
the next few months.
As a long-term
investment we much prefer gold bullion to Newmont Mining. However, the
stage now appears to be set for NEM to be strong relative to gold for a
while on the back of gold's own strength relative to industrial metals.
The same, by the way, applies to gold stocks in general; we're just
using NEM in this discussion because its performance over the past few
years so clearly demonstrates the problem for gold miners caused by
weakness in gold relative to other commodities.
On a side note, NEM's financial results should be given a boost over
the next several months by virtue of the fact that the last of its
copper hedges are due to expire this month. This means that even if the
copper price drops to around $2/pound NEM will soon start getting a
much higher price for its copper production than it has been getting up
until now.
Update
on Stock Selections
(Note: To review the complete list of current TSI stock selections, logon at http://www.speculative-investor.com/new/market_logon.asp
and then click on "Stock Selections" in the menu. When at the Stock
Selections page, click on a stock's symbol to bring-up an archive of our comments on the stock in question)
 USEC Inc. (NYSE: USU). Shares: 87M. Recent price: US$13.56 USEC Inc. (NYSE: USU). Shares: 87M. Recent price: US$13.56
Our most recent buy recommendations for USEC, America's only uranium
enrichment company, were in the 18th September and 7th August 2006
Weekly Market Updates when the stock was trading at US$9.38 and
US$10.06, respectively. The stock closed at US$13.56 on Wednesday, but
despite the price gain over the past few months its valuation remains
very low. To be specific, the stock currently has a price/sales ratio
of 0.64 and a price/earnings ratio of 10.7. Furthermore, the
price/earnings ratio would be only 5.6 had the company capitalised,
rather than expensed against current income, the costs incurred over
the past year in the development of its new uranium enrichment plant
(the American Centrifuge project).
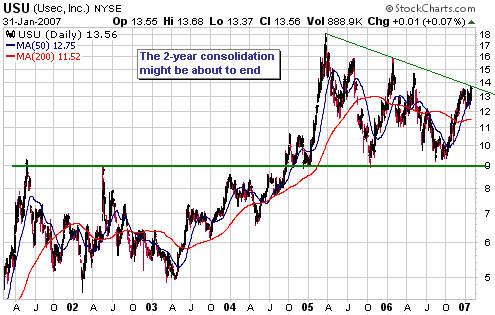
Potential delays and cost overruns associated with the American
Centrifuge development are an on-going risk, but this risk was
certainly fully discounted when the stock was testing long-term support
in the $9-$10 range last year (see chart below). And given the low
valuation there is obviously still considerable risk priced into the
stock, which, of course, reduces the investment risk (when you buy a
stock it's the risk that isn't already factored in that can end up
hurting you).
If USU can break above the declining tops pattern that dates back to
the first quarter of 2005 then it will create a technical target in the
low-20s and could work well as an intermediate-term trade. However, we
think it is best suited to being a long-term investment. The company
should experience explosive growth in per-share cash flow and profit
once the American Centrifuge is put into operation, but this is not
going to happen until around 2011. The stock market will probably start
discounting this earnings growth years before it actually occurs, but
USU shareholders might still need to have a lot of patience.
 Lion Selection Group (ASX: LSG). Shares: 100M. Recent price: A$1.73 Lion Selection Group (ASX: LSG). Shares: 100M. Recent price: A$1.73
LSG is an Australian-based company that invests in small mining
companies, typically by financing them in exchange for equity. It is
presently defined as a Pooled Development Fund (PDF), which provides
tax benefits but also imposes certain constraints on the investments
that can be made. To increase its investment flexibility and size it is
considering foregoing its PDF status and merging with AuSelect (ASX:
AUS), another investment company under the same management. In our
opinion this would be a positive development.
LSG's policy is to payout a large chunk of realised capital gains to
shareholders, and in this vain it has paid A$0.38 in dividends over the
past two months.
We view LSG as a conservative way to gain exposure to exploration-stage
resource stocks. It is, in effect, a well-managed portfolio of stocks
rather than a single stock. It is therefore less risky and tends to be
less volatile than the typical junior mining stock. Furthermore, at the
current time it is trading at a discount of around 10% to its Net Asset
Value (NAV).
Canada-based Endeavour Mining Capital (TSX: EDV) is a similar type of
stock to LSG in that it provides financing to small mining companies in
exchange for equity, although it tends to be more volatile and doesn't
pay large dividends (EDV's realised gains are generally re-invested).
EDV is also currently trading at a discount of around 10% to its NAV
and would be a suitable candidate for new buying on weakness.
Chart Sources
Charts appearing in today's commentary
are courtesy of:
http://stockcharts.com/index.html
http://www.futuresource.com/

|

