|
- Interim Update 31st March 2004
Copyright
Reminder
The commentaries that appear at TSI
may not be distributed, in full or in part, without our written permission.
In particular, please note that the posting of extracts from TSI commentaries
at other web sites or providing links to TSI commentaries at other web
sites (for example, at discussion boards) without our written permission
is prohibited.
We reserve the right to immediately
terminate the subscription of any TSI subscriber who distributes the TSI
commentaries without our written permission.
The US
Stock Market
The Employment Report
We almost never speculate on how the
market is going to react to any economic report because the economic reports
are generally irrelevant as far as the stock market's trend is concerned.
What generally happens is that there is a knee-jerk market reaction to
an economic report that can last minutes or hours or, in extreme cases,
1-2 days, but then the market goes back to doing what it would have done
in the absence of the report. This is because the market is forward-looking
whereas almost all the economic reports are backward-looking. As such,
anyone who thinks that the stock market's performance is determined by
the latest economic news will rarely be able to make much sense of the
market.
Currently, there's a lot of speculation
as to what this Friday's Employment Report will say and how the market
will react. And the market's reaction to this next report will actually
be more interesting than is usually the case -- which is why we are bothering
to mention it -- because it is hard to figure out whether the stock market
would respond more favourably to data showing weak employment growth or
data showing strong growth. The consensus view is probably that the stock
market would view a strong report more favourably than a weak one, but
a weak report would increase the pressure on the Fed to hold short-term
rates at the current low level and might therefore be seen as a positive.
A very strong report, on the other hand, could cause the market to anticipate
an earlier rate hike and might therefore be viewed negatively.
Either way, we doubt that the employment
report will change any trends; so while Friday has the potential to be
a very volatile session we expect that by Tuesday of next week the market
will be back to doing what it would have been doing anyway.
Current Market Situation
Over the past two months there has
been a noticeable shift away from the more risky investments towards those
that are perceived to offer greater safety. Examples of this shift away
from risk include a downturn in the NDX/Dow ratio, relative weakness in
some emerging market currencies, and a modest widening of credit spreads.
However, while this shift could be a sign that a major trend change is
underway, we haven't yet seen much evidence in the price action of the
US stock market to suggest that the recent set-back was anything more than
a correction within an on-going upward trend. There have certainly been
some bearish divergences, such as the failure of both the NDX and the Transportation
Average to confirm the February high in the Dow, but the price action of
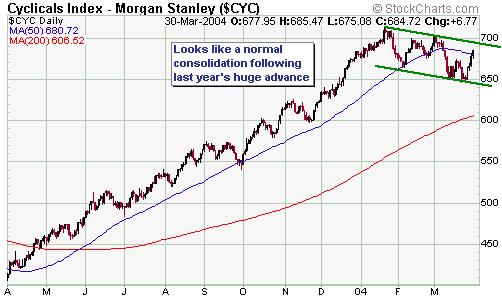
many important sub-indices has the appearance of a routine consolidation.
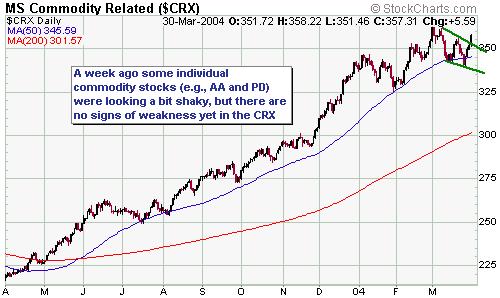
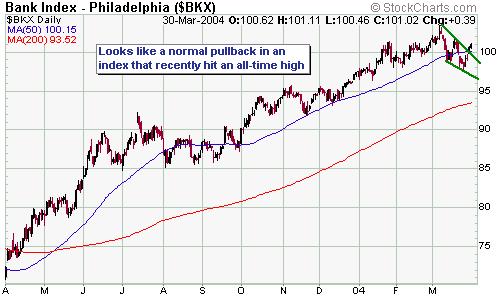
The below charts of the Morgan Stanley Cyclicals Index (CYC), the Morgan
Stanley Commodity Related Equities Index (CRX) and the Philadelphia Bank
Index (BKX) are good examples of what we mean by this.
By the way, it is typical for different
sectors of the market to peak at different times, so the fact that the
Commodity-Related Stocks Index (CRX) appears likely to make a new high
over the next 1-2 months doesn't preclude the possibility that a peak is
already in place for the Semiconductor Index.
We think that a topping process is
underway in the stock market, with different sectors peaking at different
times, but this view will have to be confirmed by the price action of the
senior stock indices (the Dow Industrials Index, the S&P500 Index and
the NASDAQ100 Index) before it is worth the cyberspace it is printed on.
And as things presently stand, only one of these indices -- the NASDAQ100
-- is in a position where it could soon confirm a top.
Persuasive evidence that a top were
already in place for the NASDAQ100 Index would be provided by a drop below
last week's low. Conversely, evidence that a top was NOT yet in place would
be provided by a move, by this index, above its initial pullback low. What
we see as the important 'confirmation levels' for the NDX are shown on
the below chart.
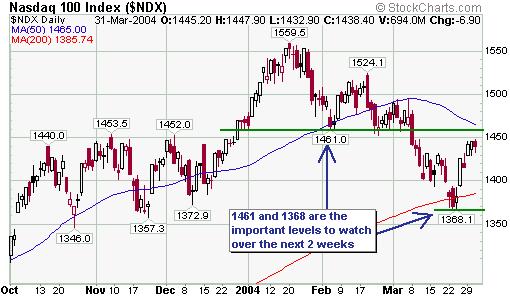
Our short-term view has been that the
stock market would rally during April and possibly May, with the NDX making
a lower high while the S&P500 made a new recovery high. A daily close
above 1461 for the NDX would, however, cause us to re-think this view (a
close above 1461 by the NDX over the coming few days would probably shift
the odds in favour of this index also moving to a new recovery high during
April-May).
With the NDX having reversed lower
from just below important resistance on Wednesday we see no reason to make
any changes to our small bearish position (USPIX + Dow put options) at
this time.
Gold and
the Dollar
Targets for gold and gold stocks
In recent commentaries we've discussed
the gold price in terms of euro. Just to recap: the euro gold price appears
to be in the process of completing a large head-and-shoulders bottom that
would create a technical target of around 390 euros once an upside breakout
occurs. The 390 level also happens to roughly correspond to the top of
a 5-year upward-sloping channel and thus appears to be a reasonable intermediate-term
target for the euro gold price. The bottom line is that gold's price action
in terms of the euro looks bullish as far as the next several months are
concerned.
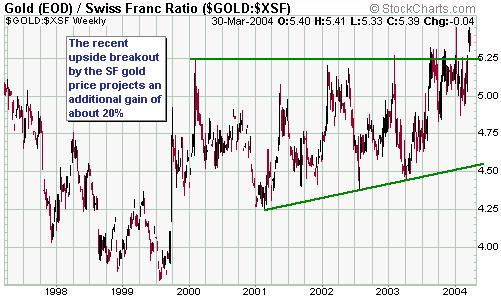
The gold price in terms of the Swiss
Franc also looks bullish. In Swiss Franc terms gold has recently broken
out from a 4-year consolidation pattern (refer to the weekly chart below),
and in doing so it has created a technical target of around 635.
At current exchange rates a euro gold
price of 390 and a Swiss Franc gold price of 635 correspond to US$ gold
prices of $480 and $500, respectively. Considering that any sizeable rally
in the gold price would most likely occur in parallel with STRENGTH in
the European currencies relative to the US$, 480-500 would appear to be
a CONSERVATIVE intermediate-term upside target range for the US$ gold price.
If the aforementioned $480-$500 range
proved to be in the right ballpark, what would this mean for gold stocks?
The answer is: it would depend, to
a large extent, on what was happening in the general stock market at the
time. For example, if the stock market were dropping like a rock while
the gold price was rising then gold stocks would most likely be weak. This
is because the prices of many large and mid-size gold stocks are over-valued
(they already discount a much higher gold price), making them far more
vulnerable to being dragged lower by the overall market than would be the
case if they were cheap. However, if the stock market were anything other
than very weak then most gold stocks would probably respond very positively
to a 20% rise in the gold price.
Our view is that the broad stock market
will remain reasonably firm for another 1-2 months, which means that the
next two months should present the best opportunity for a rally to a new
high by the gold sector. In fact, we think the AMEX Gold BUGS Index has
a better-than-even-money chance of trading up to the 280-300 range before
the end of May.
Gold Stocks
Gold stocks have not responded with
much enthusiasm to the recent strength in the gold price and silver stocks
have not confirmed the new highs achieved by the silver price over the
past few weeks. It's always a warning flag when moves in the metals are
not confirmed by the equity market, but at this stage we aren't overly
concerned because the price action in the gold sector is generally quite
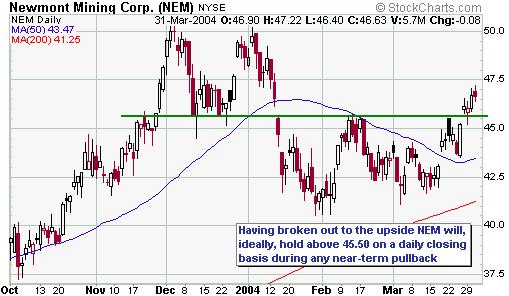
bullish. For example, Newmont Mining has broken decisively to the upside
(see chart below) and would now need to close below $45.50 before we would
consider re-thinking our short-term bullish view.
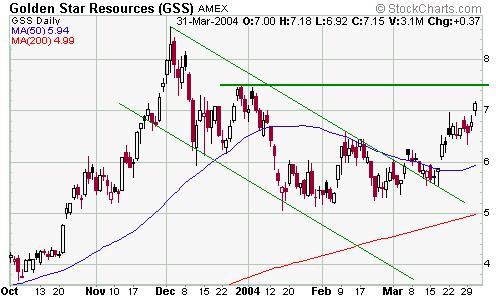
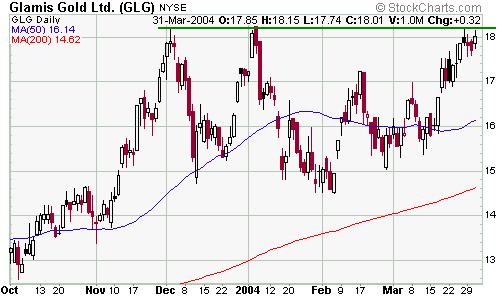
Also, many of last year's speculative
favourites in the gold sector are looking strong and we take this as evidence
that last year's trend is intact. Bema Gold (BGO), Golden Star Resources
(GSS) and Glamis Gold (GLG), charts of which are included below, are three
good examples. None of these stocks interest us as investments because
they are over-valued, but in each case the price action is bullish. For
instance:
a) BGO broke upwards out of a consolidation
pattern in early March and has since made two successful tests of its 50-day
moving average
b) GSS broke out to the upside in early
March, pulled back to 'test' the breakout, and has since moved higher
c) GLG has formed what currently looks
like a "triple top" at around 18.25; however, as we've mentioned in the
past triple tops usually do NOT hold, that is, they are usually followed
by upside breakouts.
We think the odds are in favour of
each of these stocks moving to new highs over the coming 2 months.

Merger Mania
The managements of IAMgold (IAG) and
Wheaton River (WHT) have agreed to merge their companies at a price that
almost defies belief. The deal is structured as a takeover of WHT by IAG,
and based on the IAG stock price prior to yesterday's post-announcement
market action would result in a company valued at a phenomenal $613 per
ounce of gold reserves and $5,194 per ounce of gold production. To put
these numbers in perspective, the industry average is $163/ounce for reserves
and $2,250/ounce for production, and Kinross Gold is currently being valued
by the market at about $175/ounce of reserves and $1,300/ounce of production.
In fact, even Goldcorp looks cheap compared to the price being paid by
IAG for WHT.
Needless to say, the proposed IAG/WHT
merger looks like a wonderful deal for WHT shareholders and a horrible
deal for IAG shareholders. It also looks like the type of deal seen near
cycle tops; although it is, of course, nowhere near as extravagant as some
of the deals that were done by tech and internet companies in 1999-2000.
There is also some speculation that
Newmont (NEM) will attempt to acquire Barrick (ABX). This, however, looks
like a real longshot because we doubt that NEM would want to take-on ABX's
hedge problem.
Current Market Situation
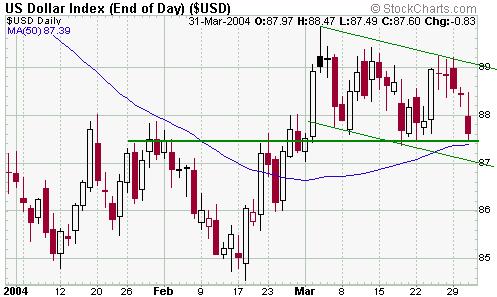
The US$ was quite weak on Wednesday,
but the below chart of the cash Dollar Index shows that no real technical
damage was done. The Dollar Index remains above its 50-day moving average
and above support at 87.50. Furthermore, the downward drift in the Dollar
since early March could be interpreted as a bullish consolidation.
Our view is that the Dollar Index has
a reasonable chance of moving up to around 91 over the next few weeks,
after which a decline to new bear-market lows will probably get underway.
Consecutive daily closes by the Dollar Index below its 50-day moving average
would, however, indicate that a top was already in place.
The main reason we are anticipating
an end to the dollar's rally over the next few weeks is the performance
of the gold price. When the gold price closed above its February peak on
23rd March it provided a strong signal that a move to a new multi-year
high was in progress; and since gold tends to lead the US$ a move to a
new high by gold would suggest, in no uncertain terms, that a move to a
new low in the US$ was on the cards.
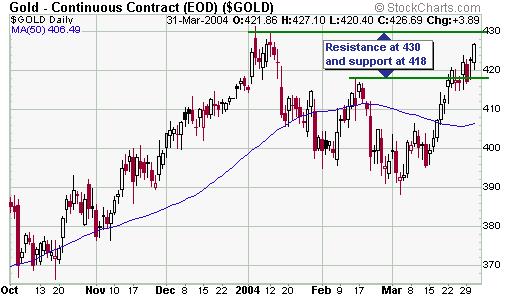
As at the close of trading on Wednesday
the gold price was between support at $418 and resistance at $430 (see
chart below). Note that it would be normal if gold failed in its first
attempt to surmount the resistance at 430 and retraced 30%-60% of its March
rally before making a sustainable move to new highs.
Industrial
Metals
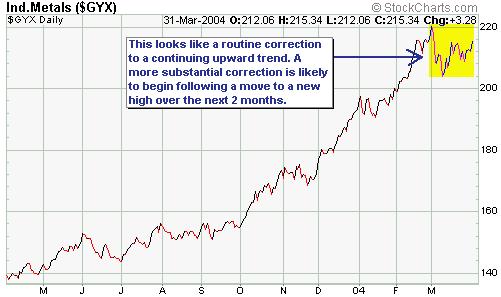
The industrial metals complex is probably
getting close to a peak, but the performance of the Industrial Metals Index
(GYX) suggests that new highs will be seen before a substantial downturn
gets underway.
Update
on Stock Selections
 In
mid February we suggested buying silver explorer and soon-to-be silver
producer First Majestic Resource (TSXV: FR) at a price of C$1.50 or lower.
It was trading at C$1.42 at the time and following an upward spike to about
1.70 immediately after our recommendation it traded down to the 1.30s (a
lot of stock was available in the 1.30s during the final week of February);
which is evidence that it is not wise to chase a stock in the immediate
aftermath of a newsletter's recommendation, including our own. Occasionally
a stock will jump higher and won't look back following a recommendation,
but the majority will pullback thus allowing patient investors to 'get
set' at more reasonable prices. In
mid February we suggested buying silver explorer and soon-to-be silver
producer First Majestic Resource (TSXV: FR) at a price of C$1.50 or lower.
It was trading at C$1.42 at the time and following an upward spike to about
1.70 immediately after our recommendation it traded down to the 1.30s (a
lot of stock was available in the 1.30s during the final week of February);
which is evidence that it is not wise to chase a stock in the immediate
aftermath of a newsletter's recommendation, including our own. Occasionally
a stock will jump higher and won't look back following a recommendation,
but the majority will pullback thus allowing patient investors to 'get
set' at more reasonable prices.
Following the late-February pullback
the FR stock price has been quite strong (it closed at C$2.25 on Wednesday),
perhaps because the market is starting to believe that the company will
achieve its goal of becoming a mid-tier silver producer within the next
12 months by buying silver mines in Mexico at attractive prices. The former
head of Pan American Silver's Mexican operations has been hired by FR to
operate the business and help identify the potential acquisitions, with
the first acquisition -- the Parrilla mine -- likely to be completed within
next few weeks. We expect that FR will own at least two and probably as
many as three producing silver mines by this time next year.
FR would be suitable for some new buying
if it pulled back to around C$2 over the next couple of weeks, but if it
doesn't pullback at this time it should be a good candidate for accumulation
during a substantial correction in gold and silver stocks during the second
half of this year.
Toll
Cross Securities released a report on our Aquiline Resources (TSXV: AQI)
earlier this week with a BUY recommendation and a 12-month price target
of C$2.60. Our view is that AQI would be suitable for a small amount of
additional buying below C$1.30 in anticipation of significant news-flow
from the company and a generally positive gold market environment over
the coming 2 months.
Despite
the surge in the copper price, development-stage copper stock Adrian Resources
(TSX: ADL) has been a dog over the past 3 months. One reason for this is
that ADL's destiny is not in its own hands in that it is reliant on Teck
making a production decision on the Petaquilla project in Panama
(ADL currently owns 52% of Petaquilla and will end up with 26% of this
massive copper/gold project if Teck decides to take the project through
to production).
The main reason, though, is most likely
a huge overhang of stock due to private placements done at C$0.15/share
last year. About 15M shares were issued at 15c during the final 4 months
of last year and these shares became free for sale in January and March.
Not all the participants in the placements would be eager to sell their
shares at prices ranging from C$0.40 to C$0.60, but even if only 10%-20%
of these shares were being dribbled onto the market it could have a substantial
effect on a stock that typically only trades about 90,000 shares/day; particularly
in the absence of company-specific news that would stimulate investment
demand for the stock.
Our assessment is that ADL's stake
in the Petaquilla project is worth at least C$2.00 per ADL share at current
metal prices, but it doesn't appear as though the market is going to come
close to recognising this value until a production decision is made by
Teck Corp. In the mean time ADL remains a very interesting speculation
for those with the patience to hold for at least 12 months.
Cumberland
Resources recently announced that the Feasibility Study now underway at
its Meadowbank Project had resulted in a large upward revision in estimated
construction costs. This is not, however, a problem that will be limited
to this one company. In fact, most development and production-stage mining
companies are going to find that their construction and/or operating costs
are going to be markedly higher over the coming 12 months than they would
have been 12 months ago. This is an issue that the industry and investors
in these companies will have to come to terms with, although it is one
that will, we think, be solved to a large extent by a higher gold price.
Until investors have come to terms
with higher costs or until any increase in costs has been offset by a rise
in the gold price there will be the potential for some big disappointments.
We therefore reviewed the TSI Stocks List to see if there was a significant
chance of Cumberland-like negative surprises from any other companies on
the List.
There are only two companies in the
TSI List that are currently in the process of completing feasibility studies.
These companies are Northgate Exploration (TSX: NGX) and NovaGold Resources
(TSX: NG). Northgate is due to complete the Feasibility Study at its Kemess
North project during the coming month and NovaGold is due to complete the
Feasibility Study at its Rock Creek project during the next few months.
As far as Northgate is concerned, we
don't think there is much chance of a large negative surprise, for two
reasons. First, considerable use will be made of the infrastructure already
in place at the Kemess South mine. Second, the market's expectations with
regard to Northgate's Kemess North project appear to be very low (at NGX's
current market cap the market appears to be assigning little value to this
5.4M ounce gold + 2B pound copper resource). In our opinion, there is a
much better chance of NGX surprising the market in a positive way than
a negative way.
Now let's take a look at NovaGold.
This company's plan is to put one of its projects into production every
year for the next several years, beginning with the 100,000 ounce/year
Rock Creek project in 2005. Rock Creek is not one of NovaGold's largest
projects, but because it will be the 'first cab off the rank' it could
have a big influence on market perception (if Rock Creek progresses smoothly
from here the stock market's confidence in NovaGold will rise).
We asked Greg Johnson, NovaGold's VP
of Corporate Development, if there was a significant risk that the Feasibility
Study that is currently underway at Rock Creek would reveal a cost blowout.
Rather than trying to summarise the detailed response received via e-mail
we've included it in full below because it should make interesting reading
for any current or prospective NovaGold shareholders. The bottom line is
that the probability of a negative surprise appears to be low.
"Last fall Norwest Corporation completed
the detailed Preliminary Economic Assessment Study on the project. This
study estimated that the project could produce approximately 100,000 ounces
per year at a total cash cost of US$200 per ounce. The study also estimated
a capital cost at US$40 million at certainty level of +/-30% which is a
standard range for this stage of study. Because of the numerous positive
aspects of the Rock Creek deposit including its location near the Port
of Nome, access by State maintained roads, surplus available power and
simple open-pit mining process we do not anticipate any material change
outside of the ranges of the original estimates in the final Feasibility
Study due to increases in the prices for steel, fuel and other materials.
Due to the coarse native gold component
of the deposit, testing has shown that recovery of 80% or more of the gold
can be achieved from a simple gravity recovery process with a very simple
mill facility. We do not plan to use cyanide or other chemicals on site
but instead plan to ship a relatively small concentrate product offsite
for processing to recover an additional 16% of the gold for a total of
96% recovery. We are currently looking into optimizing further the gravity
recovery as part of the on-going Feasibility study which may allow us to
reduce or eliminate producing a flotation concentrate as well.
Also as part of the final Feasibility
Study, NovaGold will work with independent engineering firm AMEC E&C
Limited to design a comprehensive test mining, bulk sample program to use
in the final reserve model for the deposit. This bulk sample will further
quantify the coarse gold component of the mineralization as estimated with
core and rotary drilling. It will also provide additional material to carry
out further metallurgical test work to optimize the recovery of gold using
gravity methods and will allow the Company to develop the best approaches
to grade control and mining methods. The final Feasibility capital and
operating cost estimates should be on the order of +/- 10% certainty for
the project and is anticipated to be completed by mid-2005 with receipt
of the mine permits for construction.
We anticipate a very exciting year
ahead with drill results from several exploration programs starting this
summer and on-going through the fall. By successfully moving our projects
forward to the pre-feasibility and feasibility stage over the next year
we would anticipate moving from our current market capitalization per ounce
of $15 towards the sector average for Feasibility level projects of $30
to $50 per ounce. Eventually we should achieve a valuation towards the
average junior producing gold company in North America which is currently
valued at a market capitalization of over $100 to $150 per ounce."
Chart Sources
Charts appearing in today's commentary
are courtesy of:
http://stockcharts.com/index.html

|
