![]()
![]()
![]()
![]()
- Interim Update 31st May 2017
Copyright
Reminder
The commentaries that appear at TSI
may not be distributed, in full or in part, without our written permission.
In particular, please note that the posting of extracts from TSI commentaries
at other web sites or providing links to TSI commentaries at other web
sites (for example, at discussion boards) without our written permission
is prohibited.
We reserve the right to immediately
terminate the subscription of any TSI subscriber who distributes the TSI
commentaries without our written permission.
Monetary support
continues to evaporate
With all the necessary
money-supply data for April-2017 now available we can report that the
year-over-year rate of growth in G2 (US plus euro-zone) True Money Supply
is now 7.2%, which is down from 7.8% a month earlier and a new 2-year low.
This is still comfortably above the boom-bust threshold of 6% (indicated
by the red line on the following chart), but the monetary backdrop is
nowhere near as supportive as it was just 6 months ago.
The Stock Market
The US
The stock market versus the economy
The following monthly chart shows the Wilshire5000 Index (an index
that covers the entire US stock market) and the US Industrial Production
Index (IP). We've drawn horizontal black lines on the chart to show where
each of these indices stands relative to its 2007 peak.
Notice
that the Wilshire5000 (the blue line) is currently almost double its 2007
level whereas IP is slightly below its own 2007 level.
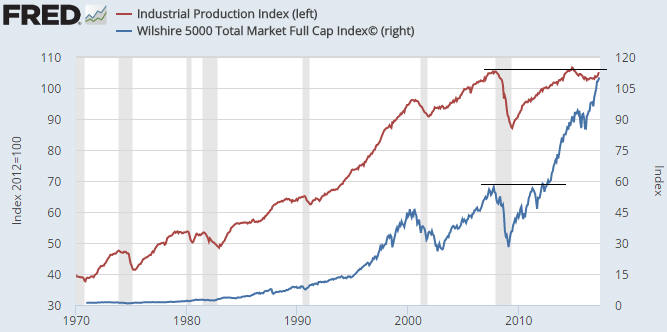
The chart shows that there hasn't been a strong relationship between
the stock market and the economy over the past several years. There
actually never has been; it's just that the lack of a strong relationship
has been more obvious over the past several years than ever before. The
chart also shows the effectiveness of monetary stimulus at boosting asset
prices and the ineffectiveness of monetary stimulus at generating economic
progress.
Monetary stimulus (interest-rate suppression and money
pumping) falsifies price signals and therefore leads to more investing
errors than would otherwise occur. Projects and businesses that would
obviously not be viable in the absence of the new money get funded, but
since no new resources have been created these ventures -- sometimes aptly
referred to as bubble activities -- drain resources from other parts of
the economy. The economy is thus changed to become increasingly reliant on
'bubble activities', which, in turn, are reliant on the continuation of
artificial monetary support, but at some point the monetary support is
removed because the Keynesians in positions of influence finally begin to
notice an inflation problem. The longer it takes for the Keynesians in
charge to start worrying about price inflation, the greater the
distortions to the economic structure and the slower the rate of real
long-term progress. Also, the more severe the eventual recession.
The weak performance by US Industrial Production over the past 10 years
doesn't prove that monetary stimulus constitutes a long-term drag on the
real economy, but it is certainly consistent with this view.
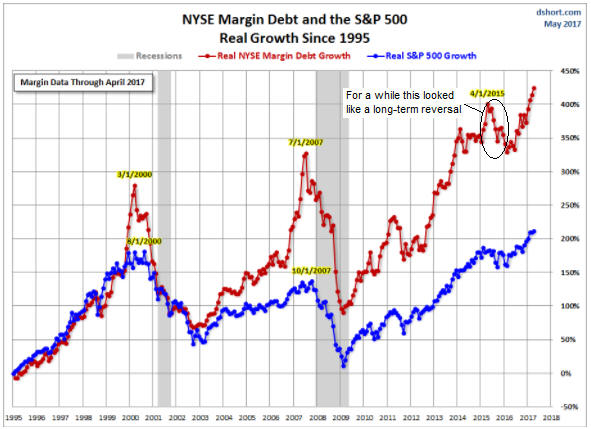
NYSE Margin Debt stays on its upward path
The cumulative NYSE Margin Debt as at the end of April was reported
earlier this week. As illustrated by the following
monthly chart prepared by Doug Short, it has extended its sequence of
new all-time highs in 'real' terms. In other words, stock-market leverage,
as measured by NYSE Margin Debt, is still increasing. This is important
because regardless of how over-valued the stock market becomes, a major
top won't occur while leverage is still increasing. To put it another way,
valuation risk will only come to the fore and cause a major bearish trend
after leverage stops increasing.
Based on the admittedly-sparse historical record, the next long-term
monthly-closing top for the S&P500 Index (SPX) will likely occur 3-5
months after the month that NYSE margin debt hits a long-term peak of its
own. However, the SPX's intra-day top could occur during the same month
that Margin Debt tops out.
It's worth mentioning that Margin Debt
temporarily gave a misleading signal during 2015 and the first half of
2016 that tricked us. We are referring to the fact that the decline in
Margin Debt from its April-2015 peak looked similar to the Margin Debt
declines from the 2000 and 2007 peaks. For a while, therefore, the
performance of Margin Debt suggested that the SPX's July-2015 top was the
long-term variety as opposed to the intermediate-term variety that it
turned out to be.
When Margin Debt resumed its long-term upward
trend in 2016 it was the first time that a sharp multi-quarter decline
from an all-time high did not mark a long-term peak. There was therefore a
difference this time around.
It was probably different because the
decline in Margin Debt from its April-2015 peak was accompanied by rapid
monetary inflation, whereas when Margin Debt turned down in 2000 and 2007
the monetary backdrop was much less accommodative. It seems that a
downturn in stock-market leverage won't 'stick' if central banks and/or
commercial banks are rapidly creating new money.
Current Market Situation
For about
a month after Trump was elected there was a frantic rally in the prices of
economically-sensitive equities, obviously based on the belief that
Trump's tax cuts and increased infrastructure-spending would lead to a
much stronger economy. It subsequently began to dawn on investors that the
'Trump stimulus' would either not happen at all or happen in a
watered-down fashion much later than originally anticipated. This caused
the economically-sensitive sectors to firstly stop rallying and to then
begin rolling over to the downside.
For example, the Bank Index
(BKX) began to form what appears to be an intermediate-term topping
pattern in December and is now very close to completing the pattern.
For another example, the Dow Transportation Average (TRAN) has traced
out a similar pattern to the BKX.
However, the realisation that the Trump stimulus theme was a dud
didn't discourage the bulls, it just prompted them to concentrate on a
small group of large-cap tech/internet/social-media stocks that apparently
are OK to buy at any price and will continue to grow rapidly regardless of
the economy. Consequently, the NASDAQ100 Index (NDX) hasn't just
maintained its post-election upward trend, it has accelerated upward.
Our conclusion is simply that the US stock market is behaving like it
is in the final phase of a long-term bullish trend.
Gold and the Dollar
Gold
The
US$ gold price broke upward from a multi-day consolidation pattern last
Friday and followed through to the upside over the first two trading days
of this holiday-shortened week. A test of the April high near $1300
appears to be on the cards.
Although the US$ gold price is nearing its 2017 high, the HUI/gold
ratio is nearing its 2017 low.
The fundamental backdrop is now gold-bullish, but the divergence
between gold and the HUI/gold ratio has short-term bearish implications
for both gold and the gold-mining sector. It's the main reason we don't
expect gold to do much more than test its April high before commencing a
sizable multi-week decline.
Note that if we get a significant
decline in the gold price within the coming 1-2 months in parallel with
the fundamental backdrop remaining gold-bullish, the set-up for a
long-side gold trade will be exceptional.
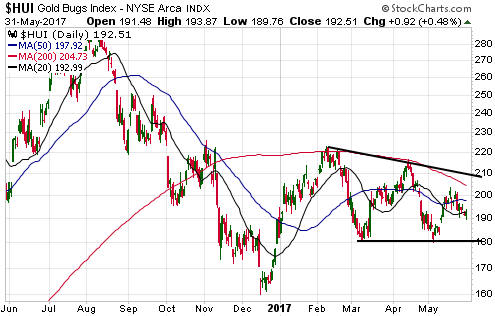
Gold Stocks
The HUI only had to move by a few points in one direction or the other
over the final two trading days of May to generate a breakout on the
monthly chart, but instead it moved sideways. Consequently, at the end of
May it remained between its 20-month and 50-month MAs. By the end of June
these MAs will have converged, so there will have to be a breakout this
month.
The following daily chart shows the choppiness of this year's price
action. There have been some significant multi-week moves, but there has
been virtually no net progress in either direction since early-January. To
be specific, the HUI was 192.3 at the close of trading on 4th January and
192.5 at the close of trading on 31st May.
The HUI could spike up
to around 210 in the near future without changing anything.
The Global X Silver Miners ETF (SIL) has performed similarly to the
HUI.
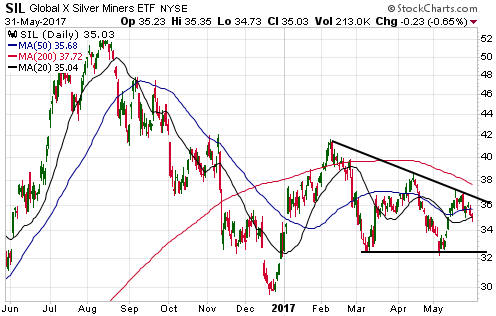
There's a decent chance that the HUI and SIL will decline to below
their December-2016 lows within the next two months, thus establishing a
very attractive risk/reward for a multi-month long-side trade.
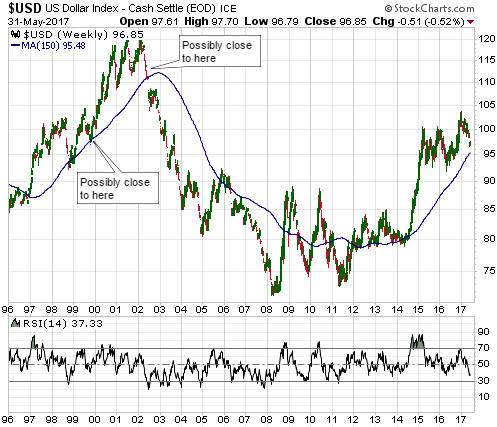
The Currency Market
As noted on the following
weekly chart of the Dollar Index (DX), the current situation is possibly
equivalent to late-1999 (near the end of the correction that preceded the
final upward leg of a bull market) and is also possibly equivalent to
mid-2002 (a few months into the first downward leg of a bear market).
A reason to favour the former over the latter possibility is that the
overall financial-market environment has a lot more in common with
late-1999 than with mid-2002. For example, in late-1999 a US equity BULL
market was in its final speculative phase, as is probably the case today,
whereas in mid-2002 an equity BEAR market was nearing its completion. For
another example, in late-1999 the Fed was hiking interest rates and
monetary conditions were becoming less supportive of asset prices, as is
the case today, whereas in mid-2002 the Fed was easing aggressively and
monetary conditions were about as supportive as they ever get.
Note
that even under the late-1999 intermediate-term bullish scenario there
could be a spike down to the vicinity of the 150-week MA (the blue line on
the chart, currently at 95.5) in the near future before a reversal.
Updates on Stock Selections
Notes: 1) To review the complete list of current TSI stock selections, logon at
http://www.speculative-investor.com/new/market_logon.asp
and then click on "Stock Selections" in the menu. When at the Stock
Selections page, click on a stock's symbol to bring-up an archive of
our comments on the stock in question. 2) The Small Stock Watch List is
located at http://www.speculative-investor.com/new/smallstockwatch.html
![]() Update
on Northern Empire Resources (NM.V), a recent addition to the
TSI Small Stocks Watch List (SSWL)
Update
on Northern Empire Resources (NM.V), a recent addition to the
TSI Small Stocks Watch List (SSWL)
NM has been
halted from trading on the TSXV since we first mentioned it in the 1st May
Weekly Update. In the 22nd May Weekly Update we wrote: "It's now
unlikely that the stock will trade near C$0.18 [its pre-halt price] when
the halt is finally lifted, but it may be possible to buy near the C$0.25
financing price and doing so would probably lead to a very good return
within 12 months."
The company has completed its asset
purchase deal and the associated financings, meaning that the reason for
the trading halt has been removed. The company now owns the Sterling gold
mine in Nevada and should have working capital of at least C$10M after
paying all costs associated with the mine purchase.
The stock will
resume trading on 1st June, but note that it has just undergone a 1:3
share rollback. Consequently, the C$0.25 (or thereabouts) buy level
previously mentioned is now equivalent to C$0.75.
Taking into
account the rollback, the shares issued in financings and other shares
issued as part of the asset purchase deal, we estimate that NM's total
share count is 46M.
 Brief note on Asanko Gold (AKG)
AKG was mentioned
in the 24th May Interim Update as one of five gold-mining stocks that we
had short-listed for potential trades over the coming months. We wrote
that we hadn't yet decided on a buy level for the stock and that in this
regard a lot would depend on the FS results scheduled to be released on
5th June.
AKG's price collapsed on Wednesday 31st May in response
to a report from well-known short seller Carson Block.
Here's the link to a 4-minute Bloomberg interview with Block in which
he outlines his reasons for betting against the stock.
AKG has now
fully retraced last year's huge rally and is back to its early-2016 bear
market low. Is it worth buying near this price?
Possibly. There's a good chance that the company will provide some
positive information on 5th June and the stock price could rebound
strongly, but the unknowns are too large for our taste. AKG is therefore
unlikely to be one of the gold stock trading positions we add to the TSI
List within the next couple of months.
Chart Sources
Charts appearing in today's commentary
are courtesy of:
http://stockcharts.com/index.html
http://research.stlouisfed.org/
![]()