|
- Interim Update 31st August 2011
Copyright
Reminder
The commentaries that appear at TSI
may not be distributed, in full or in part, without our written permission.
In particular, please note that the posting of extracts from TSI commentaries
at other web sites or providing links to TSI commentaries at other web
sites (for example, at discussion boards) without our written permission
is prohibited.
We reserve the right to immediately
terminate the subscription of any TSI subscriber who distributes the TSI
commentaries without our written permission.
More thoughts on now
versus 2008
We've mentioned a few times over the past 6 months that the US monetary backdrop all but eliminates the possibility of a 2008-style collapse this year. As well as putting a floor under the stock and commodity markets, this year's rapid rate of US money-supply growth has had the following effects:
1. The gold market has been stronger than it was during Q2-Q3 of 2008.
2. Gold mining stocks are currently holding up much better than they did in 2008.
3. The Dollar Index hasn't rallied.
However, we shouldn't be complacent, firstly because it is still too early to rule out the possibility that there will be a meaningful deflation scare (surging fear of deflation, but no actual deflation) before this year is out. If such a scare is going to happen it will get underway in September. In other words, if it is going to happen at all then we should begin to see clear signs of falling inflation expectations and rising fear of deflation over the next three weeks.
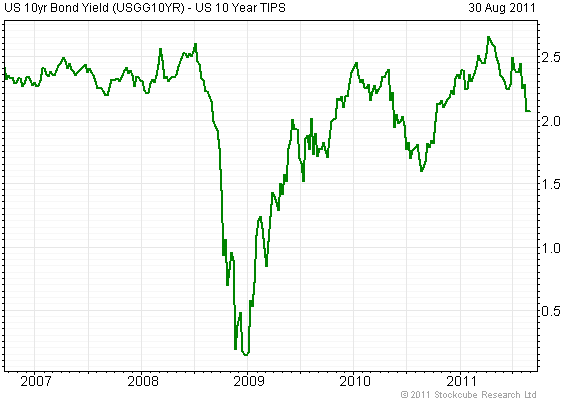
One of the signs that fear of deflation has begun to engulf the financial world would be a sharp decline in what we refer to as the "expected CPI". The expected CPI is the difference in yield between the 10-year T-Note and the 10-year TIPS (Treasury Inflation Protected Security). As illustrated by the following weekly chart from
www.fullermoney.com, there was spectacular decline in inflation expectations during July-November of 2008, with the best part of the decline starting in September.
There has been a moderate pullback in the expected CPI over the past few months, but it is still within the top quartile of its 5-year range. In order to get the sort of decline in inflation expectations that qualifies as a serious deflation scare, the senior stock indices will probably have to break decisively below their August lows.
The second reason not to be complacent is that while the ingredients for a 2008-style crisis do not currently appear to be in place in the US, they are in place in Europe. Of particular relevance, Michael Pollaro's
money supply site
indicates that the year-over-year rate of growth in euro TMS was only 1.1% as at the end of June. This compares to the double-digit rate of growth in US$ supply.
When the central bank slows the money-supply growth rate after fostering a great credit expansion, a major financial crisis always occurs. The Stock Market
European Markets
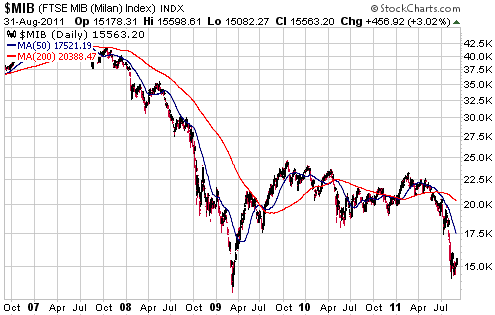
The following daily chart shows that Italy's stock market is almost back to its Q1-2009 bear market low.
The chart doesn't suggest that a bottom is near in price terms. Nor does it suggest that significant additional downside is in store. What it does suggest is that the crisis is coming to a head. It's likely that an intermediate-term low is either in place already or will be put in place within the next two months.
Our comments regarding the above chart of Italy's MIB Index are also applicable to the following daily chart of Greece's ATG Index. The main difference between the two charts is that the ATG has fallen well below its Q1-2009 low.
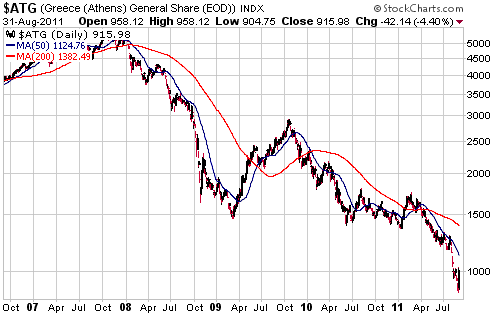
The above ATG chart suggests to us that there are now great bargains to be had on the Greek stock exchange. After all, even if all the bank stocks are worthless, the entire stock market is not going to drop to zero. Moreover, the type of collapse recently experienced by the Greek stock market always results in many 'babies' (well-managed companies with bright futures) being thrown out with the 'bathwater' (bankrupt and/or poorly managed companies). We don't have the time or resources to do the in-depth research required to identify the aforementioned babies, but it's an opportunity that some of our readers may be able to grab.
High-Growth Markets
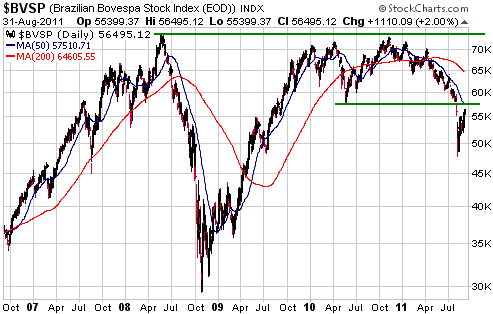
The following daily chart shows that Brazil's stock market broke decisively below intermediate-term support at 57,500 during the first half of August. This former support is now resistance, which means that the market is now approaching a level that stands a good chance of capping the rebound from the early-August low.
The next chart shows that Hong Kong's stock market managed to hold intermediate-term support at 19,000 during the August rout. Short-term resistance is defined by the 50-day moving average at around 21,300 (about 800 points above Wednesday's close).
We suspect that the HSI's ultimate low for the move will be within 10% of the August low.

The US Market
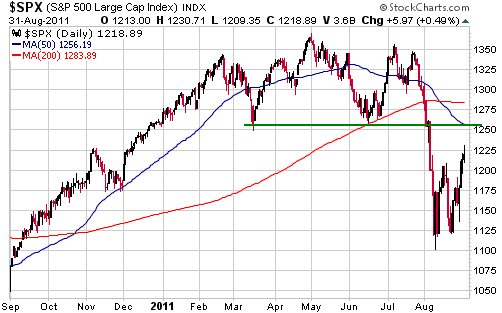
In the latest Weekly Update we said that S&P500 resistance at 1250-1270 would probably cap the upside over the next few months. The S&P500 came within 20 points of the bottom of this resistance range on Wednesday, so the scope for additional short-term gains appears to be minimal.
Our short-term stock market outlook will be downgraded to "bearish" if the S&P500 moves up to the 1240s within the next three trading days.
Gold and the Dollar
Gold
From the latest Weekly Update:
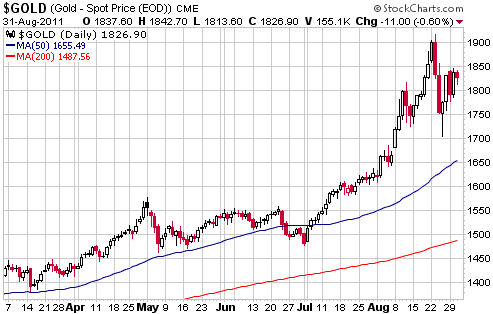
"We can't rule out the possibility that last week's plunge was "all she wrote", but the rebound that began on Thursday morning is probably a counter-trend move within the context of a new short-term or intermediate-term correction."
And:
"As things currently stand, we would view a rise to around $1850 as a new opportunity to do some selling or establish a hedge position."
These comments still apply.
There were some significant daily swings in the gold price during the first three trading days of this week, but the net result was only a $1 change between Friday's close and Wednesday's close. It was a similar story in the silver market. Both metals are probably consolidating before resuming their corrections.
Gold Stocks
The HUI has moved up to just below its August high, which was, itself, a test of the April all-time high. Refer to the following daily chart for details.
It obviously won't take much in the way of additional strength to push the HUI into new-high territory, but a sustained upside breakout at this time is not the most likely outcome. This is mainly because gold bullion's correction is probably not yet complete. It is also because the broad stock market is probably nearing a rebound peak.
A solid daily close above 610 would constitute a breakout and would create a short-term chart-based target of 700-720.

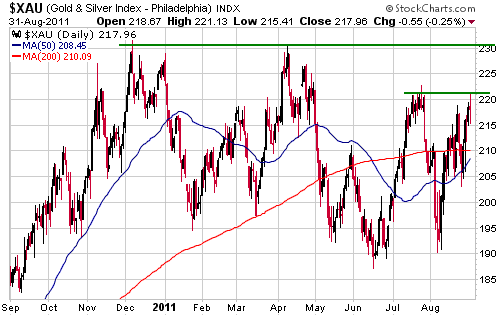
If the HUI does break out it will be interesting to see if the breakout is confirmed by the XAU. As things stand right now there is a divergence between the two gold-stock indices, in that the HUI has clearly exceeded its July high while the XAU has not (a daily XAU chart is shown below).
An upside breakout (to a new all-time high) by the HUI that isn't confirmed by a similar XAU breakout would look similar to what happened in early April, just prior to the start of a downward trend.
Currency Market Update
The EFSF and the euro
A couple of months ago euro-zone (EZ) leaders agreed to expand the financial resources and power of the European Financial Stability Facility (EFSF). Specifically, the agreement involved allowing the EFSF to buy sovereign bonds in the secondary market and boosting its lending capacity from 250 billion to 440 billion. Furthermore, the idea was to give this supranational bailout organisation the mandate to intervene preemptively in bond markets (plunge protection for European government bonds).
However, before the above-mentioned agreement can be implemented it must be ratified by the parliaments of the individual EZ countries. Of primary importance, Germany, the euro-zone country with the largest economy, must support any expansion of the EFSF for the expansion to go ahead. The issue is that German support for the 'upgraded' Facility is not a foregone conclusion, despite the fact that Germany's Chancellor was one of the EZ leaders who signed off on the upgrade.
Two events that will determine the future of the EFSF are scheduled to take place in Germany in September. The first is expected to occur on 7th September, when Germany's Constitutional Court votes on the legality of bailing out bondholders and foreign governments. The second is expected to occur on 29th September, when Germany's parliament (the Bundestag) votes on whether or not to allow the EFSF to be expanded.
Interestingly, while Germany's politicians agonise over whether the EFSF's financial resources should be increased from 250B to 440B euros, some analysts are saying that the EFSF will need access to 2,000B euros to be truly effective. After all, 440B won't be anywhere near enough if the solvency of the Italian government is seriously called into question, which it very likely will be within the next two years.
Over the past 18 months the currency market has tended to react in a perverse way to new developments in Europe's sovereign debt crisis, in that steps by European policy-makers to 'paper over' the problems have typically caused the euro to rally against the US$. In other words, inflationary policy responses (actions that increase the supply of euros) in Europe have generally led to strength in the euro. By the same token, on the occasions when one or more European governments appeared to be careening towards a direct debt default, the euro has usually declined against the US$. That is, failure on the part of policy-makers to postpone the 'day of reckoning' by inflating the supply of euros has generally been viewed as a reason to sell the euro. Consequently, although we could argue that stopping the expansion of the EFSF would be bullish for the euro and that eliminating the EFSF altogether would be very bullish for the euro, the euro will probably plunge if the 7th September and/or the 29th September votes go against the EFSF.
Current Market Situation
Europe's debt crisis continues. Over the past week, for example, we've seen Greek government 1-year bond yields hit 60% and 2-year bond yields hit 46%. We've also seen statements from high-profile German politicians to the effect that the ECB over-stepped its bounds when it recently waded into the market to support Spanish and Italian government bonds.
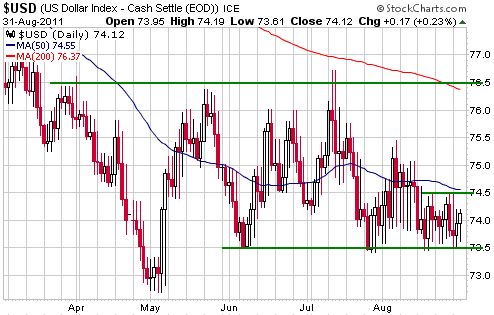
And, Europe's debt crisis continues to be largely ignored by the currency market. At least, you would never be able to tell that a financial crisis was in progress by observing the trading of the Dollar Index. As illustrated by the following daily chart, the Dollar Index has spent the past 6 weeks oscillating between 73.5 and 75.5 and the past 12 trading days oscillating between 73.5 and 74.5.
Consecutive daily closes below 73.5 or above 74.5 would indicate the likely direction of the next multi-week move.
On a related matter, US dollars leaving Europe for the comparative safety of the US continues to be the most plausible explanation for the recent growth spurt in US money supply. From our perspective, this means that the absence of strength in the Dollar Index continues to be a quandary. The reason is that such a large US$ shift should have created a temporary shortage of dollars outside the US and put irresistible upward pressure on the USD/EUR exchange rate.
Perhaps there will be a delayed reaction, with the Dollar Index rising sharply after the current stock market rebound runs its course.
Update
on Stock Selections
Notes: 1) To review the complete list of current TSI stock selections, logon at
http://www.speculative-investor.com/new/market_logon.asp
and then click on "Stock Selections" in the menu. When at the Stock
Selections page, click on a stock's symbol to bring-up an archive of
our comments on the stock in question. 2) The Small Stock Watch List is
located at http://www.speculative-investor.com/new/smallstockwatch.html
 The NXG-AUQ merger proposal The NXG-AUQ merger proposal
In mid July, a merger agreement was announced between Northgate Minerals (NXG) and Primero Mining (TSX: P). This merger was a lousy deal for NXG shareholders due to the big problem that Primero has with its silver production. The problem we are referring to is that Primero loses a lot of money on the silver component of its gold-silver production, and the higher the silver price the more money it loses. This is because the company is contractually obligated to sell most of its silver at only $4/oz to Silver Wheaton, but gets taxed as if it were selling the silver at the current market price. Why NXG's management chose to take on this liability was beyond us, so we removed NXG from the TSI List at that time.
This week's new development is that the NXG-Primero merger has been cancelled due to NXG receiving a takeover bid from AuRico Gold (AUQ). From the perspective of NXG shareholders, the proposed merger with AUQ is far more favourable than the earlier one with Primero thanks to the large premium to the pre-bid market price that AUQ is offering.
If we held NXG shares then we would view this week's bid-related increase in the share price as a gift and would make our exit.
New addition to the TSI Small Stocks Watch List: Norton Gold Fields (ASX: NGF). Shares: 833M issued (including full Zijin investment), 840M fully diluted. Recent price: A$0.19
We first mentioned NGF, an Australia-based junior gold miner, in the 30th March Interim Update when it was trading at A$0.17. It has only gained a little over 10% since then, despite a substantial increase in the A$-denominated gold price and a significant improvement in the company's balance sheet courtesy of an equity investment by a large Chinese mining company (Zijin).
NGF is producing gold at the rate of around 150K ounces/year. This production is currently being valued by the stock market at around $1060/oz, which makes NGF by far the cheapest >100K-oz/yr gold producer we know of. It is profitable and its profits should grow rapidly over the next few quarters due to the gains made by gold relative to the A$.
The risks are that the company's production rate will fall and/or that its costs will rise due to the complex nature of its mining operations (NGF's gold comes from the combination of an underground mine and a few open-pit mines). NGF has more than enough in-ground gold to maintain its current rate of production for the next 10 years, but doing so will require bringing new mines on line.
Due to its extremely low valuation, NGF has the potential to at least double in price over the next 6 months without any further improvement in the gold market.
We have added NGF to the Small Stocks Watch
List.
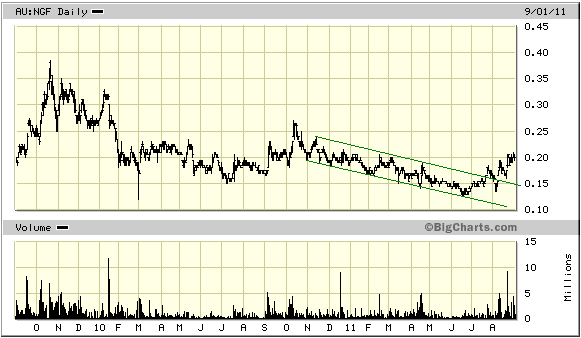
Chart Sources
Charts appearing in today's commentary
are courtesy of:
http://stockcharts.com/index.html
http://bigcharts.marketwatch.com/
http://www.fullermoney.com/

|
