![]()
![]()
![]()
![]()
- Interim Update 10th October 2018
Copyright
Reminder
The commentaries that appear at TSI
may not be distributed, in full or in part, without our written permission.
In particular, please note that the posting of extracts from TSI commentaries
at other web sites or providing links to TSI commentaries at other web
sites (for example, at discussion boards) without our written permission
is prohibited.
We reserve the right to immediately
terminate the subscription of any TSI subscriber who distributes the TSI
commentaries without our written permission.
Monetary inflation
around the world, continued
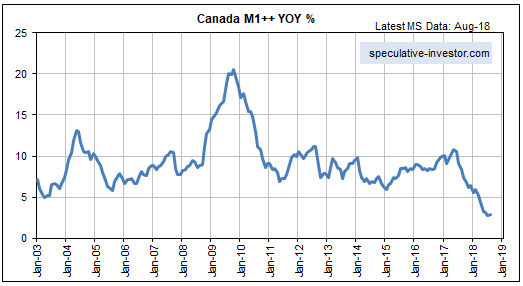
The monetary situation in Canada
is consistent with the theme that monetary inflation rates are low and/or
declining across the developed world. As illustrated below, the
year-over-year rate of growth in Canada's M1++ money supply (a reasonable
proxy for TMS) recently hit a 15-year low. Like Australia, Canada is now
in danger of experiencing monetary deflation. Also like Australia, Canada
has a real-estate investment bubble that is acutely vulnerable to the
reduced rate of monetary inflation.
The fact that interest rates are still low in real terms in almost
every country creates the impression that the monetary backdrop is still
accommodative, but that impression is wrong. Monetary conditions are now
tighter than they have been in a long time.
The global tightening
of monetary conditions eventually will set in motion large declines in
asset prices. This will cause central banks to reverse course and in some
cases reintroduce quantitative easing (QE), even though the perceived need
for more QE will be clear-cut evidence that the earlier QE was a failure.
That being said, it doesn't make sense to start anticipating more QE
at this time. There will be some major market moves before QE rears its
ugly head again.
Vanadium Moonshot
In January of this year we
wrote:
"At the present time more than 90% of the world's
production of vanadium is used in steel alloys. This particular use of
vanadium could grow due to, for example, China's government imposing new
regulations requiring the use of stronger steel reinforcement bar (rebar)
in concrete structures, but our interest in vanadium isn't related to its
use as a steel strengthener. Our interest stems from the possibility that
the consumption of vanadium will grow rapidly over the next several years
due to the increasing popularity of Vanadium Redox Batteries (VRBs).
VRBs are heavy and bulky, so they can't be used in EVs [electric
vehicles]. However, they are well suited for grid-level energy storage.
This is because a) their energy capacity is only limited by the size of
their storage tanks, b) they can be completely discharged for long periods
with no performance degradation, c) they experience almost no capacity
degeneration over time, and d) they are very stable."
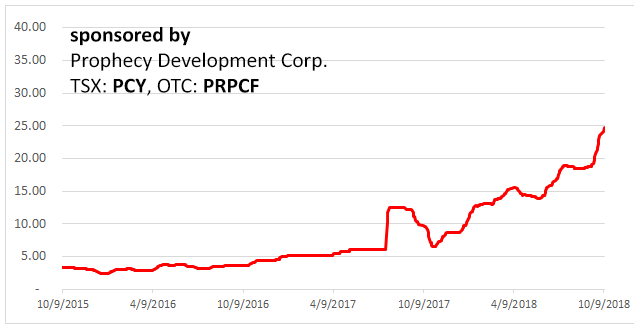
The
interest in VRBs is ramping up and so, as illustrated by the following two
charts, is the vanadium (V2O5) price. The first chart covers the past
three years and shows that the price is up from around $7/pound at this
time last year to around $25/pound today. The second chart extends back to
1980 and shows that the current price roughly matches the all-time high
achieved in 2005.
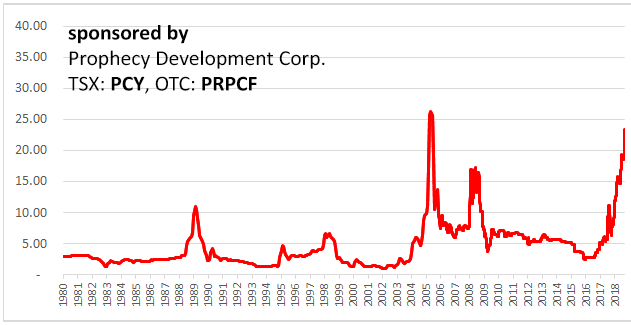
Unlike vanadium's surge to around $25/pound in 2005, the current surge
should have staying power. There will, of course, be a substantial
correction at some point, but we expect that the V2O5 price will make
higher highs and higher lows over the coming few years. The difference is
the progress that has been made with the development of VRBs and the
perceived need for efficient grid-level energy storage to make 'clean'
power generation more feasible.
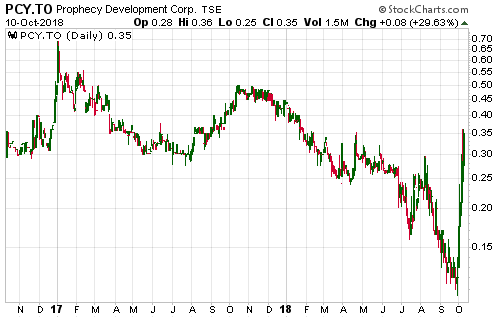
Prophecy Development Corp.
(PCY.TO), a member of the
TSI Small Stocks Watch List, offers exposure to vanadium via its
Gibellini project in Nevada. Based on a PEA completed earlier this year,
Gibellini's economics were very positive (51% IRR) at around half the
current vanadium price.
Despite its leverage to the vanadium price,
for a while it looked like PCY was going to sit out the entire vanadium
rally. However, the stock has suddenly started to draw some attention and
has tripled in price -- from a very low level -- over the past two weeks.
PCY had very significant news on Wednesday. It announced that Gerald
Panneton had been recruited as President and Chief Executive Officer,
replacing John Lee who will remain as Chairman of the Board. Mr. Panneton
is the founder of Detour Gold, a mid-tier gold producer, and was Detour's
CEO from 2006 to 2013. This constitutes a major strengthening of the
management team and should elevate the company's profile.
PCY is
clearly 'overbought' on a short-term basis, but its valuation is very low.
Its C$28M market cap (78M shares at C$0.35/share) is a small fraction of
the current NPV of the Gibellini project.
The Stock Market
Current Market Situation
Many people will characterise the US stock market's plunge on
Wednesday 10th October as a crash, but at this time the decline from the
peak barely qualifies as a correction (the SPX is down by about 5% from
its all-time high). The Dow Industrials Index (Dow) was down by 830 points
on Wednesday, but these days an 800-point move in the Dow is only about
3%. That being said, some important support levels have been breached and
the decline that got underway in early-October could evolve into a crash
or at least a far more serious correction.
Let's take a look at
some charts that reveal the breaches of support levels that have just
occurred and also the support levels that are now being threatened.
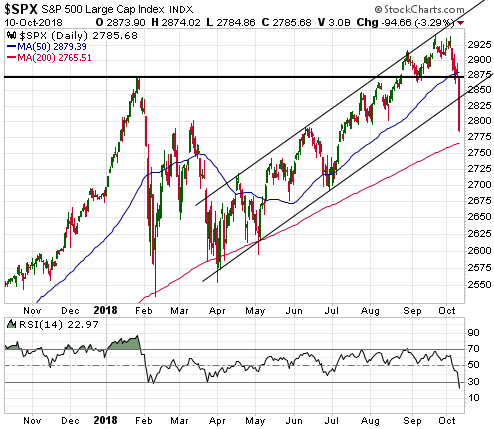
The SPX consolidated by moving sideways over the first two days of
this week. On both days it closed above its 50-day MA and important
lateral support near 2870. On Wednesday, however, it not only broke
through the aforementioned support, but also broke below the bottom of the
channel that defined its progress over the past 6.5 months.
The
next support is the 200-day MA, which is less than 1% below Wednesday's
close. The 200-day MA limited the downside during the early-2018
correction.
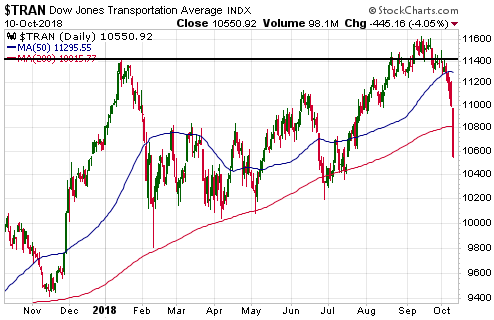
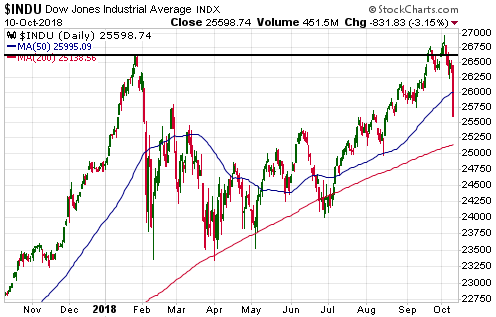
The Dow Industrials and Dow Transportation indices had classic false
breakouts above obvious resistance levels -- in September for the
Transports and early-October for the Industrials. The Transport index now
has broken decisively below its 200-day MA, a development that
distinguishes the current decline from those that happened earlier this
year. The Industrials index has broken below its 50-day MA, but remains
comfortably above its 200-day MA.
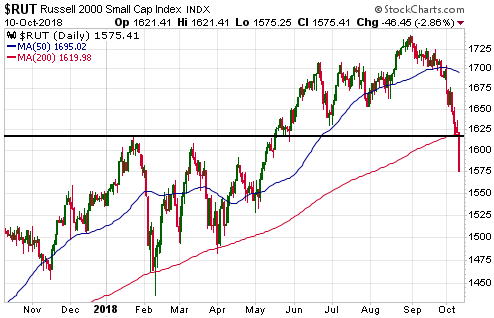
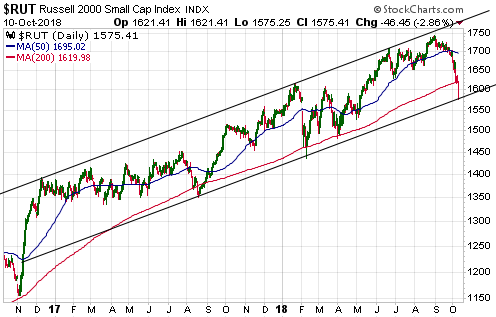
The Russell2000 SmallCap Index (RUT) ended last week precariously
poised at its 200-day MA and lateral support defined by its January-2018
high. This support held during the first two days of the new week, but the
first of the following daily charts clearly shows that it was broken in a
definitive manner on Wednesday. As is the case with the Dow Transports,
this distinguishes the current decline from those that happened earlier
this year.
The second of the following daily charts shows that
Wednesday's sharp decline ended at longer-term support (the bottom of a
2-year price channel).
The NASDAQ100 Index (NDX) achieved a minor downside breakout when it
closed below its 50-day MA at the end of last week. On Wednesday of this
week it plunged to the more important support offered by its 200-day MA.
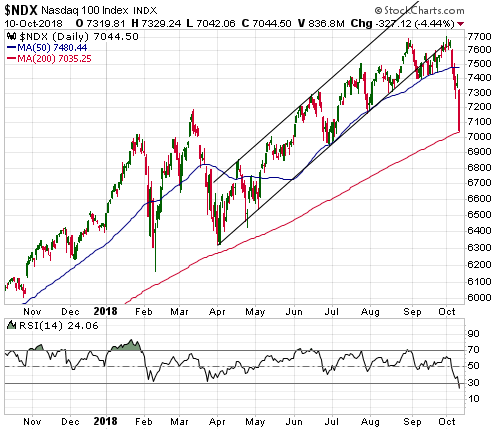
So, the SPX and the NDX ended Wednesday's session at or slightly above
their 200-day MAs while the RUT is now testing the bottom of its 2-year
channel. Also, by some measures the market is already at an 'oversold'
extreme. For example, the SPX's daily RSI(14) is at its lowest level since
August-2015. This could result in the US stock indices making at least 1-2
week bottoms as soon as Thursday 11th October, perhaps following spikes
below the aforementioned support levels.
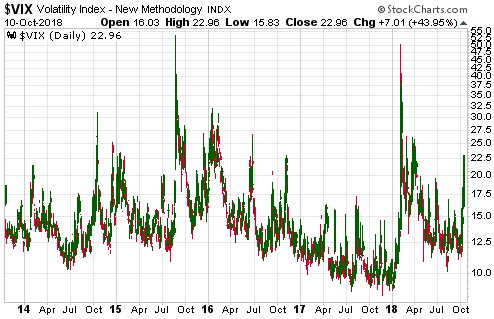
At the same time,
short-term fear indicators are not yet close to the sorts of extremes that
often precede or coincide with the lows of significant corrections. The
Volatility Index (VIX), for example, has risen only to the low-20s. This
suggests that an immediate reversal to the upside wouldn't be sustainable.
The downward move that got underway in some stock indices and
accelerated in other stock indices over the past week is about
fundamentals and sentiment. On the 'fundamentals front', our Equity True
Fundamentals Model (ETFM) most recently turned bearish on 7th September,
so the overall fundamental backdrop turned bearish for equities then. It
remains so today. Of greater importance, the bond market broke out to the
downside (bond yields broke out to the upside) last week. This ramped up
the downward fundamental pressure on equity prices.
On the
'sentiment front', our put/call indicator generated a rare sell signal on
26th September. Despite the recent stock market sell-off, this indicator
is still much closer to its sell zone than its buy zone.
Possible Short-Term Outcomes
One possibility is a
correction low within the next few days. This will be most likely if the
SPX's decline extends well beyond its 200-day MA -- perhaps to as low as
2650 -- without more than an intervening 1-day bounce.
A second
possibility is an interim low within the next three days and within 3% of
Wednesday's close, followed by a 1-3 week rebound and then a decline that
tests the October low in November. In this scenario, taking out the
October low could lead to a crash.
What to do?
We don't pretend to know what anyone else should do, because each
person's financial situation, experience and risk tolerance is different.
However, we do provide ideas.
For example, in the latest Weekly
Update we wrote: "For those looking for an opportunity to enter a
bearish short-term stock market trade (via options or inverse index
funds), we would view a rebound early this week as such an opportunity."
The intra-day rebounds on Monday and Tuesday could have been used to
establish positions.
Although there is a good chance of at least a
brief extension of the plunge, we don't think that this is the right time
to add to bearish exposure. On the contrary, we took profits on most of
our SPY October put options near the close of trading on Wednesday 10th
October due to the SPX's proximity to its 200-day MA and will exit our
remaining October puts within the next 2 days.
Apart from getting
out of October options ASAP, what we do from here will depend largely on
the amount of additional weakness. For example, we will exit our SPY
December puts if the SPX drops to the mid-2600s within the next few days.
A 1-2 week rebound could create a new opportunity to enter bearish
speculations, but we will cross that bridge when we come to it.
Gold and the Dollar
Gold
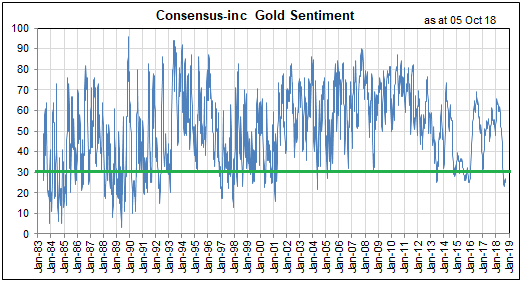
Gold sentiment revisited
The
following chart shows that the
Consensus-inc bullish percentage for gold (the percentage of brokerage
house analysts and independent advisory services monitored by Consensus
that are bullish on gold) remains near its low of the past two months.
This means that it remains near its lowest level since 2004 and its
second-lowest level in 17 years. In other words, gold sentiment remains
near a pessimistic extreme based on the past 17 years.
However, the
chart also shows that the current sentiment situation is not extreme
relative to what happened during the 1980s and 1990s. Whereas
bullish-percentage moves below 30% have been rare, shallow and short-lived
over the past 17 years, during the 1980s they were commonplace and
sometimes deep. Moreover, during the 1980s the bullish percentage spent a
significant amount of time below 20.
We mention this to reiterate
the point that one of the pitfalls of using sentiment to identify buying
and selling opportunities is that what constitutes an extreme depends on
the long-term price trend. Of particular relevance to gold, what
constituted an extreme low for bullish sentiment over the past 17 years
will not necessarily constitute an extreme low for bullish sentiment in
the future.
Current Market Situation
The
US$ gold price fell $17 on Monday and then drifted sideways. This price
action does not look significant. Also, the stock-market volatility has
improved the fundamental backdrop (from gold's perspective), but by
nowhere near enough at this stage to make a difference.
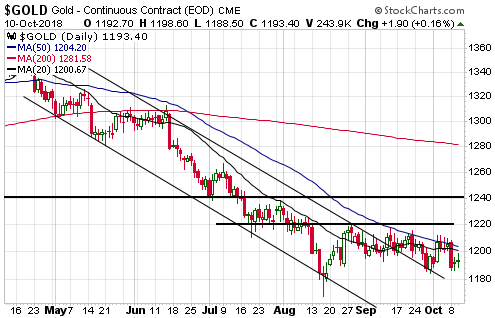
Further to the above, gold's situation now is essentially the same as
it was when we published the latest Weekly Update. Consequently, this
comment from the Weekly Update remains applicable: "Our guess is that
the gold price will extend its counter-trend rebound over the weeks ahead,
but be aware that until there is a daily close above $1220 there will be a
significant near-term risk of a decline to a new low for the year."
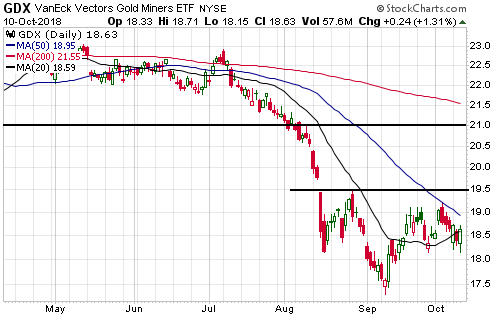
Gold Stocks
In the latest Weekly Update we
wrote that a decline in the broad stock market shouldn't pose a threat to
the gold-mining indices unless it develops into a crash. All equities
would get clobbered in a crash, but the gold-mining sector can benefit
from non-crash-like weakness in the broad stock market. That's especially
so when the gold sector is depressed prior to the start of the weakness in
the broad market.
Even though the gold price was flat, the
gold-mining indices and ETFs held up well during Wednesday's broad market
sell-off. As illustrated below, GDX is roughly unchanged since the end of
last week.
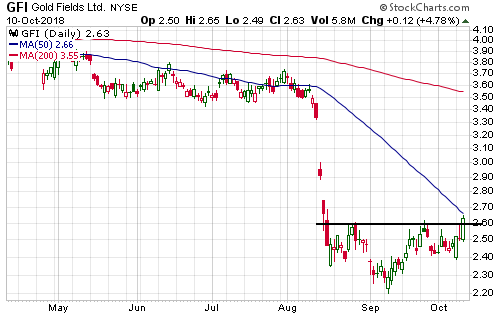
Gold Fields Ltd. (GFI), a major gold producer that we are focused on
at the moment, is beginning to outperform and achieved a marginal upside
breakout on Wednesday (see chart below). If Wednesday's breakout is
maintained over the final two days of this week, it will suggest a
near-term target of US$3.00.
It still appears as if a) the gold-mining sector is basing and stands
a good chance of rallying over the next few weeks, b) the rally from the
September low is another counter-trend move within a longer-term bearish
trend.
Updates on Stock Selections
Notes: 1) To review the complete list of current TSI stock selections, logon at
http://www.speculative-investor.com/new/market_logon.asp
and then click on "Stock Selections" in the menu. When at the Stock
Selections page, click on a stock's symbol to bring-up an archive of
our comments on the stock in question. 2) The Small Stock Watch List is
located at http://www.speculative-investor.com/new/smallstockwatch.html
![]() More
information about last week's crash in the Golden Arrow (GRG.V) stock
price
More
information about last week's crash in the Golden Arrow (GRG.V) stock
price
In the latest Weekly Update we wrote: "On
Wednesday of last week the GRG stock price plummeted from C$0.35 to C$0.23
and then recovered to around C$0.30 on the highest daily trading volume in
5 years and the second-highest daily trading volume in the stock's
history...
...There was no news to explain the action and we
suspect that it had nothing to do with any company-specific developments.
Our best guess is that it was due to an institutional shareholder dumping
its stake for tax purposes."
Thanks to information provided by
one of our readers (thanks JR), we now know what caused the 'out of the
blue' high-volume plunge in the price of GRG shares immediately after the
start of trading on Wednesday 3rd October. It was caused by a sell
recommendation by a widely followed newsletter. Specifically, until last
week GRG was one the "Favourite Five" silver-mining stocks recommended by
John Doody's Gold Stock Analyst (GSA) newsletter. After the close of
trading on 2nd October, GSA called "sell" on the stock. This caused an
avalanche of selling when trading commenced the next day.
Significantly, Joe Grosso, GRG's chairman, was a buyer during the
sell-off. Mr. Grosso bought 450K shares during 3rd-5th October.
Chart Sources
Charts appearing in today's commentary
are courtesy of:
https://stockcharts.com/
http://www.vanadiumprice.com/
![]()